Optimisation of Distribution Network Configuration with
the Aid of Co-Evolutionary Algorithm with Regard for
Reliability Coefficients Varying During Operation of
Network Elements
Jan Stępień, Sylwester Filipiak
*Electrical Engineering, Automatics and Computer Science Faculty University of Technology Kielce, 25-314, Kielce, Aleja Tysiąclecia Państwa Polskiego
*Corresponding Author: [email protected]
Copyright © 2014 Horizon Research Publishing All rights reserved.
Abstract
The problem analysed in the article concerns the designation of substitute post breakdown configurations of electric power distribution networks, enabling restoration of electric power delivery to the greatest possible numbers of network reception nodes. The drawn up method concerns the problem of multi-criteria optimisation. In the method used to evaluate and optimise distribution network configurations, the co-evolutionary algorithm is used cooperating with classifier system with regard to variable coefficients of reliability during operation of network elements. An important trait of the proposed method is the possibility of formulating substitute network configurations with the use of information originating from simulated breakdown network statuses, with the specification of information that may be used on reliability parameter values, durations of exploitation of network elements etc.Keywords
Evolutionary Algorithms, DistributionPower Networks
1. Introduction
The duration of interruptions in the supply of electric power and the manner of elimination of interruptions and operation limitations is dependent on network system structure, system configuration and distribution appliances equipment and network automation enabling the performance of reserve connections [1, 3, 4, 5].
The analysed problem consists of seeking substitute configurations of the electric power distribution network enabling the restoration of electric power supply, in the case of breakdown, the greatest number of network reception nodes. The drawn up method concerns the problem of multi-criteria optimisation using for assessment and
optimisation of distribution network configurations level of reliability, the classifying system cooperating with the co-evolutionary algorithm with regard to network elements reliability coefficients that are variable during operation.
An important trait of the proposed method is the possibility of formulating substitute network configurations by application of information derived from simulated network breakdown states, for the definition of which reliability parameter values information, network elements operation times etc may be used.
Below is presented a comparison of possibilities and limitations of existing methods [1, 6, 7, 8, 13-16] and of a new method proposed for designation of post-breakdown of electric power networks configuration scenarios. In the case of using heuristic algorithms search, their use is hindered in the case of calculations for a large number of nodes of the analysed network. In such cases assumptions limiting the space of solutions may be applied, which reduces the calculation process, but causes search for suboptimal solutions. The virtue of application of evolutionary algorithms to the analysed problem is the possibility of their use with a large number of decision variables and complex description of objective function and limiting conditions. This type of method may be used for optimising the operation of electric power systems with a very large number of elements. The possibility also exists of applying co-evolutionary algorithms to the analysed task, enabling solutions of multi-criteria tasks. In this case the sought-after solution is a set of Pareto- optimal solutions.
of implementation of the process of designating replacement distribution network configuration scenarios, for the most probable malfunction situations. Reliability characteristics and durations of exploitation of network elements arise from consideration at this stage of selection of simulated states of breakdown of the analysed network. The result of the performed works is the drawing up of an effective method enabling rapid designation of substitute network configurations, also for very complex network structures. The method may be used in information systems currently managing electric power network distribution operation.
2. Changeability of Reliability
Properties of Network Elements
during Time Operation
Research conducted by the authors [4, 5, 10] has shown that the reliability functions of medium voltage 15 kV cable, may be presented with the aid of Weibull distribution of function figures − = ν b t t
R() exp (1)
where: t – duration of operation,
b – Weibull distribution parameter scale, ν – Weibull distribution parameter shape.
From the point of view of cable operation an important function is intensity of damage in relation to the duration of operation λ(t), which for the reliability function of the described Weibull distribution has form [10]:
1
)
(
−
=
νν
λ
b
t
b
t
(2)Analysing expression (2) may demonstrate, that the course of intensity of damage function λ(t), described with the aid of Weibull distribution, is strongly dependent on the values of shape parameter ν. If 0 < ν < 1, this function λ(t) is a monotonically diminishing function, if ν = 1, the Weibull distribution passes into exponential distribution and λ(t) = const and where ν > 1 the function λ(t) increases monotonically.
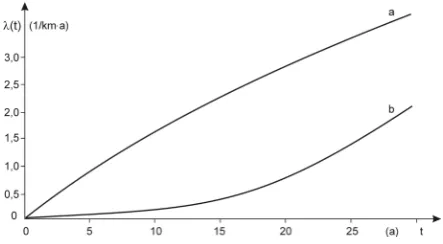
On the basis of the empirical research conducted and theoretical calculations, the parameters of the reliability function of 15 kV cable with paper and polyethylene insulation have been defined. The result is, that the parameters of Weibull distribution shape ν > 1.0 for cable with paper insulation and ν >2.0 for cable with polyethylene insulation. In figure 1 is presented comparison of typical cable damage intensity with paper and polyethylene insulation.
As results from research, the intensity of breakdown of electric power cable is dependent on the operation duration and increases with the lengthening of this time. From this it
[image:2.595.321.543.119.241.2]results that the coefficients of reliability of particular sections of electric power distribution networks shall also vary.
Figure 1. Comparison of forms of breakdown intensity of 15 kV cable with insulation: a) polyethylene, b) paper
Time of renewal ta is dependent on the quality of the work of operational services and the extent of the breakdown. For this reason the value of the average time of renewal and its breakdown may differ for various electric power cable constructions. Research performed by the authors [4, 5, 10] confirms this hypothesis, because the value of the average time of renewal of cable with paper insulation amounts to E(ta) = 12.87 h whereas the time for cable with polyethylene insulation is E(ta) = 10.83 h, that is equal to 0.87 of the value of the cable with paper insulation. On the basis of the research conducted it may be stated that the distribution of renewal of cable lines are logarithmic-normal distributions of which the function of density f(ta) of random variable ta defines the dependence:
(
)
− −= 2 2
2 lg exp 2 ) ( σ π σ m t t M t f a a
a (3)
in which M = lg e = 0.4343 if Y = lg X and M = 1 if Y = ln X. The shape of the function of density of distributions is non-symmetrical, which results from the low probabilities of occurrence of large values of renewal time.
With regard to the above the coefficient of reliability pij
i-th of element (i = 1.2, …, m), is found in j-th of year of exploitation (k = 1.2, …, n), with regard to variables in time of intensity of damage may be expressed by the formula:
T t E
p ij aij
ij
) ( 1− ⋅
=
λ
(4)in which: λik - is the intensity of breakdown in a given group
of cables (1/a) i-th of the element being in k-th of the year of exploitation, E(taik) – value of average renewal time.
According to formula (2) for i-th of element, which is in k-th of the year of exploitation of the cable the value of intensity may be written as
1 −
=
vi
b
v
b
j
λ
(5)T t E b j b v p aij v ij ) ( 1 1 − −
= (6)
Because for the given section of cable, the values T and E(taik) are constant, the coefficient of reliability pik may be
presented with the aid of the expression
1
1
−
⋅
−=
vij
k
j
p
(7)in which T t E b v k aij v ) (
= (8)
3. Method Using Classifying System and
Co-Evolutionary Algorithm
The applied classifying system has already been presented in the previous publication [12], below is presented a description of the proposed changes introduced to the algorithms of that system. The classifying system contains three basic components: the communications creation system, assessment system and evolutionary algorithm.
In the classifying system, information from the external environment is processed into communications in a specified format, which are then placed on the list of communications, where they are able to cause activation of classifiers. A classifier is a rule with ascribed components [12]: <classifier> :: = <condition> : <communication>.
In the applied classifying system such a registration is accepted, describing the breakdown status of the network containing a list of numbers of nodes deprived of power supply and list of numbers of damaged elements. Whereas the classifier contains a list of numbers of nodes deprived of power supply and a list of numbers of damaged elements and also contains coded substitute post breakdown network configuration.
The co-evolutionary algorithm applied to the analysis task creates the m populations; in each of them the function applied is defined on the basis of another vector component quality indicator. After performance of succession (supplementation of population with new elements), then before renewed reproduction, these populations are combined, and then once again divided so, that each element of the population may reach the chosen population. The sought-after solution is the Pareto-optimal set of solutions.
In the process of evolutionary simulation most frequently crossing and mutation operators are used, enabling directed, but simultaneously random exchange of genetic information. Algorithm parameters accepted for calculations: probability of crossing pk=0.90 and mutation pm=0.15, numbers of
subpopulation m=70÷90. In order to code the characters representing different variations of network configuration in the form of a tree type graph, registration of chromosomes is accepted in the form of an inversion vector structure. Each
inversion vector component corresponding to the number of a given node in the tree (graph), is equivalent to the number of a power supply node. As a selection method known in the literature the random choice selection method according to ‘remains without repetition’ is used. In order to create new solutions in the algorithm, two specialised reconfiguration operators are applied, the description of which is contained in work [11].
The following limitation conditions are accepted for calculations:
not exceeding maximal dispatch currents of line sections,
not exceeding permissible voltage drops of network nodes supply routes.
4. Optimising Criteria
For the analysed problem, as significant from the point of view of fulfilment of requirements concerning the effective use of network, criteria are accepted:
)} ( ), ( ), ( ), ( ), ( { ) (
minx∈S F x = f1 x f2 x f3 x f4 x f5 x (9)
where: F(x) - vector function of objective, S – network configuration set.
minimisation of the number of connection factors leading to obtaining substitute network
configuration:
)
min(
)
(
01
x
n
n
f
j=
j−
(10)wherej=1,2,..., m
in which: f1(x) - value of this function defining the number of
connection factors essential to obtaining specified network configuration,
xj - vector containing information on j-th configuration
variant,
m - number of considered solution variants,
nj - number of connection actions leading to obtaining
specified network configuration,
n0 - number of connection actions in base configuration. maximal level of reliability of supply of electric
power to recipients:
)}
1
min{max(
)
(
2
x
jp
ikf
=
−
(11)in which: f2(x) - value of this function defining value of
resultant coefficient of reliability of supply route of specified recipient nodes,
pik - coefficient of reliability of supply track i-th w of
recipient node designated for k-th of year of cable exploitation,
minimisation of voltage deviation in network nodes:
)}
100
/
min{max(
)
(
3
x
j=
U
iU
N⋅
f
(12)in which: f3(x) - value of this function defining the value of
UN - nominal voltage of distribution network, Ui- voltage
value in i-th nodes in reception network,
minimisation of technical losses in analysed distribution system:
)}
(
min{
)
(
1 4∑
=∆
⋅
+
∆
=
gi i e i
j
P
k
Q
x
f
(13)in which: f4(x) - value of this function defining the value of
technical losses for given network configuration variant, g - number of sections underload in given network configuration variant,
i
P
∆
- value of loss of power in i-th network section, ke – electric power equivalent of passive power minimisation of loading coefficient of the group ofmost loaded network elements:
]}
/
)
min{max[(
)
(
1 max, 5 l n i ij
P
n
x
f
∑
=
=
(14)in which: f5(X) - the value of this function defines the value
of the loading coefficient of the group of most loaded network elements, n - number of supply tracks of recipient nodes, nl- number of elements in given group.
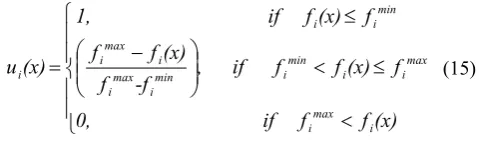
Affiliation functions described in particular criteria are considered in optimisation model defined as follows:
< ≤ < − ≤ = (x) f f if 0, f (x) f if f , -f f (x) f f f (x) f if 1, (x) u i max i max i i min i min i max i i max i min i i
i (15)
5. Calculation Example
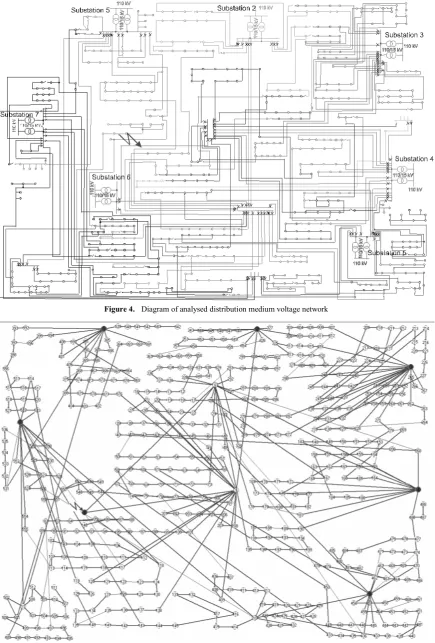
Calculation problems concerning designation of distribution network configuration for breakdown work statuses may arise from damage to network elements, their overloading or exceeding permissible voltage deviations in network nodes. Considered breakdown status of medium voltage electric power distribution network (for which diagram and graph are presented in fig. 4 and 5) arising from damage to medium voltage line originating from Main Supply Point with number 6, k that supplies distributor station 8. The consequence of this breakdown is that a significant number of network nodes are deprived of power supply. The sought-after (with the aid of co-evolutionary algorithm) solution is substitute network configuration with radial recipient nodes supply structure.
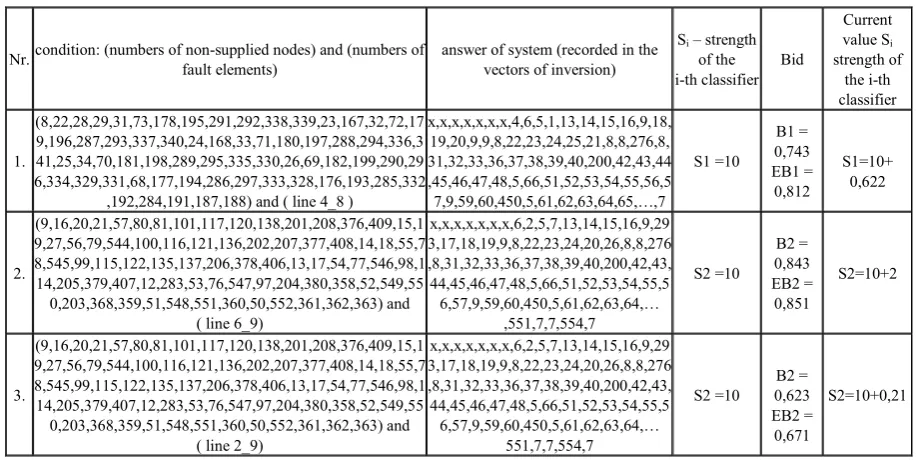
As a result of the first implemented stage of the process of creating communications, sought-after classifiers are presented in table 1. In the column concerning network configuration registered in inversion vectors, only the initial and final elements of this vector are registered. According to the idea of classifying systems after the process of creation of communications, follows the evaluation of the produced
classifiers, which depends on the calculation of so-called classifiers’ offers being the measure of their suitability to resolve the analysed task.
As a result of the performance of the process of creation and evaluation of communications performed in the first stage as the classifier with the best offer is designated classifier number 2 (table 1). As a result of performance of the process of creation of communications and evaluation of active classifiers, information is obtained (concerning possible variants of changes in network configuration), which are utilised in the creation of a population of solutions variants used subsequently by evolutionary algorithm.
[image:4.595.60.300.385.460.2]This algorithm operates simultaneously on 5 sub-populations for which each evaluation was based on of another adaptation function (dependences 10 to 15). The sought-after solution in this case is the set of solutions in the form of alternative configurations of the analysed network. The selection of the final solution variants depends on the decider, which in this case may be the operator managing the work of the medium voltage electric power distribution network. An exemplary course of the process of designating the best solutions in sub-populations no. 1 - 5 is presented in figures 2 and 3.
Figure 3. The course of changes of the best solution of sub-populations 4-5
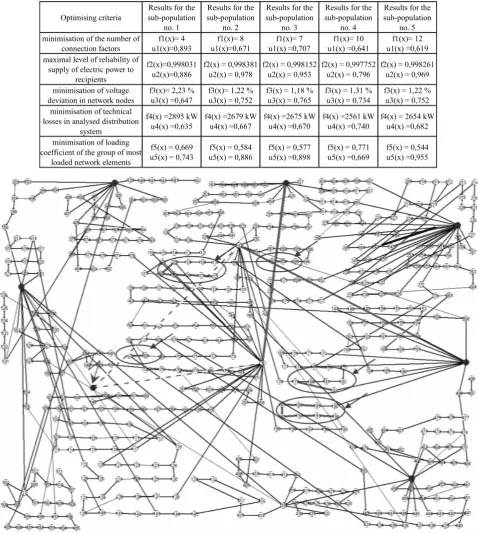
As a solution to the task of designating the substitute network configuration of the analysed breakdown status, the best solution variants are accepted from 5 sub-populations, on which the co-evolutionary algorithm has been used. Information concerning the best-obtained solutions is shown in table 2.
Final selection of substitute network configuration (from the set of solutions obtained) to the existing breakdown state may be made by the operator the medium voltage electric power distribution network.
In the co-operation of the co-evolutionary algorithm with
the classifying system for the classifier set there may only be the best solutions obtained from particular solutions sub-populations.
On fig. 6 is presented in a post-break down example configurations of the analysed distribution network, sought as the best in sub-population no. 3.
6. Conclusions
The presented method is typified by the short time of designation of rational post-break down configurations of complex overhead and cable medium voltage electric power distribution networks. The performed calculations for the modelled actual urban distribution cable network system, (with 556 nodes) gave positive results. On the basis of research results till now, the authors assume that the obtained results of works may be used to create deciding procedures in the management of complex distribution network systems, with particular regard to breakdown work situations.
The drawn up method using the classifier system cooperating with the co-evolutionary algorithm enables effective creation of substitute medium voltage distribution network configuration scenarios. The method may be used in systems managing current operation of distribution network to aid operators in taking decisions concerning connection actions in supervised electric power systems.
[image:5.595.75.535.507.737.2]In the method are equally considered the variability of the coefficient of reliability of network elements depending on exploitation time and future scenarios due to which they may equally be considered with regard to change of reliability of electric power network.
Table 1. Sought after active classifiers in classifier set
Nr. condition: (numbers of non-supplied nodes) and (numbers of fault elements) answer of system (recorded in the vectors of inversion) Si – strength of the
i-th classifier Bid
Current value Si
strength of the i-th classifier
1.
(8,22,28,29,31,73,178,195,291,292,338,339,23,167,32,72,17 9,196,287,293,337,340,24,168,33,71,180,197,288,294,336,3 41,25,34,70,181,198,289,295,335,330,26,69,182,199,290,29 6,334,329,331,68,177,194,286,297,333,328,176,193,285,332
,192,284,191,187,188) and ( line 4_8 )
x,x,x,x,x,x,x,4,6,5,1,13,14,15,16,9,18, 19,20,9,9,8,22,23,24,25,21,8,8,276,8, 31,32,33,36,37,38,39,40,200,42,43,44 ,45,46,47,48,5,66,51,52,53,54,55,56,5 7,9,59,60,450,5,61,62,63,64,65,…,7
S1 =10
B1 = 0,743 EB1 = 0,812
S1=10+ 0,622
2.
(9,16,20,21,57,80,81,101,117,120,138,201,208,376,409,15,1 9,27,56,79,544,100,116,121,136,202,207,377,408,14,18,55,7 8,545,99,115,122,135,137,206,378,406,13,17,54,77,546,98,1 14,205,379,407,12,283,53,76,547,97,204,380,358,52,549,55 0,203,368,359,51,548,551,360,50,552,361,362,363) and
( line 6_9)
x,x,x,x,x,x,x,6,2,5,7,13,14,15,16,9,29 3,17,18,19,9,8,22,23,24,20,26,8,8,276 ,8,31,32,33,36,37,38,39,40,200,42,43, 44,45,46,47,48,5,66,51,52,53,54,55,5 6,57,9,59,60,450,5,61,62,63,64,…
,551,7,7,554,7
S2 =10
B2 = 0,843 EB2 = 0,851
S2=10+2
3.
(9,16,20,21,57,80,81,101,117,120,138,201,208,376,409,15,1 9,27,56,79,544,100,116,121,136,202,207,377,408,14,18,55,7 8,545,99,115,122,135,137,206,378,406,13,17,54,77,546,98,1 14,205,379,407,12,283,53,76,547,97,204,380,358,52,549,55 0,203,368,359,51,548,551,360,50,552,361,362,363) and
( line 2_9)
x,x,x,x,x,x,x,6,2,5,7,13,14,15,16,9,29 3,17,18,19,9,8,22,23,24,20,26,8,8,276 ,8,31,32,33,36,37,38,39,40,200,42,43, 44,45,46,47,48,5,66,51,52,53,54,55,5 6,57,9,59,60,450,5,61,62,63,64,…
551,7,7,554,7
S2 =10 0,623 B2 = EB2 = 0,671
Figure 4. Diagram of analysed distribution medium voltage network
Table 2. Information on sought-after solutions sets
Optimising criteria sub-population Results for the no. 1
Results for the sub-population
no. 2
Results for the sub-population
no. 3
Results for the sub-population
no. 4
Results for the sub-population
no. 5 minimisation of the number of
connection factors u1(x)=0,893 f1(x)= 4 u1(x)=0,671 f1(x)= 8 u1(x) =0,707 f1(x)= 7 u1(x) =0,641 f1(x)= 10 u1(x) =0,619 f1(x)= 12 maximal level of reliability of
supply of electric power to recipients
f2(x)=0,998031
u2(x)=0,886 f2(x) = 0,998381 u2(x) = 0,978 f2(x) = 0,998152 u2(x) = 0,953 f2(x) = 0,997752 u2(x) = 0,796 f2(x) = 0,998261 u2(x) = 0,969 minimisation of voltage
deviation in network nodes f3(x)= 2,23 % u3(x) =0,647 f3(x)= 1,22 % u3(x) = 0,752 f3(x) = 1,18 % u3(x) = 0,765 f3(x) = 1,31 % u3(x) = 0,734 f3(x) = 1,22 % u3(x) = 0,752 minimisation of technical
losses in analysed distribution system
f4(x) =2895 kW
u4(x) =0,635 f4(x) =2679 kW u4(x) =0,667 f4(x) =2675 kW u4(x) =0,670 f4(x) =2561 kW u4(x) =0,740 f4(x) = 2654 kW u4(x) =0,682 minimisation of loading
coefficient of the group of most loaded network elements
f5(x) = 0,669
u5(x) = 0,743 u5(x) = 0,886 f5(x) = 0,584 f5(x) = 0,577 u5(x) =0,898 f5(x) = 0,771 u5(x) =0,669 f5(x) = 0,544 u5(x) =0,955
Figure 6. Graph of analysed distribution network with marked changes in network configuration
REFERENCES
[1] B. Oral F., Dönmez, “Analysis of the Power Blackout in the Marmara Earthquake” Electronics and Electrical Engineering - Kaunas: Technologija, 2010. - No. 8(104). - p. 77-80. [2] E. Bobric, Cartina C., G. Grigoras, “Fuzzy Technique used
for Energy Loss Determination in Medium and Low Voltage Networks” Electronics and Electrical Engineering - Kaunas: Technologija, 2009. - No. 2(90). - P. 95-98.
[3] J. Stępień, Z. Madej, “Evaluation of structural redundancy efects in medium voltage cable networks”. Rynek Energii No 4(83), 2009, pp. 55-62.
[5] J. Stępień, “Evaluation of structural redundancy effects in medium voltage cable networks”. Przegląd Elektrotechniczny Volume: 84 Issue: 4 p. 128-131 Published: 2008.
[6] L. Augugliaro, E. Dusonchet, “Multiobjective service restoration in distribution networks using an evolutionary approach and fuzzy sets”. Electrical Power and Energy Systems, 2000. - No. 22. - 103-110.
[7] S. Toune, H. Fudo, T. Genji, “Fukuyama Y. Comparative study of modern heuristic algorithms to service restoration in distribution systems” IEEE Trans. Power Delivery vol. 17, Jan. 2002, pp. 173-181.
[8] Y. Kumar; B. Das, J. Sharma, “Multiobjective, Multiconstraint Service Restoration of Electric Power Distribution System With Priority Customers”. IEEE Transactions on Power Delivery, 2008. - No. 23, Issue 1. - P. 261-270.
[9] Y. Y. Hong, S. Y. Ho, “Determination of network configuration considering multiobjective in distribution systems using genetic algorithms”. IEEE Trans. Power Systems, vol. 20, no. 2, May 2005, pp. 1062-1069.
[10] J. Stępień: Forecast of heat demands in the low urbanized areas, Rynek Energii, vol. 73, Issue: 6 p. 7-12 Published: DEC 2007.
[11] S. Filipiak: Application of evolutionary algorithm and classifier system in optimisation of electric power distribution networks post-fault configuration. International Review of Electrical Engineering vol. 5 n. 3, June 2010, p. 1151-1158. [12] D. E. Goldberg, “Genetic Algorithms and Their
Applications”. WNT, Warszawa 2003.
[13] T. Niknam, E. A. Farsani, M. Nayeripour, B. B. Firouzi: Hybrid fuzzy adaptive particle swarm optimization and differential evolution algorithm for distribution feeder reconfiguration. Electric Power Components and Systems, vol. 39, Issue 2, 2011, p. 158 – 175.
[14] J. B. V. Subrahmanyam, C. , Radhakrishna: A simple method for feeder reconfiguration of balanced and unbalanced distribution systems for loss minimization. Electric Power Components and Systems, vol. 38, Issue 1, 2010, p. 72 - 84. [15] K. N. Miu, H. D. Chiang, B. Yuan, and G. Darling, "Fast
service restoration for large-scale distribution systems with priority customers and constraints", IEEE Transactions on Power Systems, vol. 13, no. 3, Aug, 1998, pp. 789-795. [16] S. Porkar, P. Poure, A. Abbaspour-Tehrani-fard, S. Saadate,