International Journal of Emerging Technology and Advanced Engineering
Website: www.ijetae.com (ISSN 2250-2459, Volume 2, Issue 3, March 2012)60
Numerical Characterization of Rectangular Waveguide in
Free Space using HFSS Software at Lower Microwave
Frequencies
A. Das
1, M.Sarkar
2, R. Das
3, D. Das
4, P. Debnath
5 1,2,3,4 U.G Student, RCCIIT, C.S.Road, Kolkata-700015 5Assistant Professor, RCCIIT, C.S.Road, Kolkata-700015
1[email protected] 2[email protected]
4[email protected] 5[email protected]
Abstract— Guiding characteristics along with field distributions for different modes in a rectangular waveguide are numerically estimated using HFSS software when it is placed in free space. A comparative analysis is made for propagation constant, guided wavelength and characteristic impedance at C, X and Ku band to observe the deviation from well-known theoretical profiles. Strength of electric and magnetic fields at microwave region is analyzed inside the waveguide along with fundamental four modal distributions. Characteristic profiles are useful for analyzing performance of rectangular waveguide for a particular frequency region. Simulations are carried out using HFSS software and compared with theoretical results obtained from MATLAB which speaks about its accuracy for designing and analyzing complex microwave passive devices.
Keywords— Characteristic Impedance, Field Intensity, HFSS®, MATLAB®, Propagation Constant, Rectangular Waveguide.
I. INTRODUCTION
Theoretical analysis of transmission line structures for field distribution has been carried out by several researchers in long decade ago at different frequency ranges of interest suitable to the particular applications [1-3]. With the progress of communication technology towards higher frequency range precisely for availability of larger bandwidth, analysis of transmission lines are carried out at microwave and millimeterwave frequencies. Thus accurate characterization of waveguide structures is very important, which depends on its geometrical shape, and also on the properties of the medium.
Theoretical formulae for propagation characteristics and also for resistive profiles are derived earlier, but variation of the simulated profiles from the theoretical results for higher order modes [4] are considered one fundamental area of research. Distribution of electric and magnetic fields are also having prime importance regarding the consideration of waveguides as fundamental components of integrated optical circuits.
International Journal of Emerging Technology and Advanced Engineering
Website: www.ijetae.com (ISSN 2250-2459, Volume 2, Issue 3, March 2012)61 In the present paper, propagation constant, guided wavelength and characteristic impedance of a rectangular waveguide are simulated using HFSS software for first four modes, and results are compared with the theoretical data obtained from mathematically established relationships. Along with characteristic profiles, field distributions are also simulated and electric and magnetic field intensities are computed inside the structure. Total theoretical analysis is carried out in C, X and Ku bands. This analysis will become helpful to study the fundamentals of rectangular waveguide, and also to estimate the accuracy of HFSS-based design in connection with rectangular electromagnetic structures at different modes.
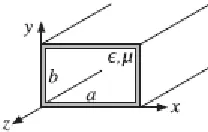
[image:2.612.114.218.363.429.2]II. MATHEMATICAL MODELING
Figure 1: Schematic figure of rectangular waveguide
Consider the case of a rectangular hollow waveguide (filled by air), with conducting walls, as shown in Fig1. Without loss of generality, it is assumed that the lengths a, b of the inner sides satisfy b ≤ a. The guide is typically filled with air, but any other material with different permittivity and permeability may be assumed.
For TEmn mode of a rectangular waveguide, propagation
constant is given by-
2
)
/
(
1
c (1)where ωc is the cut-off frequency, μ is the permeability and
ε is the permittivity of the medium.
The propagating wavelength, also renamed as guided wavelength, is given by-
2
)
/
(
1
c g
(2)where λ is the wavelength in unbounded dielectric. Characteristic impedance is defined as-
2
)
/
(
1
c
Z
(3)where η is the intrinsic impedance of the unbounded dielectric.
III. NUMERICAL ANALYSIS
Comparative analyses are carried out for characteristic properties of the rectangular waveguide structure for first four modes. It may be found out from the profile of propagation constant that for higher order modes (TE11/TM11), simulated plot is deviated from theoretical
computed results, and the deviation is considered compared to the profile of TE10 mode. For each mode, it can be
observed that the rate of increment of propagation constant reduces with increase of frequency. This is shown in fig 2.
[image:2.612.324.553.467.643.2]
International Journal of Emerging Technology and Advanced Engineering
Website: www.ijetae.com (ISSN 2250-2459, Volume 2, Issue 3, March 2012)62 Fig 3 shows the guided wavelength profile, where the parameter for a particular mode reduces with increase in frequency. For very high value of frequency, it almost becomes constant. Here also deviation is observed for higher order modes. It can be noted that the profile for TE11
[image:3.612.55.281.224.402.2]and TM11 will be the same.
Figure 3: Guided wavelength profile of rectangular waveguide at C, X and Ku bands
Figure 4: Impedance profile of rectangular waveguide at C, X and Ku bands
Fig 4 shows the impedance profile, where the impedance for a particular mode reduces with increase in frequency.
From the above figure it is observed that for a particular TE mode, impedance gradually decreases with increase in frequency and it becomes almost constant for higher values of frequency. A significant amount of deviation may be observed between these profiles, which are very important for modal analysis in various electromagnetic applications.
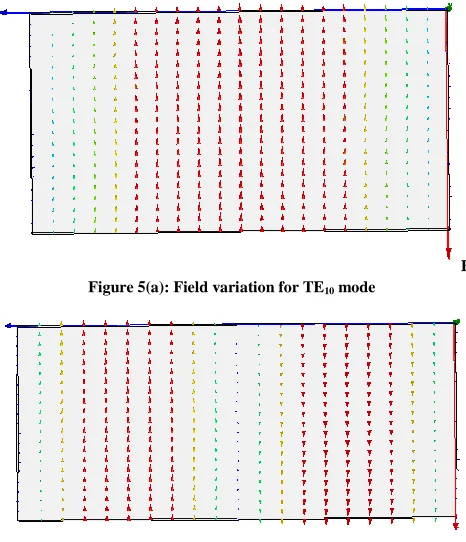
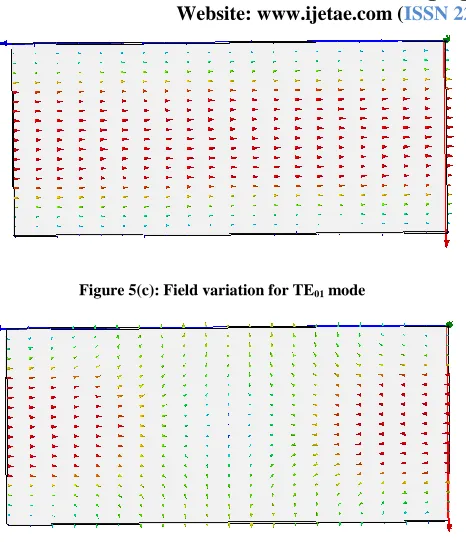
Analysis of field distribution for different modes is carried out using HFSS software. Figure 5(a)-5(d) shows the E & H field variations inside the waveguide for TE10,
TE01, TE20 & TE11 modes. It may be noted down that
electric fields are vertically directed for the TE10 and TE20
modes, but horizontally distributed for TE01 mode. For
TE11 mode, both types of distributions can be observed at
different spatial portions of the waveguide. Results obtained from simulation have the exact nature already computed from eminent researchers [8, 10-11].
F Figure 5(a): Field variation for TE10 mode
[image:3.612.328.561.366.637.2] [image:3.612.55.279.452.627.2]International Journal of Emerging Technology and Advanced Engineering
Website: www.ijetae.com (ISSN 2250-2459, Volume 2, Issue 3, March 2012)63
Figure 5(c): Field variation for TE01 mode
Figure 5(d): Field variation for TE11 mode
[image:4.612.57.290.118.389.2]Variation of field distribution inside the waveguide is the most crucial factor regarding the use of the electromagnetic structure in various applications. Though it can be safely assumed that the intensity is maximum at the mid-region, but its variation towards the ends are non-uniform in nature and it can be pictorially represented in fig 6 & fig 7. Also from the 3D graphs, it can be observed that the change of intensity zones are not the step functions, rather it decreases in an exponential fashion.
Figure 6: Electric field variation inside rectangular waveguide
Figure 7: Magnetic field variation inside rectangular waveguide
IV. CONCLUSION
Properties of a rectangular waveguide can be obtained from the numerical simulation using finite element method, and this result can be verified with already existing theoretical results. Simulation is carried out at lower microwave frequencies, i.e., at C, X and Ku bands, since this is important for practical purposes, and to carry out simple experiments using microwave bench. Different modes are considered for analytical purpose to estimate the small deviations from the theoretical results. Field distributions are also simulated along with intensity profiles to understand the properties. This investigation is helpful for simple experimental analysis using rectangular waveguide at lower microwave frequency regions. The above analysis will help to model a new application of corrugated rectangular waveguides as left-handed meta-material transmission lines.
References
[1] Jiao, C. Q, 2011, “Selective Suppression of Electromagnetic Modes in a Rectangular Waveguide by using Distributed Wall Losses”, Progress in Electromagnetics Research Letters, vol. 22, pp. 119-128.
[2] Simon, W, Werthen, M. and Wolff, I, 1998, “A Novel Coplanar Transmission Line to Rectangular Waveguide Transition”, IEEE MTT-Society International Symposium Digest. pp. 257-260.
[3] Zhao, D, Ding, Y. G, Wang, Y. and Ruan, C. J, 2010, “Linear Analysis of a Rectangular Waveguide Cyclotron Maser with a Sheet Electron Beam”, Phys. Plasmas, vol. 17, p. 113110.
[image:4.612.330.558.132.266.2] [image:4.612.52.284.550.690.2]International Journal of Emerging Technology and Advanced Engineering
Website: www.ijetae.com (ISSN 2250-2459, Volume 2, Issue 3, March 2012)64
[5] HFSS: High Frequency Structure Simulator based on the Finite Element Method, v. 9.2.1, Ansoft Corporation, 2004.
[6] Southworth, G C., 1980, Principles and Application of Waveguide Transmission, D Van Nostrand Co., NJ.
[7] Marcueitz, N., 1951, Waveguide Handbook, Rad. Lab. Series, vol. 10, McGraw Hill Book Co., New York.
[8] Collin, R. E., 1966, Foundation of Microwave Engineering, 2nd Edition McGraw-Hill Book Co, New York.
[9] Eshrah, I. A., Kishk, A. A., Yakovlev, A. B. and Glisson, A. W., 2005, “Modal Analysis of Corrugated Rectangular Waveguides Supporting Left-Hand Propagation,” IEEE AP-Society International Symposium Digest.
[10]Pozar, D. M., 1998, Microwave Engineering, 2nd Edition, New York: John Wiley &sons Inc.