2640
Study On The Properties Of Concrete By Using
Nano-Silica
Towseef Sultan, Ashish Kumar, Dr. Sandeep Singla
Abstract: Nano materials are little measured materials with molecule estimate in nano meters. These materials are exceptionally successful in changing the properties of cement at the ultrafine level by the righteousness of their little size. The little size of the particles likewise implies a more prominent surface territory. The quality and porosity of concrete can be improved by the addition of these nano- materials as they fill up minute spaces in the micro-structure. The compressive, flexural and split-tensile strength of concrete is increased due to use of nano-silica in concrete mix.This thesis gives an insight on the effect of Nano –silica of size 236nm on the mechanical properties of concrete. Nano - silica of 0.3%, 0.6%, 0.9% and 1.2% b.w.c. was used for experimental purpose, considerable increase in early-age compressive, split-tensile and flexural strength and a small increase in the overall compressive, split-tensile and flexural strength of concrete was observed.
Key words: Compressive strength, flexural strength, nano-materials, nano-silica, split-tensile strength ————————————————————
1 INTRODUCTION
Concrete is one of the most readily available and basic materials used for construction of structured and its usage has been normally extending in the entire world [1-3]. The reasons for such popularity of concrete are because its ingredients are cheap and are easily available in most parts of the world. However, concrete even though is a champion among the structural materials it still has certain disadvantages like delicacy and poor security from break opening and spread. Concrete is feeble commonly and has low versatility and as such strands are used as a piece of some casing to manufacture its unbending nature and reducing the delicate direct [4]. With time, a lot of examinations have been done to improve the properties of concrete both in new state and hardened state. Various materials known as advantageous cementitious materials or SCMs are added to concrete to improve its properties [5]. A portion of these are fly fiery remains, impact heater slag, rice husk, silica vapor and even bacteria [6]. Of the different advancements being used, nano-innovation seems to be a promising methodology in improving the properties of cement.
2 OBJECTIVE
The principle targets of the present research are as referenced underneath:
To examine the impact of nano-silica on the compressive Strength of concrete at 7, 28 days by replacing the cement with nano silica of 0.3, 0.6, 0.9, and 1.2% by weight of cement.
To examine the impact of nano-silica on the flexure strength of concrete at 7,28days by replacing the cement with nano-silica of 0.3, 0.6, 0.9 and 1.2% by weight of cement.
To examine the impact of nano-silica on the tensile strength of concrete at 7,28days by replacing the cement with nano-silica of 0.3, 0.6, 0.9, 1.2% by weight of cement.
The present examination joins blend configuration dependent on the rules according to Indian Standard code IS 10262-2009. The utilization of any sort of admixture is carefully precluded in the blend plan. The compressive
quality estimations are done for 7-day and 28-day and same was accomplished for split-tensile and flexural quality.
3 MATERIALS
3.1Cement
Cement is the most common and used structural /real estate material. The fundamental materials of cement are Portland concrete, water, fine totals for example sand and coarse totals. The concrete and water shape a glue that solidifies and bonds the totals together. Cement in new state is plastic and can be effectively formed to any shape, over the long haul it solidifies and gains quality. In our work, OPC 53 Grade (Khyber Cement) complying with IS: 455-1989 was utilized. The properties of cement utilized are given in the Table 3.1
Table 3.1: Properties of Portland slag cement
Specific Gravity
Fineness by sieve analysis
Initial setting time(min)
Final setting time(min)
Normal consistency
3.13 2.02% 45 60 32
3.2 Fine Aggregate
Fine aggregate mat be defined as material or aggregate which pass through IS test sifter no.4.75 mm, normally the characteristic stream sand is utilized as a fine total. Fine aggregate is of rakish grains, perfect and free from residue, earth and natural matters. Ocean sand will not be utilized. Sand shapes a significant element of asphalt square.
Table 3.2: Properties of Fine aggregate
Property Fine aggregate
Maximum size(mm) <4.75
Fineness modulus 2.65
2641 Figure 1: Showing Fine Aggregate
3.3 Coarse Aggregate
Coarse aggregate may be defined as material which is held on IS test strainer no.10mm, messed up stone is commonly utilized as a coarse aggregate. The size of coarse total utilized in our study is 10mm. The properties of coarse aggregate used have been listed under in table 3.3
Table 3.3: Properties of Coarse aggregate
Property Coarse aggregate
Specific gravity 2.68
Bulk density(kg/m3) 1656
Fineness modulus 6.77
Water absorption (%) 4.85
Impact value 26.78
Crushing value 26.17
Figure 2: Showing Coarse Aggregate
3.4 Water
Tap water was used in this experiment. The properties are assumed to be same as that of normal water. Specific gravity is taken as 1.00.
3.5 Nano-silica
Nano Silica (NS) is a mineral admixture, fine material with circular particles size 236 μm in diameter. This makes it multiple times littler than the normal bond molecule. Its properties, specifically its compressive quality, bond quality, and abrasion resistance.
Table 3.4: Properties of Nano-silica
Figure 3: Showing Nano-silica
3.6 Super-plasticizer
Poly-carboxlate ether (PCE) is different from ordinary superplasticisers due to the fact as it depends on a one of a kind carboxylic ether polymer with long parallel chains. This incredibly improves cement dispersion which helps in creation of high strength concrete or concrete with great degree of functionality like marine concrete etc.
4 MIX DESIGN OF M-30 GRADE CONCRETE
The blend plan for M30 evaluation of cement is depicted beneath as per Indian Standard Code IS: 10262-2009. PCE superplasticisers was used to improve cement dispersion. A mix proportion of 1: 0.5: 2.3:1.61: 0.004(cement: water: fine aggregate: coarse aggregate: super plasticizer) was adopted. Results are tabled below in table 4.1. The research work was performed at Civil Engineering Department of NIT, Srinagar. The work included mixing, casting and testing of standard specimens.
Table 4.1Adopted Mix design of Concrete
Descriptio n
Ceme
nt Water
Fine aggregat
e
Coarse aggregat e
SP
Ratio by
weight 1 0.5 2.3 1.61
0.00 4 Kg/m3 440.96 220.4 1016.35 710.09 1.76
Physical state Powder form
Specific gravity 2.1
Nano pore rate (ml/g) 0.6
Density(g/m3) 2.4
Molar mass (g/mol) 59.96
Tamped bulk Density(g/l) 40
SiO2 (%) 99.8
2642
8
5 PREPARATION OF TEST SPECIMEN
For directing compressive quality test on solid 3D squares of size 150*150*150mm are casted. Similarly cylinders of size 150 x 300 mm were casted for split-tensile strength and prism of size 100 x 100x 500 mm were casted for flexural strength test. A rotating blend is utilized for careful blending and a vibrator is utilized for good compaction. After effective throwing, the solid examples are de-shaped following 24 hours and inundated in water for 28 days keeping up 27 degree Celsius.
6 CURING OF CONCRETE
A noteworthy piece of the physical properties of bond depend on upon the level of hydration of bond and the resultant microstructure of the hydrated cement. Because of hydration, an arbitrary three dimensional structure is step by step shaped which fills the space possessed by water. The solidified bond glue has a permeable structure and the pores can be separated into two classifications as gel pores and narrow or capillary pores. Hydration of bond happens just when the slender pores stay immersed.
7 TESTS
1. Compressive strength test 2. Split-tensile strength test 3. Flexural strength test
8 RESULTS AND DISCUSSION
In this experimental program, the effect on the properties on concrete by using micro-silica was studied and the results achieved during the experimental study have been discussed as under:
8.1 COMPRESSIVE STRENGTH TEST (in MPa)
The 7 day compressive strength was observed and the values of 3 samples observations are shown. Table 8.1 exhibits the 7 day compressive strength of concrete with maximum nominal size of aggregates of 10mm.
TABLE 8.0 showing Description of Mixes
DESIGNATION
NANO-SILICA CONTENT
(%)
DESCRIPTION
PCC 0% Plain Concrete
NS-1 0.3% Nano-silica
concrete
NS-2 0.6% Nano-silica
concrete
NS-3 0.9% Nano-silica
concrete
NS-4 1.2% Nano-silica
concrete
TABLE 8.1 showing 7 Day Compressive Strength
S. No. PCC NS-1 NS-2 NS-3 NS-4
1 19.5 21.21 24.51 23.39 23.04
2 19.88 20.36 25.78 24.79 22.52
3 19.23 22.14 24.49 23.43 22.51
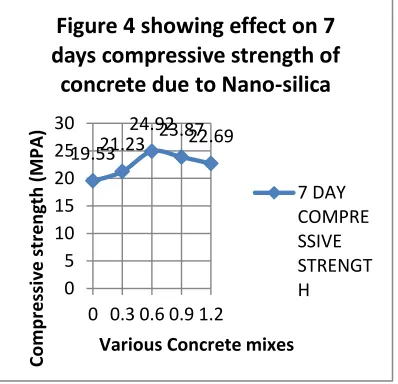
Mean 19.53 21.23 24.92 23.87 22.69
The 7 day compressive strength was plotted on Figure 4 by taking the normal of these three qualities, and an increase in the compressive strength was seen with the addition of fibers .The figure 8 below shows the effect on the 7 day compressive strength by Nano-silica. The mean value of plain M30 observed was 19.53 while as NS-1 mean value was observed 21.23. Similarly NS-2 mean value observed was 24.92, 3 mean value observed was 23.87 and NS-4 mean observed was 22.69. As can be seen in the figure 8 with the increase of Nano-silica, the value of compressive strength increases and the maximum value can be seen at 0.6% Nano-silica. The value is 27.59% increase from plain M-30 without Nano-silica. However after NS-2, the value of compressive strength decreases as compared to the optimum mix. 4.21% & 8.94% decrease in compressive strength was observed at NS-3 and NS-4 respectively when compared to the optimum mix i.e. NS-2.
The 28 day compressive strength was observed and the values of 3 sample observations are shown. Table 8.2 demonstrates the information of 28 days compressive strength obtained. Table 5.2 exhibits the 28 day compressive strength of concrete with maximum nominal size of aggregates of 10mm.The 28 day compressive strength was additionally plotted figure 5 taking the normal of these three qualities, and an increase in the compressive strength was seen with the addition of Nano-silica.
TABLE 8.2 showing 28 Day Compressive Strength
19.53 21.23 24.92 23.87
22.69
0 5 10 15 20 25 30
0 0.3 0.6 0.9 1.2
Co
mpr
e
ssi
ve
st
re
n
gth
(M
PA)
Various Concrete mixes
Figure 4 showing effect on 7
days compressive strength of
concrete due to Nano-silica
2643 S. No. PCC NS-1 NS-2 NS-3 NS-4
1 38.6 39.1 40.3 38.6 38.4
2 38.1 38.9 39 38.8 38.9
3 38.2 39.3 39.8 39.3 38.5
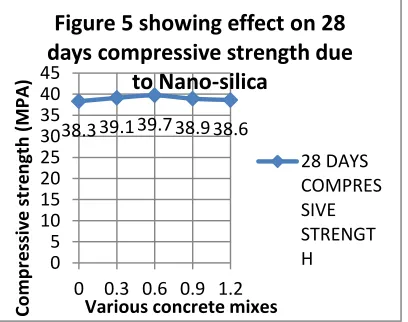
Mean 38.3 39.1 39.7 38.9 38.6
The figure 5 below shows the effect on the 28 day compressive strength by Nano-silica. The mean value of plain M30 observed was 38.3while as NS-1 mean value was observed 39.1. Similarly NS-2 mean value observed was 39.7, NS-3 mean value observed was 38.9 and NS-4 mean observed was 38.60. As can be seen in the graph with the increase of Nano-silica, the value of compressive strength increases and the maximum value can be seen at 0.6% Nano-silica. The value is a 3.65 % increase from plain M-30 without Nano-silica. However after NS-2, the value of compressive strength decreases as compared to the optimum mix. 2.01% & 2.77% decrease in compressive strength was observed at NS-3 and NS-4 respectively when compared to the optimum mix i.e NS-2.
8.2 SPLIT TENSILE STRENGTH (in MPa)
The 7 day split tensile strength was observed and the values of 3 sample observations are shown. Table 8.3 exhibits the 7 day split tensile strength of concrete with maximum nominal size of aggregates of 10mm.The 7 day split tensile strength was plotted on Figure 10 by taking the normal of these three qualities, and an increase in the split tensile strength was seen with the addition of Nano-silica
TABLE 8.3 showing 7 Day Split Tensile Strength
S. No. PCC NS-1 NS-2 NS-3 NS-4
1 2.75 2.61 2.78 2.79 2.74
2 2.55 2.89 3.022 2.86 2.72
3 2.14 2.73 2.96 2.81 2.70
Mean 2.48 2.74 2.92 2.82 2.72
The figure 6 below shows the effect on the 7 day Split-tensile strength by Nano-silica. The mean value of plain observed 2.74. Similarly NS-2 mean value observed was M30 observed was 2.48 while as NS-1 mean value was 2.92, NS-3 mean value observed was 2.82 and NS-4 mean observed was 2.72. As can be seen in the figure with the increase of Nano-silica, the value of compressive strength increases and the maximum value can be seen at 0.6% Nano-silica. The value is a 17.74% increase from plain M-30 without Nano-silica. . However after NS-2, the value of Split-tensile strength decreases as compared to the optimum mix. 3.42% & 6.84% decrease in Split-tensile strength was observed at NS-3 and NS-4 respectively when compared to the optimum mix i.e. NS-2.
The 28 day split tensile strength was observed and the values of 3 sample observations are shown. Table 8.4 exhibits the 28 day split tensile strength of concrete with maximum nominal size of aggregates of 10mm.The 28 day split tensile strength was plotted on Figure 6 by taking the normal of these three qualities, and an increase in the split tensile strength was seen with the addition of Nano-silica.
TABLE 8.4 showing 28 Day Split Tensile Strength
S. No. PCC NS-1 NS-2 NS-3 NS-4
1 3.75 4.74 4.82 4.80 4.61
2 3.98 4.96 5.12 4.87 4.66
3 3.45 4.47 5.66 4.85 4.68
Mean 3.72 4.72 5.20 4.84 4.65
The figure 7 below shows the effect on the 28 day Split-tensile strength by Nano-silica. The mean value of plain M30 observed was 3.78 while as NS-1 mean value was observed 4.72. Similarly NS-2 mean value observed was 5.20, NS-3 mean value observed was 4.84 and NS-4 mean observed was 4.65. As can be seen in the graph with the increase of Nano-silica, the value of compressive strength increases and the maximum value can be seen at 0.6% Nano-silica. The value is a 39.78 % increase from plain M-30 without Nano-silica. . However after NS-2, the value of Split-tensile strength decreases as compared to the
38.3 39.1 39.7 38.9 38.6
0 5 10 15 20 25 30 35 40 45
0 0.3 0.6 0.9 1.2
Co
mpr
e
ssi
ve
st
re
n
gth
(M
PA)
Various concrete mixes
Figure 5 showing effect on 28
days compressive strength due
to Nano-silica
28 DAYS COMPRES SIVE STRENGT H
2.48 2.74 2.92 2.82 2.72
0 0.51 1.52 2.53 3.5
0 0.3 0.6 0.9 1.2
Sp
lit
-tens
ile
st
re
n
gth
(M
PA)
Various concrete mixes
Figure 6 showing effect on 7
days split-tensile strength due
to Nano-silica
2644
optimum mix. 6.92% & 10.57% decrease in Split-tensile strength was observed at NS-3 and NS-4 respectively when compared to the optimum mix i.e. NS-2.
8.3 FLEXURAL STRENGTH (in MPa)
The 7 day flexural strength was observed and the values of 3 sample observations are shown. Table 8.5 exhibits the 7 day flexural strength of concrete with maximum nominal size of aggregates of 10mm.The 7 day flexural strength was plotted on Figure 7 by taking the normal of these three qualities, and an increase in the flexural strength was seen with the addition of Nano-silica.
TABLE 8.5 showing 7 Day Flexural Strength
S. No. PCC NS-1 NS-2 NS-3 NS-4
1 5.112 5.636 6.331 5.92 5.50
2 5.037 5.479 6.203 5.90 5.56
3 5.231 5.692 6.417 5.94 5.62
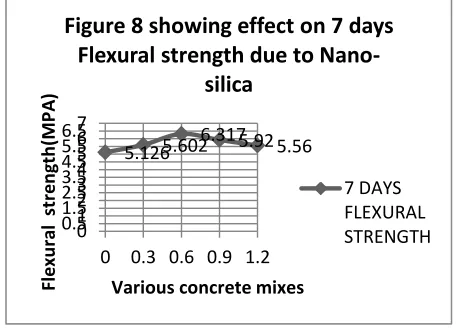
Mean 5.126 5.602 6.317 5.92 5.56
The figure 8 below shows the effect on the 7 day Flexural strength by Nano-silica. The mean value of plain M30 observed was 5.126 MPA while as NS-1 mean value was observed 5.602 MPA. Similarly NS-2 mean value observed was 6.317 MPA, NS-3 mean values observed was 5.92 MPA and NS-4 mean observed was 5.56 MPA. As can be seen in the graph with the increase of Nano-silica, the value of Flexural strength increases and the maximum value can be seen at 0.6% Nano-silica. The value is a 23.23 % increase from plain M-30 without Nano-silica. . However after NS-2, the value of Flexural strength decreases as compared to the optimum mix. 6.28% & 11.98% decrease in Flexural strength was observed at NS-3 and NS-4 respectively when compared to the optimum mix i.e. NS-2.
The 28 day flexural strength was observed and the values of 3 sample observations are shown. Table 8.6 exhibits the 28 day flexural strength of concrete with maximum nominal size of aggregates of 10mm. The 28 day flexural strength was plotted on Figure 8 by taking the normal of these three qualities, and an increase in the flexural strength was seen with the addition of Nano-silica.
TABLE 8.6 showing 28 Day Flexural Strength
S. No. PCC NS-1 NS-2 NS-3 NS-4
1 5.992 7.193 8.029 7.53 6.31
2 5.826 7.072 7.891 7.58 6.19
3 6.038 7.203 8.103 7.57 6.25
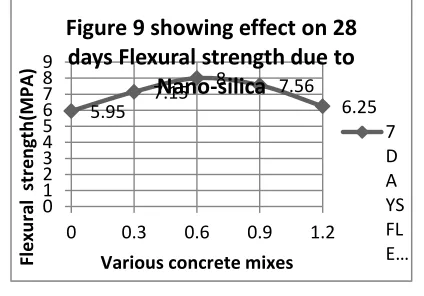
Mean 5.952 7.156 8.007 7.56 6.25
The figure 9 below shows the effect on the 28 day Flexural strength by Nano-silica. The mean value of plain M30 observed was 5.952 MPA while as NS-1 mean value was observed 7.156 MPA. Similarly NS-2 mean value observed was 8.007 MPA, NS-3 mean value observed was 7.56 MPA and NS-4 mean observed was 6.25 MPA. As can be seen in the figure 13 with the increase of Nano-silica, the value of Flexural strength increases and the maximum value can be seen at 0.6% Nano-silica. The value is a 34.52 % increase from plain M-30 without Nano-silica. However after NS-2, the value of Flexural strength decreases as compared to the optimum mix. 5.58% & 21.94 % decrease in Flexural strength was observed at NS-3 and NS-4 respectively when compared to the optimum mix i.e. NS-2.
3.72
4.72 5.2 4.84 4.65
0 0.51 1.52 2.53 3.54 4.55 5.56
0 0.3 0.6 0.9 1.2
Sp
lit
-tens
ile
st
re
n
gth
(M
PA)
Various concrete mixes
Figure 7 showing effect on 28 days
split-tensile strength due to
Nano-silica
28 DAYS SPLIT-TENSILE STRENGTH
5.126 5.602 6.317 5.92 5.56
0 0.51 1.52 2.53 3.54 4.55 5.56 6.57
0 0.3 0.6 0.9 1.2
Fl
e
xu
ra
l
st
re
n
gth
(M
PA)
Various concrete mixes
Figure 8 showing effect on 7 days
Flexural strength due to
Nano-silica
2645
9 CONCLUSIONS
In this whole experimental program, the effect of Nano-silica to concrete was studied; their effect on the
compressive, flexural and split-tensile strength of concrete cubes, cylinders and prisms.
The different observations in light of the test results are as following:
1. The compressive strength of cubes is increased by the addition of Nano-silica; the cubes show increase in compressive strength by minimum addition of Nano-silica even at 0.3% and shows max increase in compressive strength at 0.6% Nano-silica but after that there is a decrease in compressive strength as compared to 0.6% Nano-silica sample.
2. The split-tensile strength of concrete prisms is increased by the addition of Nano-silica the prisms show increase in split-tensile strength by the presence of minimum addition of Nano-silica at 0.3% and shows max increase in Split-tensile strength at 0.6% Nano-silica but after that there is a decrease in Split-tensile strength as compared to 0.6% Nano-silica sample.
3. Max increase in Compressive strength at 0.6% Nano-silica was recorded and it showed an increase of 27.59% from plain concrete at 7 day and 3.65% at 28 days from plain concrete.
4. Max increase in Split-tensile strength at 0.6% Nano-silica was recorded and it showed an increase of 17.74% from plain concrete at 7 day and 39.78% at 28 days from plain concrete. 5. The flexural strength of concrete cylinders is
increased by the addition of Nano-silica, the prisms
show increase in split-tensile strength by the presence of minimum addition of Nano-silica at 0.3% and shows max increase in Flexural strength at 0.6% Nano-silica but after that there is a decrease in Flexural strength as compared to 0.6% Nano-silica sample
6. By minimum addition of Nano-silica at 0.3%, there is an increase of 29.23% at 7 days and 34.52 % at 28 days of flexural strength
ACKNOWLEGEMENT
I want to express my ardent gratefulness to my respected supervisors Er. Ashish Kumar and Dr. Sandeep Singla for their specialized direction, significant recommendations, and inspiration all through the trial study and in setting up this thesis. It has been a pleasure to work under Er. Ashish Kumar and Dr. Sandeep Singla.
REFRENCES
[1] Hui Li, Hui-posse Xiao, Jie Yuan and Jinping Ou. (2004). Microstructure of concrete mortar with nanoparticles. Composites: Part B 35, 185-189. [2] Ji, Tao. (2005). Starter study on the water
penetrability and microstructure of cement consolidating nano-SiO2. Bond and Concrete Research 35, 1943-1947.
[3] Byung-Wan Jo, Chang-Hyun Kim, Ghi-ho Tae and Jang-Bin Park. (2007). Attributes of bond mortar with nano-SiO2 particles. Development and Building Materials 21, 1351-1355.
[4] Nilli, M., Ehsani, A. what's more, Shabani, K. (2009). Impact of nano SiO2 and miniaturized scale silics on solid execution. Bu-Ali Sina University Iran.
[5] Ali Nazari, Shadi Riahi, Shirin Riahi, Saydeh Fatemeh Shamekhi and A. Khademno. (2010). Implanted ZrO2 nanoparticles mechanical properties observing in cementitious composites. Diary of American Science 6(4), 86-89.
[6] 6 .Ali Nazari, Shadi Riahi, Shirin Riahi, Saydeh Fatemeh Shamekhi and A. Khademno (2010). Improvement of the mechanical properties of the cementitious composites by utilizing TiO2 nanoparticles. Diary of American Science 6(4), 98-101.
5.95 7.15
8 7.56
6.25
0 1 2 3 4 5 6 7 8 9
0 0.3 0.6 0.9 1.2
Fl
exur
al
str
eng
th
(M
P
A)
Various concrete mixes