International Journal of Emerging Technology and Advanced Engineering
Website: www.ijetae.com (ISSN 2250-2459, Volume 2, Issue 3, March 2012)
410
Array Antenna Performance Evaluation Based on
Element Spacing between the Patches
1*
B.T.P.Madhav,
2K. Guru Pavani,
2M. Raveendra,
2N. Revanth Teja
1Associate professor, Department of ECE, K L University, Guntur DT, AP, India
2Project Students, Department of ECE, K L University, Guntur DT, AP, India
Abstract: Antenna Arrays are popular with their high gain and radiation. The element spacing between the patches will play major role in the performance of the microstrip patch antennas. The mutual coupling between neighboring elements in an array is small and can be ignored, the input impedance of each element is the same as the individual The present paper deals with the effects of element spacing on mutual coupling and radiation patterns of the 4x4 Elliptical array antenna.
Keywords: Element Spacing, Mutual Coupling, Array Antenna.
I.
I
NTRODUCTIONMSP arrays are very versatile and are used, among other things, to synthesize a required pattern that cannot be achieved with a single element. In addition, they are used to scan the beam of an antenna system, increase the directivity and perform various other functions which would be difficult with any one single element. Any changes in one of the elements or feed lines affect the performance of the others. Corporate feed arrays prefer to single feed arrays which have more control of the feed of each element (amplitude and phase) and it is ideal for scanning phased arrays, multi beam arrays or shaped beam arrays. In patch design it is important to be able to take into account mutual coupling and internal reflections [1-2].
In MSP arrays mutual coupling between elements can introduce scan blindness which limits, for a certain maximum reflection coefficient, the angular volume over which the arrays can be scanned. For microstrip antennas, this scan similarly is strongly influenced by surface waves with in the substrate. This scan angular volume can be extended by eliminating surface waves [3-4].
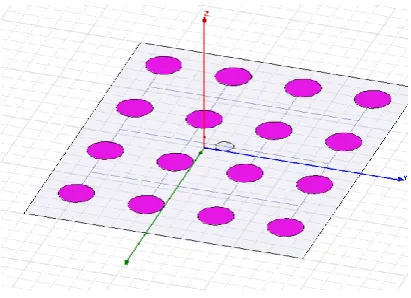
[image:1.595.315.521.300.449.2]Performance evaluation for 4X4 Elliptical array with corporate feeding has presented in this paper.
Figure 1. 4X4 Rectangular Array
International Journal of Emerging Technology and Advanced Engineering
Website: www.ijetae.com (ISSN 2250-2459, Volume 2, Issue 3, March 2012)
411
Corporate-feed arrays are general and versatile. With this method the designer has more control of the feed of each element (amplitude and phase) and it is ideal for scanning phased arrays, multi beam arrays or shaped beam arrays. In MSP arrays, as in any other array, mutual coupling between elements can introduce scan blindness which limits, for a certain maximum reflection coefficient; the angular volume over which the arrays can be scanned. For micro strip arrays, this scan limiter is strongly influenced by surface waves with in the substrate. This scan angular volume can be extended by eliminating surface waves [7-8].
The broad side matched reflection coefficient Γ(θ, φ ) is defined as
Γ(θ,φ) =(Zin(θ, φ) -Zin(0,0))/( Zin(θ, φ) +Zin*(0,0))
Where Zin (θ, φ) is the input impedance when the main beam is scanned toward an angle (θ, φ). Scan blindness which ideally occurs when the reflection coefficient is unity, and it is attributed to the coupling between the array elements due to leaky waves. Scan blindness occurs for both the E and H-planes at grazing incidence (θ=90°). The coupling between 2 or more MS antenna elements can be taken into account easily using full wave analysis. Coupling for side-by-side elements is a function of the relative alignment. When the elements are positioned collinearly along the E-plane, this arrangement is referred as the E-E-plane, when the elements are positioned collinearly along the plane this arrangement is referred to as H-plane [9-12].
For an edge to edge separation of s, the E-plane exhibits the smallest coupling isolation for very small spacing (typically s<0.10λ0). While the H-plane exhibits the smallest coupling for large spacing (typically s>0.10λ0). The spacing at which one plane coupling overtakes the other one depends on the electrical properties and geometrical dimensions of the micro strip antenna. In general, mutual coupling is primarily attributes to the fields that exist along the air-dielectric Interface. The fields can be decomposed to space waves (with 1/ρ radial variations) higher order waves (with 1/ρ² radial waves), surface waves (with 1/ρ´ radial variations),and leaky waves(with exp(-λρ)/ρ´ radial variations).
II.
M
UTUALC
ONDUCTANCEG12=1/π*√(ε/μ)*∫(sin(k₀ω/2*cosθ)/cosθ)²*sin³θ{2*
J₀((Y/λ₀)*2π*sinθ)+J₀(((Y+L)/λ₀)*2πsinθ)+J₀
(((Y-L)/λ₀) *2πsinθ)}dθ
Where Y is the center to center separation
between the slots. J₀ - Bessel function of the first
kind of order zero. 1st term is M.C of 2 slots
separated by a distance x along the E-plane, 2nd
term is M.C of 2 slots separated along the Z-plane
Y+L, 3rd term is M.C of 2 slots separated along the
Z-plane Y-L.
G12=1/π*√ (ε/μ)*∫ (sin (k₀ω/2*cosθ)/cosθ) ²*sin³θcos ((Z/λ₀)*2πcosθ).{1+J₀ ((L/λ₀)*2πsinθ)} dθ.
Where Z= Mutual conductance for the E-plane arrangement is higher for wider elements while it is lower for wider elements for the H-plane arrangement.
III.
R
ESULTSA
NDA
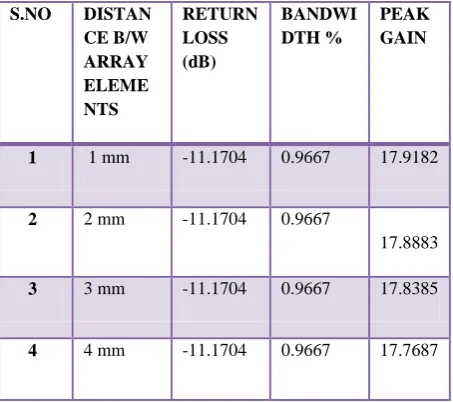
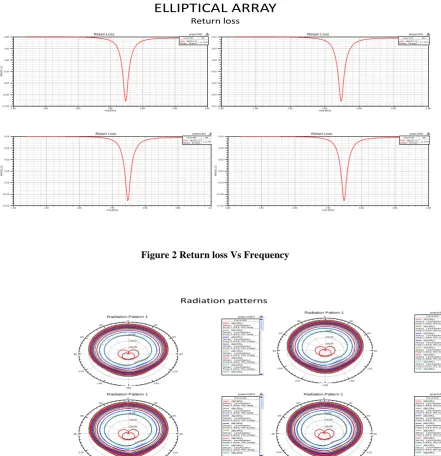
NALYSISFigure 2 shows the return loss curve for elliptical array antenna with different element spacing ranging from 1mm to 4mm. table 1 show the antenna parameters for Elliptical array with element spacing.
S.NO DISTAN CE B/W ARRAY ELEME NTS
RETURN LOSS (dB)
BANDWI DTH %
PEAK GAIN
1 1 mm -11.1704 0.9667 17.9182
2 2 mm -11.1704 0.9667
17.8883
3 3 mm -11.1704 0.9667 17.8385
[image:2.595.307.534.505.706.2]4 4 mm -11.1704 0.9667 17.7687
International Journal of Emerging Technology and Advanced Engineering
Website: www.ijetae.com (ISSN 2250-2459, Volume 2, Issue 3, March 2012)
412
When element spacing is increasing from 1mm to 4mm the return loss is showing no difference in its value. The bandwidth is also almost equal with change in element spacing for the current model. As per the peak gain is considered the gain is decreasing for each change in the element spacing
between the patches. The gain decreased at the rate of 0.34% in average. The mutual coupling losses are decreased with change in element spacing but gain also decreasing with it.
ELLIPTICAL ARRAY
Return loss
1.00 1.50 2.00 2.50 3.00 3.50 4.00
Freq [GHz] -12.00 -10.00 -8.00 -6.00 -4.00 -2.00 0.00 dB( St (1 ,1 )) project2601 Return Loss ANSOFT
Curve Inf o min dB(St(1,1)) Setup1 : Sw eep1-11.1704
1.00 1.50 2.00 2.50 3.00 3.50 4.00 Freq [GHz] -12.00 -10.00 -8.00 -6.00 -4.00 -2.00 0.00 d B( St (1 ,1 )) project2601 Return Loss ANSOFT
Curve Inf o min dB(St(1,1)) Setup1 : Sw eep1-11.1704 1.00 1.50 2.00 2.50 3.00 3.50 4.00
Freq [GHz] -12.00 -10.00 -8.00 -6.00 -4.00 -2.00 0.00 d B( St (1 ,1 )) project2601 Return Loss ANSOFT
Curve Inf o min dB(St(1,1)) Setup1 : Sw eep1-11.1704
1.00 1.50 2.00 2.50 3.00 3.50 4.00 Freq [GHz] -12.00 -10.00 -8.00 -6.00 -4.00 -2.00 0.00 d B( St (1 ,1 )) project2601 Return Loss ANSOFT
[image:3.595.82.524.220.677.2]Curve Inf o min dB(St(1,1)) Setup1 : Sw eep1-11.1704
Figure 2 Return loss Vs Frequency
Radiation patterns -28.00 -16.00 -4.00 8.00 90 60 30 0 -30 -60 -90 -120 -150 -180 150 120 project2601 Radiation Pattern 1 ANSOFT
Curve Inf o dB(rEPhi) Setup1 : LastAdaptive Freq='2.4GHz' Phi='0deg'
dB(rEPhi) Setup1 : LastAdaptive Freq='2.4GHz' Phi='5deg'
dB(rEPhi) Setup1 : LastAdaptive Freq='2.4GHz' Phi='10deg'
dB(rEPhi) Setup1 : LastAdaptive Freq='2.4GHz' Phi='15deg'
dB(rEPhi) Setup1 : LastAdaptive Freq='2.4GHz' Phi='20deg'
dB(rEPhi) Setup1 : LastAdaptive Freq='2.4GHz' Phi='25deg'
dB(rEPhi) Setup1 : LastAdaptive Freq='2.4GHz' Phi='30deg' dB(rEPhi) -28.00 -16.00 -4.00 8.00 90 60 30 0 -30 -60 -90 -120 -150 -180 150 120 project2601 Radiation Pattern 1 ANSOFT
Curve Inf o dB(rEPhi) Setup1 : LastAdaptive Freq='2.4GHz' Phi='0deg'
dB(rEPhi) Setup1 : LastAdaptive Freq='2.4GHz' Phi='5deg'
dB(rEPhi) Setup1 : LastAdaptive Freq='2.4GHz' Phi='10deg'
dB(rEPhi) Setup1 : LastAdaptive Freq='2.4GHz' Phi='15deg'
dB(rEPhi) Setup1 : LastAdaptive Freq='2.4GHz' Phi='20deg'
dB(rEPhi) Setup1 : LastAdaptive Freq='2.4GHz' Phi='25deg'
dB(rEPhi) Setup1 : LastAdaptive Freq='2.4GHz' Phi='30deg'
International Journal of Emerging Technology and Advanced Engineering
Website: www.ijetae.com (ISSN 2250-2459, Volume 2, Issue 3, March 2012)
[image:4.595.71.527.163.728.2]413
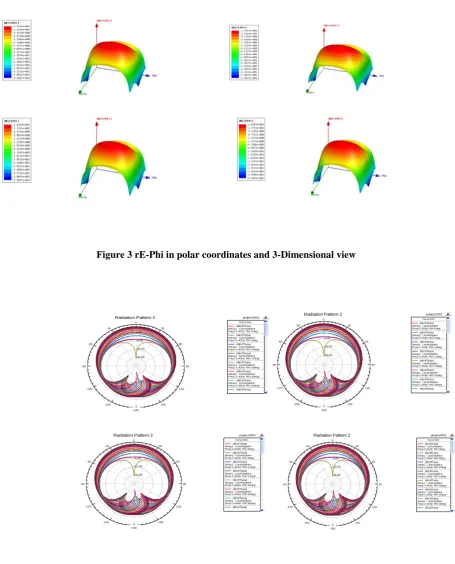
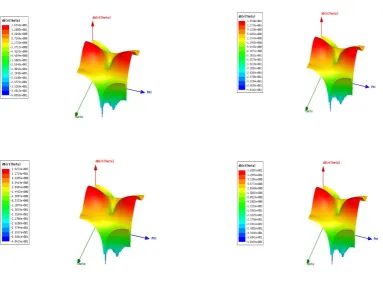
Figure 3 rE-Phi in polar coordinates and 3-Dimensional view
-36.00 -22.00 -8.00 6.00 90 60 30 0 -30 -60 -90 -120 -150 -180 150 120 project2601
Radiation Pattern 2 ANSOFT
Curve Info dB(rETheta) Setup1 : LastAdaptive Freq='2.4GHz' Phi='0deg'
dB(rETheta) Setup1 : LastAdaptive Freq='2.4GHz' Phi='5deg'
dB(rETheta) Setup1 : LastAdaptive Freq='2.4GHz' Phi='10deg'
dB(rETheta) Setup1 : LastAdaptive Freq='2.4GHz' Phi='15deg'
dB(rETheta) Setup1 : LastAdaptive Freq='2.4GHz' Phi='20deg'
dB(rETheta) Setup1 : LastAdaptive Freq='2.4GHz' Phi='25deg'
dB(rETheta) Setup1 : LastAdaptive Freq='2.4GHz' Phi='30deg' dB(rETheta) -36.00 -22.00 -8.00 6.00 90 60 30 0 -30 -60 -90 -120 -150 -180 150 120 project2601
Radiation Pattern 2 ANSOFT
Curve Inf o dB(rETheta) Setup1 : LastAdaptive Freq='2.4GHz' Phi='0deg'
dB(rETheta) Setup1 : LastAdaptive Freq='2.4GHz' Phi='5deg'
dB(rETheta) Setup1 : LastAdaptive Freq='2.4GHz' Phi='10deg'
dB(rETheta) Setup1 : LastAdaptive Freq='2.4GHz' Phi='15deg'
dB(rETheta) Setup1 : LastAdaptive Freq='2.4GHz' Phi='20deg'
dB(rETheta) Setup1 : LastAdaptive Freq='2.4GHz' Phi='25deg'
dB(rETheta) Setup1 : LastAdaptive Freq='2.4GHz' Phi='30deg' dB(rETheta) -36.00 -22.00 -8.00 6.00 90 60 30 0 -30 -60 -90 -120 -150 -180 150 120 project2601
Radiation Pattern 2 ANSOFT
Curve Info dB(rETheta) Setup1 : LastAdaptive Freq='2.4GHz' Phi='0deg'
dB(rETheta) Setup1 : LastAdaptive Freq='2.4GHz' Phi='5deg'
dB(rETheta) Setup1 : LastAdaptive Freq='2.4GHz' Phi='10deg'
dB(rETheta) Setup1 : LastAdaptive Freq='2.4GHz' Phi='15deg'
dB(rETheta) Setup1 : LastAdaptive Freq='2.4GHz' Phi='20deg'
dB(rETheta) Setup1 : LastAdaptive Freq='2.4GHz' Phi='25deg'
dB(rETheta) Setup1 : LastAdaptive Freq='2.4GHz' Phi='30deg' dB(rETheta) -36.00 -22.00 -8.00 6.00 90 60 30 0 -30 -60 -90 -120 -150 -180 150 120 project2601
Radiation Pattern 2 ANSOFT
Curve Inf o dB(rETheta) Setup1 : LastAdaptive Freq='2.4GHz' Phi='0deg'
dB(rETheta) Setup1 : LastAdaptive Freq='2.4GHz' Phi='5deg'
dB(rETheta) Setup1 : LastAdaptive Freq='2.4GHz' Phi='10deg'
dB(rETheta) Setup1 : LastAdaptive Freq='2.4GHz' Phi='15deg'
dB(rETheta) Setup1 : LastAdaptive Freq='2.4GHz' Phi='20deg'
dB(rETheta) Setup1 : LastAdaptive Freq='2.4GHz' Phi='25deg'
dB(rETheta) Setup1 : LastAdaptive Freq='2.4GHz' Phi='30deg'
International Journal of Emerging Technology and Advanced Engineering
Website: www.ijetae.com (ISSN 2250-2459, Volume 2, Issue 3, March 2012)
[image:5.595.76.460.182.488.2]414
Figure 4 rE-Theta in polar coordinates and 3-Dimensional view
Radiation pattern is a mathematical function or graphical representation of the radiation properties of the antenna as a function of space coordinates. Radiation properties include power flux density, radiation intensity, field strength, directivity phase or polarization. In practice, the three dimensional pattern is measured and recorded in a series of two dimensional patterns.
International Journal of Emerging Technology and Advanced Engineering
Website: www.ijetae.com (ISSN 2250-2459, Volume 2, Issue 3, March 2012)
415
ANTENNA PARAMETERS
VALUE for Distance Between Array Elements Is 1 mm
VALUE for Distance Between Array Elements Is 2 mm
VALUE for Distance Between Array Elements Is 3 mm
VALUE for Distance Between Array Elements Is 4 mm
MAX U 0.057219 0.056837 0.056283 0.055411
PEAK
DIRECTIVITY
67.461 67.011 66.305 65.33
PEAK GAIN 61.918 61.505 60.857 59.962
PEAK REALIZED GAIN
4.5389 4.5084 4.4609 4.3953
RADIATED POWER
0.010659 0.010659 0.010659 0.010659
ACCEPTED POWER
0.011613 0.011613 0.011613 0.011613
INCIDENT POWER
0.15843 0.15843 0.15843 0.15843
RADIATION EFFICIENCY
0.91783 0.91783 0.91783 0.91783
FRONT TO BACK RATIO
[image:6.595.84.517.129.597.2]27.462 28.972 28.911 28.914
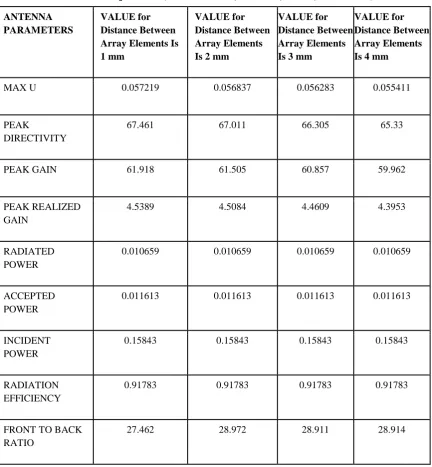
Table 2 Antenna Additional Parameters
IV.
C
ONCLUSION:
The performance of array patch antenna is investigated by changing the element spacing between the patches. By increasing the distance between the patch elements, the mutual coupling losses are decreased and gain also decreased. The bandwidth and the radiation efficiency are not changing with change in element spacing between elliptical patches.
International Journal of Emerging Technology and Advanced Engineering
Website: www.ijetae.com (ISSN 2250-2459, Volume 2, Issue 3, March 2012)
416
Acknowledgments:
Authors likes to express their thanks to the department of ECE and management of K L University for their continuous support during this work. Madhav likes to express his thanks to Prof Pisipati and Habibulla Khan for their support and cooperation in this work. He also likes to express his gratitude towards chancellor, KLU for providing excellent R&D environment at KLU.
References:
[1] H. Y. D. Yang, “Miniaturized printed wire antenna for wireless communications,” IEEE Antennas Wireless Propag. Lett., vol. 4, pp. 358–361, 2005.
[2] Volakis, John L., Antenna Engineering Handbook, 4th ed. New York: McGraw-Hill, 2007.
[3] B.T.P.Madhav, VGKM Pisipati, Prof. Habibulla Khan, VGNS Prasad, Prof. P.V.Datta Prasad, P.Sreekanth, “Microstrip Circular Patch Array Antenna For Wlan Applications On Liquid Crystal Polymer Substrate”, Journal of Emerging Trends in Computing and Information Sciences. , Vol. 2, No. 1, February 2011.
[4] B.T.P.Madhav, K. Sarat Kumar, Pranob K Charless, P.Sreyash, V.Satyasainadh, P.L.Madhuri, A.Snehitha, Saroj Gautam,” Rectangular Microstrip 6X6 Patch Array Antenna Performance Evaluation based on Permittivity of the Substrate Materials”, GJCAT, Vol 1 (1), 2011, 83-91, ISSN: 2249-1945
[5] B.T.P.Madhav, VGKM Pisipati, P.Rakesh Kumar, N.V.K.Ramesh, K.V.L.Bhavani, Sri Jayalakshmi, 8x8 Array Elliptical Patch Antenna on Teflon Substrate Material for WLAN Applications, International Journal of Advances in Science and Technology, Vol. 2, No.5, 2011.
[6] Nashaat, D Elsadek, H.A.; Abdullah, E.A.; Iskander, M.F.; Elhenawy, H.M.; Hawaii Center for Adv. Commun., Univ. of Hawaii at Manoa, Honolulu, HI, USA,“Ultrawide bandwidth 2x2 microstrip patch array antenna using electromagnetic band-gap structure(EBG)”, Antennas and Propagation, IEEE Transactions on May 2011 ,Volume : 59 ,Issue:5 .
[7] Rahim, M. K. A. Asrokin, A. Jamaluddin, M. H. Ahmad, M. R. Masri, T. Aziz, M. Z. A. Abdul , Microstrip Patch Antenna Array at 5.8 GHz for Point to Point Communication, RF and Microwave Conference, 12-14 Sept. 2006 , 216 - 219.
[8] Khan, O.U.Electron. Eng. Dept., NED Univ. of Eng. & Technol. “Design of x-band 4x4 butler matrix for microstrip patch antenna array”, TENCON 2006. 2006 IEEE Region 10 Conference ,Issue Date: 14-17 Nov. 2006 On page(s): 1 – 4.
[9] K.L.Wong, ―Compact and Broadband Microstrip Antennas, John Wiley & sons, Text Book
[10].R.B.Waterhouse, et.al, Broadband printed millimeterwave Antenna, IEEE Trans. AP – 51, No.9, Sep 2003,pp 2492- 2495.
[11] K. F. Lee, Ed., Advances in Microstrip and Printed Antennas, John Wiley, 1997.
[12] Daniel H. Schaubert, 1995] Daniel H. Schaubert, “A Review of Some Microstrip Antenna Characteristics ”Microstrip Antennas - The Analysis and Design of Microstrip Antennas and Arrays, edited by David M. Pozar, Daniel H. Schaubert, John Wiley & Sons, Inc., 1995, ISBN 0-7803-1078-0
Author Biography:
B.T.P.Madhav was born in India, A.P, in 1981. He received the B.Sc, M.Sc, MBA, M.Tech degrees from Nagarjuna University, A.P, India in 2001, 2003, 2007, and 2009 respectively. From 2003-2007 he worked as lecturer and from 2007 to 2011 he worked as Assistant Professor and from 2011 to till date he is working as Associate Professor in Electronics and Communication Engineering. He has published more than 90 papers in International and National journals. He is reviewer for three international journals and served as reviewer for three international conferences. His research interests include antennas, liquid crystals applications and wireless communications. He is a life member of ISTE.
K .Guru Pavani was born in India, A.P. in 1991. She is pursuing her B.Tech final year in KL University in the stream of Electronics and Communications. She published a paper on patch antennas. Her areas of interest are antennas and radars.
International Journal of Emerging Technology and Advanced Engineering
Website: www.ijetae.com (ISSN 2250-2459, Volume 2, Issue 3, March 2012)