Clustering Student's Satisfaction in Complex Adaptive
Blended Learning with the Six Value System Using the
K-Means Algorithm
Dadang Sudrajat, Raditya Danar Dana*, Nining Rahaningsih, Arif Rinaldi Dikananda, Dian Ade Kurnia
Teknik Informatika STMIK IKMI Cirebon, Indonesia
Copyright©2019 by authors, all rights reserved. Authors agree that this article remains permanently open access under the terms of the Creative Commons Attribution License 4.0 International License
Abstract
Complex adaptive blended learning with the six value system is expected to improve the quality of learning. It is also expected to improve high order thinking skills. But the level of student’s satisfaction in Complex adaptive blended learning with the six value system varies in results. This study aims to determine the grouping of student’s satisfaction in complex adaptive blended learning with the six value system. The object of the study was conducted in 3 (three) vocational high schools (SMK) in Cirebon City, West Java Province, Indonesia for digital simulation subjects with a purposive sample of 150 students. Data about student’s satisfaction is grouped using the K-Means algorithm with the optimization of generation method. Several stages are carried out in grouping student’s satisfaction, starting with randomly determining initial centroid values. The K-Means algorithm process ends if there is no change in centroid value between one iteration and another iteration. Furthermore, performance measurements are performed using the Cluster Distance Performance method. The results are obtained by the performance Vector with parameters K = 4. The average distance in the centroid is -0.107, the average distance in the center of cluster 0 is -0.109, the average distance in the center of cluster 1 is -0.109, the average distance in the center of cluster 2 of -0,100, and the average distance in the center of cluster 3 is -0,106, with Davies Bouldin index of -1,049.Keywords
Clustering, K-Means, Performance, Six Value Systems, Complex Adaptive Blended Learning, High Order Thinking Skills1. Introduction
Figure 1. Complex adaptive blended learning System [17]
The integration of learning mediated by campus-based learning technology has made learning more complex than before. The complexity lies not only in the emergence of new elements in the teaching and learning process, but also in the changes brought about by the interactions between these new elements [7].
To find out the clusters about student satisfaction in Complex adaptive blended learning with the six-value system in 3 (three) vocational high schools (SMK) in the City of Cirebon, West Java Province of Indonesia, a clusterization is needed. Research related to clustering with the k-means algorithm method has been widely carried out. The study, entitled Modified Centroid Selection Method of K-Means Clustering, addresses the problem of grouping objects that have similarities [14]. Other researchers have conducted a study entitled Clustering Algorithms Applied in Educational Data Mining, discussing the application of clustering in data mining in education [1]. Other researchers have also conducted research on clustering titled Application of K-Means Algorithm for Efficient Customer Segmentation: A Strategy for Targeted Customer Services addresses the issue of grouping consumers more efficiently to provide customer services [8]. Research on Analysis of Color Images using Cluster-based Segmentation Techniques discusses the problem of image segmentation that divides images into several constituent components such as color, structure, shape, and texture [3]. Other researchers conducted research on an efficient K-Means integrated algorithm with Jaccard Distance Measure for Document Clustering, discussing the problem of applying the K-Means algorithm in grouping documents [12]. Furthermore, Accelerating Unique Strategy for Centroid Priming in K-Means Clustering research discusses the K-Means algorithm to show convergence in grouping data by partitioning data along the data axis with the highest variance [16]. The results of the study show that K-Means is able to group data objects with various methods based on centroid or density [4] [13]. In this study the authors
are interested in conducting research related to clustering student satisfaction in complex adaptive blended learning with the six value system by proposing a proposed K-Means algorithm method by optimizing generation, calculating the performance of the vector and Davies Bouldin index and with Euclidean distance parameters, where the Euclidean distance is used to calculate the distance of a data object [6].
2. Methods
2.1. Data
Purposive sampling obtained 3 (three) samples of vocational high school (SMK) in Cirebon City, Java Province, West Indonesia, and selected according to the purpose of the study. The data used for the grouping process about student satisfaction was obtained through teachers for digital simulation subjects from 3 (three) Vocational Schools in Cirebon City, West Java Province, Indonesia. The data source used for clustering or grouping about student satisfaction is obtained through a questionnaire that has been distributed to students in 1 (one) semester of the 2017-2018 academic year. The data set consists of 150 students taken from each school as many as 50 data sets.
2.2. Clustering
Clustering is a data mining technique used to analyze data to solve problems in grouping data or more precisely partitioning datasets into subsets. In the clustering technique, the target is for the case of distribution (objects, people, events and others) into a group, so that the degree of connectedness between members of the same cluster is strong and weak between different cluster members [5] [9] [17].
2.3. Complex Adaptive Blended Learning and Six Value Systems
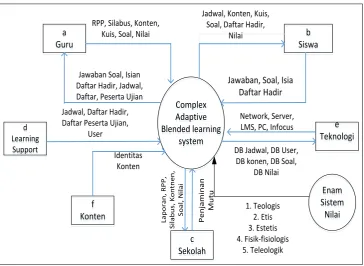
Clustering research on student satisfaction in Complex adaptive blended learning with the six-value system can be described in the context diagram as follows:
Complex Adaptive Blended learning system Complex Adaptive Blended learning system a Guru a
Guru SiswaSiswabb
c Sekolah c Sekolah d Learning Support d Learning Support e Teknologi e Teknologi f Konten f Konten
RPP, Silabus, Konten, Kuis, Soal, Nilai
Jadwal, Konten, Kuis, Soal, Daftar Hadir,
Nilai
Jawaban, Soal, Isia Daftar Hadir
Network, Server, LMS, PC, Infocus
DB Jadwal, DB User, DB konen, DB Soal,
DB Nilai Penjaminan Mutu Laporan , RPP , Silabus , Kontnen , Soal , Nilai
Jawaban Soal, Isian Daftar Hadir, Jadwal, Daftar, Peserta Ujian Jadwal, Daftar Hadir, Daftar Peserta Ujian,
[image:3.595.116.481.77.343.2]User Identitas Konten 1. Teologis 2. Etis 3. Estetis 4. Fisik-fisiologis 5. Teleologik Enam Sistem Nilai Enam Sistem Nilai
Figure 2. Complex adaptive blended learning context diagram with the six-value system.
2.4. K-Mean
K-Means is a method for grouping data that has the same characteristics. While the data that has different characteristics are grouped in other clusters [13].
The steps of the algorithm are:
1. Select number of cluster K as initial centroid 2. The center of the cluster is given an initial value
with a random number.
3. The proximity of two data or objects is determined based on the distance of the two data or objects. Likewise, the proximity of a data or object to a particular cluster is determined by the distance between the data or object and the center of the cluster. In this stage, it is necessary to calculate the distance of each data or object to each cluster center. The distance between one data or object with a certain cluster will determine which data or object belongs to which cluster.
To calculate the distance of data to each cluster center point, you can use the Euclidean distance theory which is formulated as follows:
𝐷(𝑖,𝑗)=�∑𝑝 (𝑥𝑘𝑖− 𝑥𝑘𝑗)2
𝑗=1 ……..….. (1)
Description:
D(i,j) = data distance to i to cluster center j
X(k,i) = data to i in the attribute data to k
X(k,j) = the center point to j on the attribute k
4. Redefine the cluster center with the current cluster membership. Cluster center is the average value of all data or objects in a particular cluster.
5. Repeat again for each object using the new cluster center. If there are no more changes in the cluster center formed, the clustering process is complete.
3. Results and Discussion
The problem faced in this research is clustering or grouping students who are doing learning activities with the level of satisfaction of students consisting of very satisfied students, satisfied students, students are quite satisfied and students are less satisfied so we need a data clustering technique. At the stage of selecting the model that suits what you want, the K-Mean parameters used are as in Table 1.
Table 1. Parameter of K-Mean
Parameter Value
Measure type Numerical Measures
Nominal measure Euclidian Distance
Max Optimization step 100
K 4
Max runs 10
[image:3.595.302.543.571.666.2]Table 2. Centroid table Student satisfaction in Blended learning with six value systems
Attribute cluster_0 cluster_1 cluster_2 cluster_3
retata1 2.309 2.327 2.973 2.176
retata2 2.411 2.461 2.5 1.784
retata3 1.445 1.436 1.464 1.504
retata4 2.453 2.527 2.532 2.384
retata5 1.472 1.455 1.473 1.472
retata6 2.068 2.776 2.441 2.464
Here are the results of the final model cluster analysis of clustering calculations about student satisfaction with six value systems using the K-Means optimize by generation algorithm. Cluster 0 had 53 students, Cluster 1 had 33 students, Cluster 2 had 44 students, and Cluster 3 had 25 students. The total number of student data is as many as 155.
After grouping the data into several clusters, a graph is obtained as shown in Figure 4 below:
Figure 3. Clusters of student satisfaction in complex adaptive blended learning with six value systems
[image:4.595.105.490.262.456.2] [image:4.595.101.494.497.719.2]Figure 5. Student number of member chart
[image:5.595.88.506.391.672.2]Based on Figure 5, it can be stated that student satisfaction in complex adaptive blended learning with six new value systems reaching 28.39% in cluster 2 expressed very satisfied. This means that student satisfaction with participating in blended learning still needs to be improved. Furthermore, it is followed by cluster 1 as many as 21.29% expressed satisfaction. Then cluster 0 amounting to 34.19% stated that they were quite satisfied while cluster 3 amounting to 16.13% said they were not satisfied. This means that the values of the six value systems as a system manifest in very satisfying behavior as much as 28.39% in cluster 2. There is a different pressure on cluster 1 in the translation of values in behavior. There is a strong in theological values, but that does not mean ignoring other values as a system, because theological values are also in a unity with other values as a system that is interrelated and related to one another.
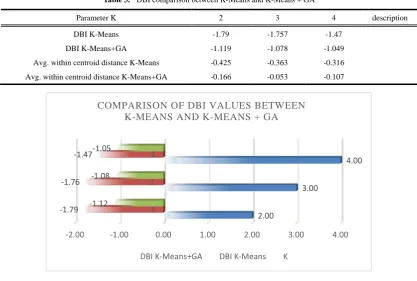
Table 3. DBI comparison between K-Means and K-Means + GA
Parameter K 2 3 4 description
DBI K-Means -1.79 -1.757 -1.47
DBI K-Means+GA -1.119 -1.078 -1.049
Avg. within centroid distance K-Means -0.425 -0.363 -0.316
Avg. within centroid distance K-Means+GA -0.166 -0.053 -0.107
Figure6. Comparison of DBI values between K-Means + Ga and K-Means
Calculation results with the highest centroid value are based on Performance Vector with parameter K = 4, obtained by the average distance in the centroid is -0.107, the average distance in the center of cluster 0 of -0,109, the average distance in the center of cluster 1 of -0,109, the average distance in the center of cluster 2 of -0,100, and the average distance in the center of cluster 3 of -0,106, with Davies Bouldin index of -1,049.
0 10 20 30 40 50 60
number of members
Cluster 0 Cluster 1 Cluster 2 Cluster 3
-2.00 -1.00 0.00 1.00 2.00 3.00 4.00 1
2 3
2.00
3.00
4.00
-1.79 -1.76
-1.47
-1.12 -1.08
-1.05
COMPARISON OF DBI VALUES BETWEEN K-MEANS AND K-MEANS + GA
4. Conclusions
Grouping about student satisfaction in Complex Adaptive Blended Learning with the six value system, "Very Satisfied Students", "Satisfied Students", "Moderately Satisfied Students" or "Dissatisfied Students" are obtained after going through the calculation process by applying the K-Means Clustering Optimize by Generation algorithm. The results of calculations with the highest centroid value are the very satisfied student groups in cluster 2 and the calculation results with the lowest centroid scores are the less satisfied student groups in cluster 3. Clustering student satisfaction in Complex Adaptive Blended Learning with the six value system Using K-Means Algorithm in 3 (three) vocational high schools (SMK) in the city of Cirebon, West Java Province, Indonesia, shows that six value systems can be used as an effort to live values in the implementation of complex adaptive blended learning systems with six value systems, which include theological values, ethical values, aesthetic values, logical-rational values, physical-physiological values and teleological values. So that his actions reflect behavior in the almighty God, always respectful, do good / humble, like cleanliness, beauty, able to use logic that is correct, functioning and beneficial. There are implications for improving the quality of learning through the six value system method.
Acknowledgements
Thank STMIK IKMI Cirebon, Cirebon STT Multimedia Education Foundation, and the Cirebon City Education Office, West Java Province, Indonesia for providing support in this research activity.
REFERENCE
A. Dutt, S. Aghabozrgi, M. Akmal, B. Ismail, And H. [1]
Mahroeian, “Clustering Algorithms Applied In Educational Data Mining,” Int. J. Inf. Electron. Eng., Vol. 5, No. 2, Pp. 112–116, 2015.
A. G. P. and C. D. Dziuban, “Blended learning ;Reasecrh [2]
and perspective,” Sloan Consort., vol. LVII, no. 1, pp. A1– A88, 2007.
A. Mohanty, S. Rajkumar, Z. Muzaffar, And P. Bardhan, [3]
“Analysis Of Color Images Using Cluster Based Segmentation Techniques,” Int. J. Comput. Appl., Vol. 79, No. 2, Pp. 42–47, 2013.
A. S. M. S. Hossain, “Customer Segmentation Using [4]
Centroid Based And Density Based Clustering Algorithms,” Int. Conf. Electr. Inf. Commun. Technol., No. December, Pp. 7–9, 2017.
A. Sanusi, Sistem Nilai Alternatif Wajah-wajah Pendidikan. [5]
2015.
C. C. Aggarwal And C. K. Reddy, Data Clustering [6]
Algorithms And Application. Minneapolis, Minnesota Usa: Crc Press, 2014.
C. Müller, “Experiences and evaluation of a blended [7]
learning concept for learning Chinese in higher education,” Procedia - Soc. Behav. Sci., vol. 34, no. 0, pp. 158–163, 2012.
C. P. Ezenkwu, S. Ozuomba, And C. Kalu, “Application Of [8]
K-Means Algorithm For Efficient Customer Segmentation : A Strategy For Targeted Customer Services,” Int. J. Adv. Res. Artif. Intell., Vol. 4, No. 10, Pp. 40–44, 2015.\ D. Stirling, “Learning and complex adaptive systems,” [9]
Learn. Dev. Inst., no. September, pp. 1–48, 2014.
Leslie Owen Wilson, “Anderson and Krathwohl - [10]
Understanding the New Version of Bloom ’ s Taxonomy The Cognitive Domain : Anderson and Krathwohl - Bloom ’ s Taxonomy Revised,” Internet, no. 1972, 2016.
M. Misut and M. Pokorny, “Does ICT Improve the [11]
Efficiency of Learning?,” Procedia - Soc. Behav. Sci., vol. 177, no. July 2014, pp. 306–311, 2015.
M.-U.-S. Shameem And R. Ferdous, “An Efficient K-Means [12]
Algorithm Integrated With Jaccard Distance Measure For Document Clustering,” Ieee, 2009.
P. Govindasamy And S. K. Lakshmanaprabu, “Document [13]
Clustering Based On Text Mining K-Means Algorithm Using Euclidean Distance Similarity,” J. Adv. Res. Dyn. Control Syst., Vol. 10, No. April, 2018.
R. Mawati, I. M. Sumertajaya, And F. M. Afendi, “Modified [14]
Centroid Selection Method Of K-Means Clustering,” Iosr J. Math., Vol. 10, No. 2, Pp. 49–53, 2014.
S. Pavla, V. Hana, and V. Jan, “Blended Learning: [15]
Promising Strategic Alternative in Higher Education,” Procedia - Soc. Behav. Sci., vol. 171, pp. 1245–1254, 2015. S. Saranya, D. P, S. S, J. S, And K. A, “Accelerating Unique [16]
Strategy For Centroid Priming In K-Means Clustering,” Int. J. Innov. Res. Sci. Technol., Vol. 3, No. 07, Pp. 40–47, 2016.
Y. Wang, X. Han, and J. Yang, “Revisiting the Blended [17]
Learning Literature: Using a Complex Adaptive Systems Framework,” Educ. Technol. Soc., vol. 18, no. 2, pp. 380– 393, 2015.
A. Buchori, P. Setyosari, I. Wayan Dasna, and S. Ulfa, [18]
“Developing character building learning model using mobile augmented reality on elementary school student in Central Java,” Glob. J. Pure Appl. Math., vol. 12, no. 4, pp. 3433–3444, 2016.
Sunandar, A. Buchori, N. D. Rahmawati, and W. Kusdaryani, [19]
![Figure 1. Complex adaptive blended learning System [17]](https://thumb-us.123doks.com/thumbv2/123dok_us/8768489.897713/2.595.63.287.79.248/figure-complex-adaptive-blended-learning.webp)