mTORC1 and mTORC2 selectively regulate
CD8
+
T cell differentiation
Kristen N. Pollizzi, … , Greg M. Delgoffe, Jonathan D. Powell
J Clin Invest.
2015;
125(5)
:2090-2108.
https://doi.org/10.1172/JCI77746
.
Activation of mTOR-dependent pathways regulates the specification and differentiation of
CD4
+T effector cell subsets. Herein, we show that mTOR complex 1 (mTORC1) and
mTORC2 have distinct roles in the generation of CD8
+T cell effector and memory
populations. Evaluation of mice with a T cell–specific deletion of the gene encoding the
negative regulator of mTORC1, tuberous sclerosis complex 2 (TSC2), resulted in the
generation of highly glycolytic and potent effector CD8
+T cells; however, due to constitutive
mTORC1 activation, these cells retained a terminally differentiated effector phenotype and
were incapable of transitioning into a memory state. In contrast, CD8
+T cells deficient in
mTORC1 activity due to loss of RAS homolog enriched in brain (RHEB) failed to
differentiate into effector cells but retained memory characteristics, such as surface marker
expression, a lower metabolic rate, and increased longevity. However, these
RHEB-deficient memory-like T cells failed to generate recall responses as the result of metabolic
defects. While mTORC1 influenced CD8
+T cell effector responses, mTORC2 activity
regulated CD8
+T cell memory. mTORC2 inhibition resulted in metabolic reprogramming,
which enhanced the generation of CD8
+memory cells. Overall, these results define specific
roles for mTORC1 and mTORC2 that link metabolism and CD8
+T cell effector and memory
generation and suggest that these functions have the potential to be targeted for enhancing
vaccine efficacy […]
Research Article
Immunology
Find the latest version:
The Journal of Clinical Investigation
R e s e a R c h a R t i c l e
Introduction
CD8+ T cells are an essential component of the adaptive immune
response, generating both effector cells necessary for clearance of acute infection and long-lived memory cells primed to provide a rapid secondary response (1). Upon initial encounter with antigen, naive CD8+ T cells rapidly proliferate to generate effector cells (2).
Such cells have enormous metabolic demands and rely in part on aerobic glycolysis as a means of promoting effector activation (3, 4). In contrast, CD8+ memory T cells, which are programmed for
long-term survival, have fewer acute metabolic needs and use oxi-dative phosphorylation rather than glycolysis (5, 6). While recent work has indicated the importance of metabolic programming in T cell fate, the pathways that regulate T cell metabolism are still being elucidated (7).
mTOR is an evolutionarily conserved serine/threonine pro-tein kinase important for the integration of environmental cues to regulate cellular metabolism, protein synthesis, differentia-tion, survival, and growth (8). mTOR exists as two distinct pro-tein complexes, mTOR complex 1 (mTORC1) and mTORC2, each with unique functions and downstream targets. The activation of mTORC1 has been well characterized. Negative regulators of mTORC1, tuberous sclerosis complex 1 (TSC1), TSC2, and newly described TBC1D7 (9), form a protein complex functioning as a GAP for RAS homolog enriched in brain (RHEB) (10, 11). Upon inhibitory phosphorylation of TSC1 or TSC2, the TSC1/2 complex
disassociates, allowing for accumulation of GTP. RHEB-GTP interacts with mTORC1, leading to mTOR kinase activity, measured as an increase in the phosphorylation of the mTORC1 substrates S6K-1 and 4E-BP1 (12). Several studies have examined the role of TSC1 in T cells and have demonstrated its critical role in promoting survival (13–16). The role of TSC2 in T cells has yet to be determined.
In CD4+ T cells, mTORC1 and mTORC2 have emerged as
crit-ical integrators of signals from the immune microenvironment. mTORC1 selectively regulates Th1 and Th17 differentiation, while mTORC2 promotes the generation of Th2 cells (17, 18). Further-more, complete inhibition of mTOR activity in CD4+ T cells results
in the generation of regulatory T cells, even under normally acti-vating conditions (19). Therefore, we were interested in determin-ing the specific roles of mTORC1 and mTORC2 signaldetermin-ing in regu-lating CD8+ T cell effector and memory generation. In this report,
we demonstrate a critical role for mTORC1 and mTORC2 in regu-lating CD8+ T cell effector and memory differentiation.
Results
TSC2 integrates signals to regulate CD8+ effector function. TSC2
negatively regulates mTORC1 activity by acting as a GAP for the mTORC1-activitating GTPase RHEB (20). Upon phosphorylation by AKT or ERK, TSC2 is inactivated, thus leading to increased mTORC1 activity (8). In order to dissect how mTORC1 integrates signals in CD8+ T cells, we created mice in which TSC2 is
selec-tively deleted in T cells (Cd4-Cre Tsc2fl/fl mice, herein referred to
as T-Tsc2–/– mice) (Supplemental Figure 1A; supplemental material
available online with this article; doi:10.1172/JCI77746DS1).
Activation of mTOR-dependent pathways regulates the specification and differentiation of CD4+ T effector cell subsets.
Herein, we show that mTOR complex 1 (mTORC1) and mTORC2 have distinct roles in the generation of CD8+ T cell effector
and memory populations. Evaluation of mice with a T cell–specific deletion of the gene encoding the negative regulator of mTORC1, tuberous sclerosis complex 2 (TSC2), resulted in the generation of highly glycolytic and potent effector CD8+
T cells; however, due to constitutive mTORC1 activation, these cells retained a terminally differentiated effector phenotype and were incapable of transitioning into a memory state. In contrast, CD8+ T cells deficient in mTORC1 activity due to loss of
RAS homolog enriched in brain (RHEB) failed to differentiate into effector cells but retained memory characteristics, such as surface marker expression, a lower metabolic rate, and increased longevity. However, these RHEB-deficient memory-like T cells failed to generate recall responses as the result of metabolic defects. While mTORC1 influenced CD8+ T cell effector
responses, mTORC2 activity regulated CD8+ T cell memory. mTORC2 inhibition resulted in metabolic reprogramming, which
enhanced the generation of CD8+ memory cells. Overall, these results define specific roles for mTORC1 and mTORC2 that
link metabolism and CD8+ T cell effector and memory generation and suggest that these functions have the potential to be
targeted for enhancing vaccine efficacy and antitumor immunity.
mTORC1 and mTORC2 selectively regulate CD8
+
T cell
differentiation
Kristen N. Pollizzi,1 Chirag H. Patel,1 Im-Hong Sun,1 Min-Hee Oh,1 Adam T. Waickman,1,2 Jiayu Wen,1 Greg M. Delgoffe,1,3
and Jonathan D. Powell1
1Sidney-Kimmel Comprehensive Cancer Research Center, Department of Oncology, Johns Hopkins University School of Medicine, Baltimore, Maryland, USA. 2Experimental Immunology Branch, National
Cancer Institute, NIH, Bethesda, Maryland, USA. 3Department of Immunology, University of Pittsburgh, Pittsburgh, Pennsylvania, USA.
Conflict of interest: The authors have declared that no conflict of interest exists. Submitted: July 1, 2014; Accepted: March 12, 2015.
The Journal of Clinical Investigation
R e s e a R c h a R t i c l eAs constitutive activation of mTORC1, through Tsc2 deletion, resulted in enhanced effector generation, we also wanted to deter-mine whether mTORC1 activity was required for the generation of CD8+ effector T cells. To this end, we assessed effector function of
T cells deficient in RHEB (Cd4-Cre Rhebfl/fl cells, herein referred to
as T-Rheb–/– CD8+ T cells) (17, 23). RHEB is a small GTPase that is
negatively regulated by the GAP activity of TSC2 and plays a crit-ical role in the immediate activation of mTORC1 (10). T-Rheb–/–
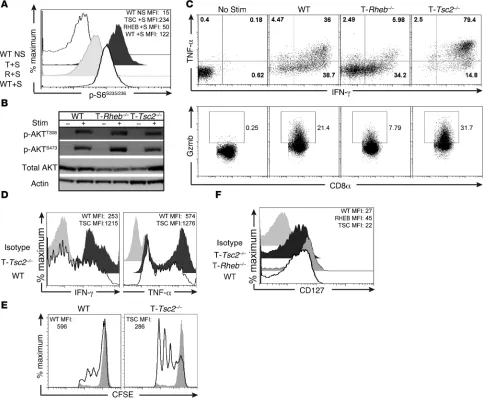
CD8+ T cells have reduced mTORC1 activity but intact mTORC2
signaling (Figure 2, A and B). Upon stimulation, T-Rheb–/– CD8+ T
cells have markedly diminished expression of IFN-γ, TNF-α, and granzyme B when compared with that of WT T cells (Figure 2C). The inability of T-Rheb–/– CD8+ T cells to produce cytokines was
not due to a proliferative defect, as T-Rheb–/– CD8+ T cells are
capa-ble of dividing, albeit at a delayed rate compared with that of WT cells, upon stimulation (Supplemental Figure 2A). T-Rheb–/– CD8+
T cells also demonstrated expression of activation markers CD69 and CD44 that was equivalent to that in WT and T-Tsc2–/– cells,
suggesting that they do not have a defect in TCR stimulation (Sup-plemental Figure 2C). Interestingly, while T-Rheb–/– CD8+ T cells
express decreased levels of effector molecules, they exhibited increased expression of CD127 (IL-7Rα receptor), which is critical for CD8+ memory survival (Figure 2F) (24).
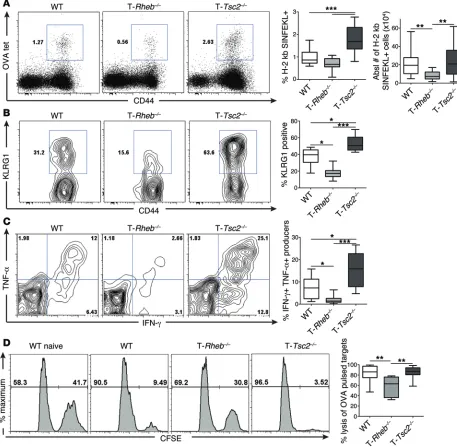
Next, we moved to an in vivo model. WT, T-Rheb–/–, and
T-Tsc2–/– mice were infected with a recombinant vaccinia virus
that expresses ovalbumin (vaccinia-OVA), and 6 days later, the generation and function of OVA-specific CD8+ effector T cells
was determined using OVA tetramer (H-2 kb/ SIINFEKL) stain-ing. T-Tsc2–/– mice exhibited a robust increase in the number of
activated antigen-specific CD8+ T cells compared with that of
WT mice (Figure 3A). OVA-specific T-Tsc2–/– CD8+ T cells
exhib-ited increased expression of KLRG1, a marker of terminally differentiated effector CD8+ T cells (Figure 3B and ref. 25), and
robust IFN-γ and TNF-α production (Figure 3C). Consistent with an enhanced effector phenotype, OVA-specific CD8+ T cells
from T-Tsc2–/– mice had markedly increased expression of T-bet,
a transcription factor associated with CD8+ effector phenotype
(Supplemental Figure 2D and ref. 26). Furthermore, T-Tsc2–/–
CD8+ T cells demonstrated high cytolytic function, as
deter-mined by an in vivo cytotoxic T lymphocyte (CTL) assay (Figure 3D). In contrast, T-Rheb–/– CD8+ T cells, which have reduced
mTORC1 signaling, have reduced numbers of antigen-specific T cells; expressed decreased levels of KLRG1, IFN-γ, TNF-α, and T-bet; and demonstrated decreased cytolytic function (Fig-ure 3 and Supplemental Fig(Fig-ure 2D). However, similar to our in vitro findings, OVA-specific T-Rheb–/– CD8+ T cells demonstrated
elevated expression of CD127 compared with WT cells, while OVA-specific T-Tsc2–/– CD8+ T cells had the lowest expression
(Supplemental Figure 2E). Thus, hyperactivation of mTORC1 leads to enhanced accumulation of potent CD8+ T effector cells
in vivo, while mTORC1 deficiency promotes CD127 expression. Next, we crossed all genotypes onto the OT-I background, so that the mice expressed a TCR specific for the OVA MHC class I peptide, SIINFEKL. OT-I+ WT, T-Rheb–/–, and T-Tsc2–/– mice all
have similar development of SIINFEKL-specific CD8+ T cells,
with 98% of CD8+ splenocytes expressing the Vβ5.1/Vβ5.2 TCR
(Supplemental Figure 3A). OT-I+ WT, T-Rheb–/–, and T-Tsc2–/– CD8+
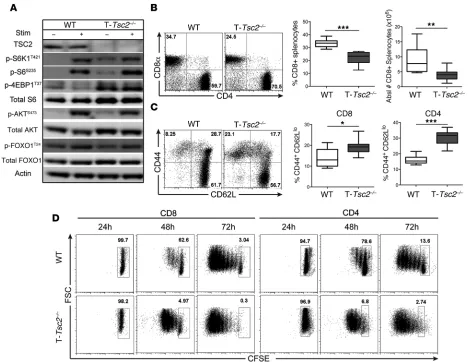
Consistent with its role in negatively regulating mTORC1 activity, Tsc2 deletion in CD8+ T cells resulted in elevated phosphorylation
of ribosomal S6 kinase 1 (S6K1), ribosomal S6, and 4E-BP1 under both unstimulated and TCR-stimulated conditions (Figure 1A and Supplemental Figure 1B) (21). mTORC2 activity, as assessed by phosphorylation of AKT at S473, was still intact in T-Tsc2–/– CD8+
T cells following TCR stimulation, albeit slightly reduced from WT levels (Figure 1A). Phenotypic analysis of T-Tsc2–/– mice revealed
normal percentages and absolute numbers of T and B cells but a decreased CD8+ to CD4+ T cell ratio (Figure 1B and Supplemental
Figure 1, C–E). As TSC2 is deleted after the double-positive stage of thymic development, we suspect that these altered CD4/CD8 ratios reflect post-thymic events. Further analysis revealed that T-Tsc2–/– CD8+ and CD4+ T cells have an increased CD44hiCD62Llo
population, indicative of an activated phenotype (Figure 1C). Con-sistent with this activated phenotype, T-Tsc2–/– CD8+ and CD4+
T cells exhibited enhanced proliferation upon TCR engagement compared with WT cells (Figure 1D).
The role of TSC2 in T cells has yet to be described. Recent reports have examined the role of TSC1 in T cells and have observed increases in apoptosis in TSC1-deficient T cells (13–16). The increased apoptosis was associated with decreased AKT activity and decreased expression of the antiapoptotic proteins, BCL-2 and BCL-XL. In contrast, ex vivo survival and activa-tion-induced cell death were equivalent in T-Tsc2–/– and WT CD8+
T cells (Supplemental Figure 1, F and G). Unlike that observed in Tsc1–/– T cells, T-Tsc2–/– CD8+ T cells had equivalent levels of BCL-2
and BCL-XL when compared with those in WT CD8+ T cells
(Sup-plemental Figure 1, H and I). Thus, while TSC1 deletion leads to increased cell death in T cells, TSC2 deletion results in enhanced proliferation and activation. Mechanistically, these differences seem to reflect the fact that the Tsc1–/– T cells lack mTORC2
activ-ity, as indicated by impaired phosphorylation of AKT at S473 (13, 14, 16), while in T-Tsc2–/– CD8+ T cells, AKT activity was relatively
intact (Figure 1A). Additionally, TSC1 deficiency resulted in a loss of TSC2 protein, while TSC1 expression was intact in T-Tsc2–/–
cells (Supplemental Figure 1J) (22).
Next, we wanted to determine the effect of TSC2 deficiency on the function of CD8+ effector T cells. As expected, T-Tsc2–/– CD8+
T cells demonstrated enhanced mTORC1 activation but intact mTORC2 signaling (Figure 2, A and B). Furthermore, upon restimu-lation, T-Tsc2–/– CD8+ T cells exhibited enhanced production of IFN-γ
and TNF-α, in addition to increased granzyme B expression (Figure 2C). This increase in IFN-γ production was detected in T-Tsc2–/– CD8+
T cells by 24 hours after initial stimulation (Supplemental Figure 2A). Furthermore, an increase in IFN-γ production was also detected in T-Tsc2–/– CD4+ T cells (Supplemental Figure 2B).
To determine whether the enhanced effector function observed in T-Tsc2–/– CD8+ T cells was due to previous activation,
we assessed cytokine production of sorted naive CD8+ T cells.
Stimulation of naive T-Tsc2–/– CD8+ T cells resulted in elevated
IFN-γ and TNF-α production, compared with that in stimulated naive WT CD8+ T cells (Figure 2D), in addition to increased
prolif-eration (Figure 2E). Thus, while T cells from T-Tsc2–/– mice have a
propensity to have an activated phenotype, the enhanced effector function and proliferative capacity of T-Tsc2–/– CD8+ T cells is not
The Journal of Clinical Investigation
R e s e a R c h a R t i c l e
increased cytokine production compared with WT cells after vac-cinia-OVA infection (Supplemental Figure 3C). Interestingly, the adoptive transfer of naive T-Tsc2–/– OT-I+ T cells did not
consis-tently display a proliferative advantage when compared with WT T cells (Supplemental Figure 3C). This is in contrast to our find-ing that naive T-Tsc2–/– CD8+ T cells proliferate to a greater extent
than naive WT T cells after in vitro stimulation (Figure 2E). Thus, for unclear reasons, while in vivo endogenous and adoptively transferred T-Tsc2–/– CD8+ T cells (Figure 3A and Figure 4A) and
in vitro naive T-Tsc2–/– CD8+ T cells (Figure 2E) proliferated to a
greater extent than WT T cells, adoptively transferred naive OT-I+
T-Tsc2–/– CD8+ T cells did not.
Next, we wanted to determine the ability of such cells to reject tumors. To this end, T-Tsc2–/– and WT mice were
chal-lenged with a s.q. injection of an EL4 thymoma line engineered to express luciferase. T-Tsc2–/– mice cleared the tumor, while the
tumors in WT mice had an exponential increase in growth, as T cells congenically marked with CD90.1 were adoptively
trans-ferred into WT CD90.2+ recipients that were infected with
vac-cinia-OVA. Six days after infection, the percentage of OT-I+
sple-nocytes was assessed. Consistent with our endogenous findings, T-Tsc2–/– CD8+ T cells exhibited dramatically enhanced numbers
of antigen-specific cells and increased BrdU uptake, in addition to increased KLRG1 expression and effector cytokine production (Figure 4A and Supplemental Figure 3B). In contrast, CD8+ T cells
from T-Rheb–/– mice demonstrated markedly impaired expansion,
diminished KLRG1 expression, reduced production of effector cytokines IFN-γ and TNF-α, and reduced BrdU uptake (Figure 4A and Supplemental Figure 3B). Overall, these findings demonstrate the ability of TSC2 to regulate CD8+ T cell effector generation
through cell-intrinsic regulation of mTORC1.
As with our in vitro experiments, we repeated the adop-tive transfer with a starting population of sorted naive CD8+ T
[image:4.585.56.526.54.416.2]cells. Naive T-Tsc2–/– antigen-specific CD8+ T cells demonstrated
Figure 1. Tsc2 deletion in CD8+ T cells yields a hyperactivated phenotype. WT and T-Tsc2–/– splenocytes were harvested from 6-week-old mice. (A) mTORC1
The Journal of Clinical Investigation
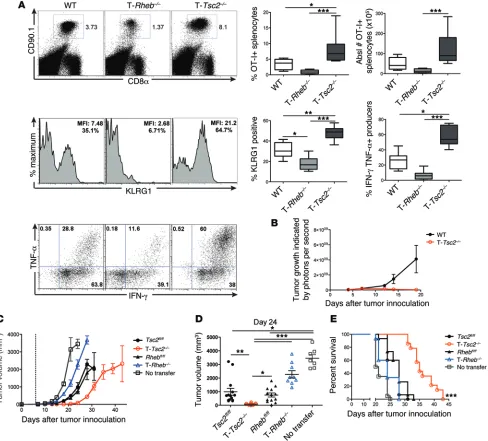
R e s e a R c h a R t i c l estatistically significant, based on repeated-measures analysis with respect to group and time (see Statistics). Furthermore, T-Rheb–/– mice developed the greatest tumor burden compared
with that of littermate controls in an EL4 tumor model (Supple-mental Figure 4B).
Constitutive activation of mTORC1 yields terminally differen-tiated effector cells at the expense of memory formation. Although T-Tsc2–/– cells do not have a survival defect prior to or after acute
stimulation, 6 days after vaccinia-OVA infection, OVA-specific T-Tsc2–/– CD8+ T cells have enhanced expression of active
cas-pase-3 and low expression of BCL-2, while OVA-specific T-Rheb–/–
CD8+ T cells have the highest BCL-2 expression (Supplemental
indicated by luciferase signal (Figure 4B). Furthermore, when challenged with EL-4 tumor cells, 100% of the T-Tsc2–/– mice
survived past day 40, while WT mice did not (Supplemental Fig-ure 7F). The enhanced ability of T-Tsc2–/– CD8+ T cells to reject
tumor was recapitulated in a B16 melanoma model. Adoptive transfer of in vitro–activated T-Tsc2–/– OT-I+ T cells into WT
mice challenged with OVA-expressing B16 melanoma tumor cells resulted in slower tumor growth and a greater survival advantage than transfer of littermate control (Tsc2fl/fl or Rhebfl/fl)
OT-I+ T cells (Figure 4, C–E, and Supplemental Figure 4A). In
contrast, transfer of activated T-Rheb–/– OT-I+ cells offered the
[image:5.585.54.540.59.462.2]least protection (Figure 4, C–E). Tumor growth in Figure 4C is
Figure 2. mTORC1 activity is required to promote CD8+ effector T cell responses in vitro. (A) mTORC1 activity was assessed by flow cytometric analysis of
phosphorylated S6S235/236 expression from WT, T-Tsc2–/–, and T-Rheb–/– purified CD8+ T cells stimulated (+S) for 48 hours with αCD3/αCD28 compared with unstimulated WT controls (WT NS). The mean fluorescence intensity (MFI) for each genotype is shown in the upper corner. (B) Purified CD8+ T cells were collected from WT, T-Rheb–/–, or T-Tsc2–/– mice. mTORC2 activity was assessed by immunoblot analysis from unstimulated cells or after 1.5-hour
The Journal of Clinical Investigation
R e s e a R c h a R t i c l e
with previous studies demonstrating that rapamycin can promote the generation of memory cells (27, 28). There was a 2-fold reduc-tion of antigen-specific cells in T-Tsc2–/– mice compared with that
in WT mice (Figure 5A and Supplemental Figure 5C). Importantly, T-Rheb–/– T cells failed to respond to SIINFEKL upon rechallenge
(Figure 5, B and C). Alternatively, the few T-Tsc2–/– CD8+ T cells
that still remained at this late time point responded robustly. Thus, these data indicate that, while RHEB deficiency results in Figure 5, A and B). Thus, we wanted to determine the potential role
of TSC2 and RHEB in regulating T cell memory. WT, T-Rheb–/–,
and T-Tsc2–/– mice were infected with vaccinia-OVA and
tetram-er-positive T cells were assessed 30 days following infection. In contrast to our findings during acute infection, 30 days after infec-tion we observed a 2-fold increase of activated, antigen-specific CD8+ T cells in T-Rheb–/– mice compared with that in WT mice
[image:6.585.57.514.59.506.2](Figure 5A and Supplemental Figure 5C). This result is consistent
The Journal of Clinical Investigation
R e s e a R c h a R t i c l eenhanced longevity of antigen-specific cells, these cells fail to respond upon rechallenge, suggesting that they do not possess true memory characteristics.
We hypothesized that the decrease in memory T cells observed in the T-Tsc2–/– mice was the result of persistent mTORC1
activa-tion inhibiting the upregulaactiva-tion of the cellular programs necessary for long-term survival. To test this hypothesis, WT and T-Tsc2–/–
OT-I+ T cells were adoptively transferred into WT mice infected
with vaccinia-OVA, and a cohort of mice that received T-Tsc2–/–
OT-I+ cells was treated daily with 100 μg/kg rapamycin, starting
on day 5 after infection. Treatment with rapamycin markedly enhanced the survival of antigen-specific T-Tsc2–/– CD8+ T cells 21
[image:7.585.55.543.58.499.2]days following infection (Figure 6, A and B). The increase in sur-vival was associated with an increase in the expression of CD127 Figure 4. The ability of hyperactive mTORC1 signaling to promote effector function is cell intrinsic. (A) OT-I+CD90.1+CD8+ T cells from WT, T-Rheb–/–,
and T-Tsc2–/– mice were adoptively transferred into WT CD90.2+ recipient mice infected with vaccinia-OVA. Six days after infection, splenocytes were harvested. The percentage of splenic CD8+ CD90.1+ T cells, KLRG1 expression of CD8+CD90.1+ cells, and IFN-γ and TNF-α production after SIINFEKL peptide stimulation are shown, with statistics to the right (n = 10). For the box-and-whiskers plots, the whiskers represent the minimum and maxi-mum values, the box boundaries represent the 25th and 75th percentiles, and the middle line is the median value. (B) WT and T-Tsc2–/– mice received
s.q. EL4 thymoma cells expressing luciferase. Tumor burden was assessed by detection of luminescence (n = 16). (C–E) In vitro–activated T-Rheb–/–
and T-Tsc2–/– and littermate control OT-I+CD8+ T cells were injected into WT recipients that had received B16-OVA cells 6 days prior (dashed line rep-resents T cell transfer). “No transfer” indicates that mice did not receive OT-I+ cells. (C) Tumor volume was assessed every 2 to 3 days. Each symbol represents an average per genotype (n = 15). (D) Tumor volume shown at day 24 after tumor inoculation. Each dot represents a mouse. Data are derived from C. (E) Survival was assessed. Mice that received T-Tsc2–/– cells had enhanced survival compared with all other treatments, as determined
The Journal of Clinical Investigation
R e s e a R c h a R t i c l e
and eomesodermin, a transcription factor associated with CD8+
memory (ref. 29 and Figure 6, C and D). Consistent with the role of mTORC1 in enhancing effector cell generation, this treatment also led to a decrease in KLRG1 and T-bet expression in T-Tsc2–/–
OT-I+ cells (Figure 6, A–D). Importantly, rapamycin treatment also
promoted an enhanced recall response of T-Tsc2–/– OT-I+CD8+
T cells to a secondary infection with listeria-OVA (lm-OVA) (Fig-ure 6E). This recall response was not observed in mice given T-Tsc2–/– cells without rapamycin. Thus, temporarily blocking
mTORC1 activity in T-Tsc2–/– CD8+ T cells promotes the
genera-tion of funcgenera-tional memory T cells.
TSC2 regulates the activation-induced metabolic switch in T cells. We next assessed the metabolic flux of activated CD8+ T cells from
WT, T-Tsc2–/–, and T-Rheb–/– mice. T-Tsc2–/– CD8+ T cells
demon-strated a high extracellular acidification rate (ECAR), indicative of increased glycolysis, compared with WT T cells (Figure 7A). In support of this high glycolytic rate, activated T-Tsc2–/– cells have
enhanced transcript expression of Slc2a1 (the glucose transporter GLUT1) and the key glycolytic enzyme phosphofructokinase (Pfk1) (Figure 7B). In contrast, T-Rheb–/– T cells demonstrated markedly
decreased glycolytic activity and diminished expression of Slc2a1
and Pfk1. However, T-Rheb–/– CD8+ T cells have an increased spare
respiratory capacity (SRC), an indicator of mitochondrial energy potential associated with long-term cellular survival (Figure 7C) (6). In support of this finding, previously activated T-Rheb–/– CD8+
T cells exhibited the highest mitochondrial mass, as indicated by MitoTracker Green staining (Figure 7D). Furthermore, T-Rheb–/–
CD8+ T cells demonstrated a increase in expression of carnitine
palmitoyltransferase 1 α (Cpt1a), the rate-limiting step of FAO (30, 31), which is also associated with the development of mem-ory CD8+ T cells (ref. 6 and Figure 7E). In contrast, T-Tsc2–/– CD8+
T cells have the lowest SRC, mitochondrial mass, and Cpt1a expression (Figure 7, C–E). Thus, these data indicate that mTORC1 activity is a rheostat for CD8+ metabolic function. Tsc2 deletion
results in enhanced glycolytic metabolism at the expense of oxi-dative phosphorylation, while loss of mTORC1 activity decreases glycolysis but promotes oxidative phosphorylation and FAO.
To determine whether the enhanced effector function of T-Tsc2–/– CD8+ T cells is dependent on an enhanced glycolytic
metabolism, we assessed T-Tsc2–/– effector function in vivo after
[image:8.585.47.533.52.386.2]daily treatment with 2-deoxy-d-glucose (2DG), an inhibitor of glycolysis (32). 2DG treatment greatly reduced the percentage of Figure 5. TSC2 inhibition results in terminally differentiated effector cells. WT, T-Rheb–/–, and T-Tsc2–/– mice were infected with vaccinia-OVA. Thirty days
The Journal of Clinical Investigation
R e s e a R c h a R t i c l ement decreases the glycolytic metabolism of activated T-Tsc2–/–
cells, enabling the generation of memory cells.
A novel role for mTORC2 in regulating CD8+ T cell memory. We
next wanted to determine whether mTORC2 activity is important for regulating CD8+ T cell fate decisions. To this end, we used mice
in which RICTOR, a critical component of mTORC2, is condition-ally deleted in T cells (Cd4-Cre Rictorfl/fl mice, herein referred to as
T-Rictor–/– mice). Upon TCR stimulation, T-Rictor–/– CD8+ T cells
have intact, if not slightly elevated, mTORC1 activity, consistent with the release of a mTORC2 feedback loop (33), and decreased mTORC2 activity (Figure 8A and Supplemental Figure 7A).
T-Rictor–/– CD8+ T cells have proliferative capacity and
cytok-ine production equivalent to those of WT cells (Supplemental recovered T-Tsc2–/– OT-I+CD8+ T cells and the IFN-γ production
of OT-I+ T cells after vaccinia-OVA infection, thus proving a
cor-relation between glycolytic metabolism and T-Tsc2–/– CD8+ T cell
effector response (Figure 7F).
In as much as rapamycin was able to enhance memory gener-ation in the T-Tsc2–/– CD8+ T cells, we next examined the effect of
rapamycin on metabolism. Rapamycin treatment reduced glycol-ysis, as measured by ECAR, in T-Tsc2–/– CD8+ T cells (Figure 7G).
This finding was associated with a decrease in Slc2a1 and Pfk1 (Fig-ure 7H). In contrast, rapamycin promoted enhanced SRC (Fig(Fig-ure 7I and Supplemental Figure 6A) and increased expression of Cpt1a in WT and T-Tsc2–/– CD8+ T cells (Figure 7J and Supplemental
Fig-ure 6B). Thus, inhibition of mTORC1 through rapamycin
treat-Figure 6. Rapamycin treatment can rescue the terminal effector differentiation of T-Tsc2–/– CD8+ T cells. WT and T-Tsc2–/–OT-I+CD8+CD90.1+ T cells were adoptively transferred into WT CD90.2+ recipients infected with vaccinia-OVA. A cohort of mice that received T-Tsc2–/– cells was treated with rapamycin. (A)
[image:9.585.47.544.65.465.2]The Journal of Clinical Investigation
R e s e a R c h a R t i c l e
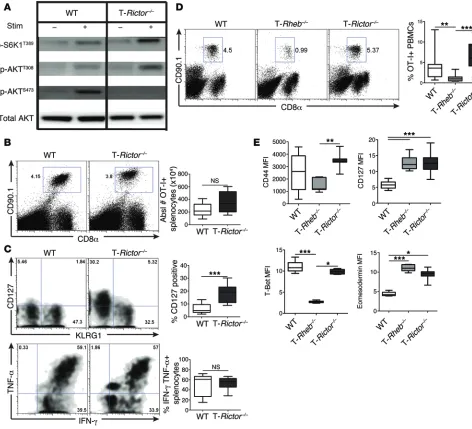
the blood and spleen (Supplemental Figure 7C). OVA-specific T-Rictor–/– cells expressed KLRG1 and produced robust amounts of
IFN-γ and TNF-α, similar to WT cells, upon ex vivo restimulation (Figure 8C). Surprisingly, at this early time point (day 6 after infec-tion), we also observed a substantial population of T-Rictor–/– cells
expressing CD127 (Figure 8C). These findings were recapitulated after transfer of sorted naive cells. Six days after infection, trans-fer of naive T-Rictor–/– OT-I+CD8+ T cells resulted in equivalent,
Figure 7B). To further understand the role of mTORC2 in CD8+
T cell effector function, we used the in vivo adoptive transfer model. Congenically marked WT and T-Rictor–/– OT-I+ T cells were
adoptively transferred into recipient mice that were immediately infected with vaccinia-OVA. Unlike T cells derived from T-Rheb–/–
mice, T-Rictor–/– cells generated a response to vaccinia-OVA
[image:10.585.49.534.60.486.2]infec-tion similar to that of WT cells (Figure 8B). This response was observed and equivalent for antigen-specific cells derived from
Figure 7. mTORC1 activity influences CD8+ T cell metabolism upon TCR stimulation. (A–E) Purified CD8+ T cells from WT, T-Rheb–/–, and T-Tsc2–/– mice
were stimulated in vitro for 48 hours and cultured in IL-7 and IL-15 for 3 days. (A) Cells were run on an extracellular flux analyzer, and ECAR was determined. Data are mean ± SEM of 7 measurements. (B) RNA was extracted and relative expression of GLUT1 (Slc2a1) and Pfk1 transcripts was determined by qPCR. (C) As in A, SRC was determined. (D) MitoTracker Green staining was assessed by flow cytometry. (E) As in B, Cpt1a expression was measured. (F) T-Tsc2–/–
The Journal of Clinical Investigation
R e s e a R c h a R t i c l emore, antigen-specific T-Rictor–/– cells have low levels of caspase-3
activity, similar to WT and T-Rheb–/– CD8+ T cells, but the highest
expression of BCL-2 (Supplemental Figure 7, D and E). Thus, CD8+
T cells with diminished mTORC2 activity generate robust effector responses, while simultaneously expressing markers of memory.
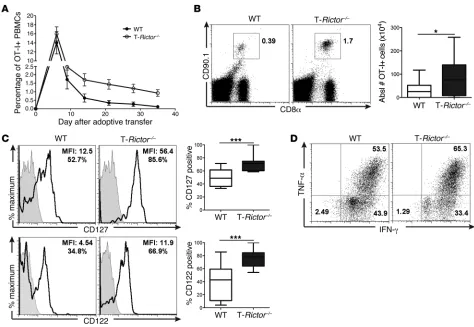
To further investigate the longevity of T-Rictor–/– CD8+ T cells,
we tracked the frequency of WT and T-Rictor–/– OT-I+ T cells for
35 days after infection in the blood (Figure 9A). By day 12, the frequency of T-Rictor–/– OT-I+CD8+ T cells was higher than that
if not enhanced, accumulation of antigen-specific CD8+ T cells
compared with transfer of WT cells, while T-Rheb–/– CD8+ T cell
transfer yielded the lowest percentage of antigen-specific CD8+
T cells (Figure 8D). Additionally, T-Rictor–/– CD8+ T cells have an
activated effector phenotype similar to that of WT cells, express-ing high levels of CD44 and T-bet (Figure 8E). However, T-Rictor–/–
CD8+ T cells also have enhanced expression of CD127 and
eome-sodermin, which were upregulated in T-Rheb–/– CD8+ T cells but
not WT cells at this time point after infection (Figure 8E).
Further-Figure 8. mTORC2 activity is not required for CD8+ T cell effector function. (A) Purified CD8+ T cells were collected from 6-week-old WT or T-Rictor–/– mice.
mTORC1 and mTORC2 activity was assessed by immunoblot analysis from unstimulated cells or after 1-hour stimulation with αCD3/αCD28. (B and C) WT and T-Rictor–/– OT-I+CD8+CD90.1+ cells were adoptively transferred into WT CD90.2+ recipients infected with vaccinia-OVA. Six days after infection, spleno-cytes were harvested. (B) The percentage of OT-I+ splenocytes was determined. The graph depicts the absolute number of OT-I+ splenocytes (n = 12). (C) Surface staining of OT-I+ splenocytes 6 days after infection, with the percentage of recovered OT-I+ cells expressing CD127 (n = 12) (top). Cytokine production of OT-I+ splenocytes after SIINFEKL stimulation, with statistics shown to the right (n = 12) (bottom). (D and E) 1.5 × 10⁵ naive sorted WT, T-Rheb–/–, and
T-Rictor–/– OT-I+CD90.1+ T cells were adoptively transferred into WT CD90.2+ recipients infected with vaccinia-OVA. (D) The percentage of recovered OT-I+ T cells was determined from blood 6 days after infection, with statistics shown to the right (n = 15). (E) Surface marker and transcription factor expression were assessed from recovered OT-I+ splenocytes (n = 9). For the box-and-whiskers plots, the whiskers represent the minimum and maximum values, the box boundaries represent the 25th and 75th percentiles, and the middle line is the median value. Statistics for B and C were determined by Mann-Whitney
[image:11.585.55.527.57.486.2]The Journal of Clinical Investigation
R e s e a R c h a R t i c l e
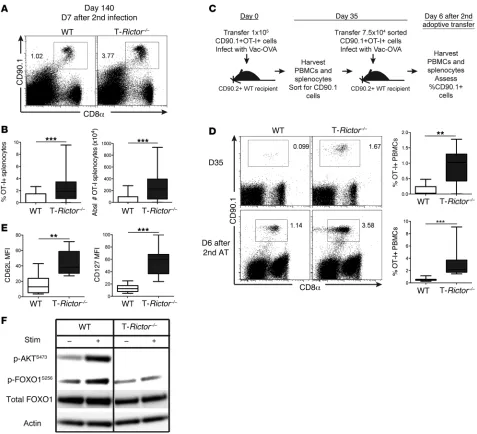
to generate memory cells, we sorted WT and T-Rictor–/– OT-I+
T cells from mice 35 days after infection (Figure 10, C and D) and performed a second adoptive transfer of equivalent cell number into naive recipients. Infection of these mice with vaccinia-OVA resulted in enhanced expansion of the T-Rictor–/– OT-I+ T cells
when compared with the adoptively transferred WT T cells (Figure 10D). Thus, T cells lacking mTORC2 signaling not only demonstrate enhanced differentiation into memory cells but also generate elevated responses upon rechallenge.
We consistently found that long-lived T-Rictor–/– CD8+ T cells
expressed increased levels of CD127, CD62L, and eomesoder-min (Figure 8E and Figure 10E). The expression of these mol-ecules is controlled in part by the transcription factor, FOXO1 (34). Phosphorylation of FOXO1 results in cytoplasmic retention and hence inhibits its function. This phosphorylation has previ-ously been shown to be regulated in part by mTORC2 activity (35). Thus, we hypothesized that the deletion of RICTOR could enhance the generation of memory T cells in part by increas-ing the retention of FOXO1 in the nucleus. Consistent with this of WT cells. Further assessment of splenocytes 26 days after
infection revealed an increased frequency of T-Rictor–/– OT-I+
T cells compared with that of WT cells (Figure 9B). These cells expressed higher levels of the memory cell markers CD127 and CD122 (IL-2R/15Rβ) than WT T cells (Figure 9C). Thus, T-Rictor–/– CD8+ T cells have a survival advantage over memory
cells generated from WT mice.
Having demonstrated that T-Rictor–/– T cells have prolonged
survival with increased markers of memory CD8+ T cells, we
next assessed their ability to respond upon rechallenge. To this end, 26 days after adoptive transfer and infection with vaccinia- OVA, recipient mice were rechallenged with lm-OVA, and the WT and T-Rictor–/– OT-I+ T cell response was determined 6
days later. T-Rictor–/– T cells demonstrated robust production of
IFN-γ and TNF-α upon ex vivo stimulation (Figure 9D). Addi-tionally, the enhanced generation of long-lived memory cells by T-Rictor–/– OT-I+ T cells was observed after rechallenge with
[image:12.585.52.526.53.380.2]lm-OVA 133 days after initial infection (Figure 10, A and B). To further demonstrate the enhanced ability of the T-Rictor–/– T cells
The Journal of Clinical Investigation
R e s e a R c h a R t i c l e(to promote memory differentiation) (6, 36). Regardless of the cytokine milieu, T-Rictor–/– CD8+ T cells demonstrated a marked
increase in ECAR, indicative of a glycolytic metabolism when compared with WT T cells (Figure 11A). That is, even under in vitro conditions that mimic memory generation, the T-Rictor–/–
CD8+ T cells have increased glycolytic flux. Additionally, the
ini-tial oxygen consumption rate (OCR) was elevated in T-Rictor–/–
cells when compared with that in WT T cells in both the effector and memory culture conditions (Figure 11A). Furthermore, while WT and T-Rictor–/– cells have a similar SRC after culture
in IL-7 and IL-15, culture in IL-2 did not diminish the SRC of mechanism, FOXO1 phosphorylation was diminished in
acti-vated T-Rictor–/– CD8+ T cells (Figure 10F). Of note, in spite of
their ability to generate robust memory responses, T-Rictor–/–
T cells were no better at acutely rejecting tumors than WT T cells (Supplemental Figure 7, F and G).
Inhibition of mTORC2 promotes metabolism associated with both effector and memory CD8+ T cells. Next, we sought to
deter-mine whether the ability of mTORC2 to regulate memory cell generation was also linked to metabolism. WT and T-Rictor–/–
CD8+ T cells were stimulated in vitro and expanded in the
[image:13.585.55.532.53.487.2]pres-ence of IL-2 (to promote effector formation) or IL-7 and IL-15
The Journal of Clinical Investigation
R e s e a R c h a R t i c l e
rechallenged with αCD3/αCD28, while simultaneously measur-ing ECAR and OCR. T-Rictor–/– CD8+ T cells displayed increased
ECAR and OCR both at baseline and after restimulation (Fig-ure 11C). In contrast, consistent with their inability to mount an effector response upon rechallenge, T-Rheb–/– T cells failed to
increase glycolytic flux (Figure 11C). However, both T-Rictor–/–
and T-Rheb–/– CD8+ T cells have increased SRC when
com-pared with that of WT T cells (Figure 11D). Furthermore, both T-Rictor–/– and T-Rheb–/– CD8+ T cells expressed increased levels
of Cpt1a after either in vitro or in vivo stimulation (Figure 7E and T-Rictor–/– CD8+ T cells (Figure 11B). Therefore, under
condi-tions that promote glycolysis and effector generation, T-Rictor–/–
T cells still maintain a high SRC, which is associated with the development of memory.
Unlike the T-Rictor–/– T cells, the T-Rheb–/– T cells fail to
respond upon rechallenge. We hypothesized that this might be due to the differences in the ability of T-Rheb–/– and T-Rictor–/–
memory CD8+ T cells to upregulate metabolic programs upon
rechallenge. To this end, WT, T-Rheb–/–, and T-Rictor–/– CD8+
[image:14.585.43.533.62.477.2]T cells were stimulated, cultured in IL-7 and IL-15, and then
Figure 11. mTORC2 inhibition leads to enhanced metabolic fitness. Purified CD8+ T cells from WT or T-Rictor–/– mice were stimulated in vitro for 48 hours
and expanded for 3 days. (A) Initial ECAR, initial OCR, and (B) SRC were determined. Data are mean ± SEM of 7 measurements. (C) WT, T-Rheb–/–, and
T-Rictor–/– CD8+ T cells were stimulated in vitro and cultured in IL-7 and IL-15 for 3 days. Cells were plated at equivalent cell number, and ECAR and OCR mea-surements were assayed upon stimulation in the Seahorse bioanalyzer. Data are mean ± SEM of 12 meamea-surements. (D) SRC was determined after restimu-lation of WT, T-Rheb–/–, and T-Rictor–/– CD8+ T cells expanded in IL-7 and IL-15. Data are mean ± SEM of 10 measurements. Relative expression of Cpt1a tran-script was determined from (E) stimulated cells expanded in IL-7 and IL-15 for 3 days (mean ± SEM of 3 measurements) or from (F) sorted WT, T-Rheb–/–, and
T-Rictor–/– OT-I+ cells recovered 6 days after adoptive transfer into recipients infected with vaccinia-OVA (n = 3 mice per genotype). (G) OCR measurements of restimulated WT, T-Rheb–/–, and T-Rictor–/–CD8+ T cells during a FAO assay. BSA control shown in gray. Data are mean ± SEM of 4 measurements. Statistics in A, B, D, and F were determined by ANOVA; those in C were measured by repeated-measures analysis; and those in E were measured by Mann-Whitney t
The Journal of Clinical Investigation
R e s e a R c h a R t i c l eTo this end, we crossed T-Tsc2–/– mice with T-Rictor–/– mice to
generate T-Tsc2–/– Rictor–/– (Cd4-Cre Tsc2fl/fl Rictorfl/fl,
double-knockout [DKO]) mice. DKO mice have hyperactive mTORC1 signaling but ablated mTORC2 activation (Figure 12A). DKO cells have elevated activation-induced death compared with WT, T-Tsc2–/–, and T-Rictor–/– CD8+ T cells stimulated in vitro
(Figure 12, B and C). We infected WT, T-Tsc2–/–, T-Rictor–/–, and
DKO mice with vaccinia-OVA and assessed effector responses 6 days later. Similar to the reported T-Tsc1–/– T cells (13–16, 37), T
cells lacking both TSC2 and RICTOR demonstrated decreased expansion in response to antigen, decreased KLRG1 and CD127 upregulation, and decreased cytokine production (Figure 12, D–F). Thus, we conclude that intact mTORC2 activity is criti-cal for the hyperactive effector response detected in T-Tsc2–/–
mice and further explains the difference in phenotype between T-Tsc1–/– and T-Tsc2–/– CD8+ T cells.
Figure 11, E and F). This correlated with an increase in OCR in response to palmitate, indicating that activated T-Rictor–/– and
T-Rheb–/– CD8+ T cells can use FAO as an energy source (Figure
11G). Thus, loss of mTORC2 signaling promotes the upregula-tion of metabolic machinery necessary for development of both effector and memory responses.
Finally, we have consistently found that T cell–specific deletion of Tsc2 results in hyperactivated CD8+ T cells that
have enhanced proliferation, cytokine secretion, and killing responses. However, these results are dramatically distinct from previously published findings with TSC1-deficient CD8+ T cells
(13–16, 37). We thus speculated that the differences between the T-Tsc1–/– and T-Tsc2–/– CD8+ T cells might be accounted for
in part by the presence or absence of mTORC2 activity. Recall that, unlike T-Tsc1–/– T cells, T-Tsc2–/– CD8+ T cells have relatively
[image:15.585.52.534.47.445.2]intact mTORC2 signaling (Figure 1A and Figure 2B) (13, 14, 16).
Figure 12. Inhibition of mTORC2 in the presence of hyperactive mTORC1 leads to enhanced cellular death. (A) Purified CD8+ T cells from WT, T-Tsc2–/–,
T-Rictor–/–, and DKO mice were stimulated in vitro for 1 hour, and mTORC1 and mTORC2 activity was assessed by immunoblot. (B) Splenocytes from
The Journal of Clinical Investigation
R e s e a R c h a R t i c l e
diminished glycolysis and failed to become effector cells are consistent with these findings. These results corroborate recent work, which demonstrates impaired effector function and glyco-lytic metabolism in RAPTOR-deficient CD8+ T cells (47).
Impor-tantly, we observed that antigen-experienced T-Rheb–/– T cells,
which display a memory phenotype, also failed to mount a robust effector response upon rechallenge. That is, mTORC1 activity is not only necessary for the initial differentiation into effector cells but is also important for the generation of an effector response derived from memory cells.
The metabolic demands of CD8+ memory T cells differ
greatly from those of effector cells (6). Rather than using gly-colysis, memory cells are much more dependent on fatty acid oxidation (FAO), and their long-term survival is promoted by an increased mitochondrial SRC (6, 48). Along these lines, we demonstrated decreased FAO and SRC in the T-Tsc2–/– CD8+
T cells. Thus, we hypothesize that the increase in CD8+ T cell
activation, combined with the decrease in metabolic repro-gramming necessary for long-term survival, explains the overall reduction of peripheral CD8+ T cells observed in the T-Tsc2–/–
mice. On the other hand, treatment with the mTORC1 inhibitor, rapamycin, restored the ability of the T-Tsc2–/– CD8+ T cells to
differentiate into memory T cells. The ability of rapamycin to promote memory generation in the T-Tsc2–/– mice was
associ-ated with a decrease in glycolysis and an increase in the SRC. Such findings are consistent with previous reports demonstrat-ing the ability of low-dose rapamycin to promote memory cell generation in WT mice (27, 28). Mechanistically, it was shown that rapamycin treatment augments the generation of memory cells in part by mediating a switch from expression of T-bet to eomesodermin. In addition to these immunologic programs, our data demonstrate that mTOR inhibition promotes memory cell generation by regulating metabolism as well. The conse-quences of these observations have begun to be exploited. It was found that rapamycin treatment could enhance the generation of memory T cells in response to vaccinia vaccination in rhe-sus macaques (49). Likewise, it has been shown that rapamycin can also enhance memory T cell generation in mouse models of tumor immunotherapy (28, 50, 51). Further, another report demonstrates that inhibiting glycolysis upon CD8+ T cell
acti-vation enhances the generation of CD8+ T cell memory, which
suggests that the rescue of memory recall in T-Tsc2–/– CD8+
T cells by rapamycin is in part due to decreased glycolytic func-tion (52). Another group observed similar findings, whereby siRNA aptamer targeting of RAPTOR (downregulating mTORC1 signaling) enhanced CD8+ T cell memory responses and had
better therapeutic effect than rapamycin treatment in an antitu-mor vaccine strategy against a murine model of melanoma (53). In light of our findings that TSC2 regulates CD8+ effector
cell generation in an mTORC1-dependent fashion, we wanted to determine the potential role of mTORC2 in regulating CD8+
T cell effector and memory cell fates. To this end, we also exam-ined the generation of effector and memory CD8+ T cells in
T-Rictor–/– mice. Unlike what we observed in T-Rheb–/– mice, the
absence of mTORC2 signaling had no negative consequences for the generation of CD8+ effector cells. Additionally, the
gen-eration of memory T cells in T-Rictor–/– mice was enhanced.
Discussion
Upon antigen recognition, naive CD8+ T cells undergo tremendous
proliferation, leading to the generation and activation of effector CTLs (1). Recent studies emphasize that a critical aspect of effec-tor generation is the upregulation of metabolic programs that help fuel this response (38, 39). In this regard, T cells integrate a vast array of signals from the immune microenvironment in order to coordinate the outcome of antigen recognition with the proper metabolic programs necessary to sustain such a response (7). TSC2 is a critical inhibitor of mTORC1 activation, which is inactivated by PI3-kinase–mediated signaling (40). In this report, we identify TSC2 as a key integrator of CD8+ immune function and
metabo-lism. T-Tsc2–/– CD8+ T cells demonstrate superior effector function
when compared with WT T cells. This was observed in experi-ments using both previously activated and naive T-Tsc2–/– CD8+
T cells. Alternatively, by promoting a glycolytic program necessary for effector cell differentiation and function, the absence of TSC2 precludes the generation of long-lived memory T cells.
TSC2 and TSC1 form the tuberous sclerosis complex, which serves to inhibit mTORC1 by acting as a GAP for RHEB (10). There have been several reports defining the role of TSC1 in CD8 T cell function and survival (13–16, 37, 41). Both TSC1 and TSC2 deficiency result in a reduction of peripheral CD8+ T cells and
enhanced antigen-independent activation and proliferation (13– 15). However, while Tsc1–/– mice have poor CD8+ T cell responses,
demonstrated by a reduction of antigen-specific CD8+ T cells,
and less IFN-γ and TNF-α secretion in response to ex vivo stim-ulation (14, 37), T-Tsc2–/– mice have enhanced CD8+ T cell
effec-tor responses, thus allowing for enhanced acute tumor clearance. Of note, differences between the roles of TSC1 and TSC2 in other cell types are not without precedent (42–45). Mechanistically, the reduction of CD8 T cell responses in Tsc1–/– mice is thought to be
due to increased cellular death resulting from decreased BCL-2 expression as well as abnormal mitochondrial potential and increased reactive oxygen species (13–16). Importantly, we did not observe a decrease in the antiapoptotic molecules BCL-2 or BCL-XL or an increase in TCR-induced cell death in T-Tsc2–/–
CD8+ T cells. Notably, T-Tsc1–/– T cells demonstrate marked
dim-inution in mTORC2 activity, as measured by phosphorylation of AKT (S473) (13, 14, 16). In contrast, we did not observe significant defects in mTORC2 signaling in the T-Tsc2–/– cells. To determine
whether mTORC2 activation is necessary for the enhanced effec-tor function observed in the T-Tsc2–/– cells, we crossed T-Tsc2–/–
mice with T-Rictor–/– mice to generate DKO mice. Interestingly,
DKO mice lose the enhanced CD8+ T cell effector capacities
observed in T-Tsc2–/– mice and, additionally, have a reduction the
CD127 expression demonstrated in T-Rictor–/– mice. This latter
finding is of interest in light of the more recent work demonstrat-ing a role for TSC1 in memory T cell formation (37, 41).
Metabolically, activated T cells demonstrate increased gly-colysis (4). It is thought that by using this relatively inefficient means of generating energy, T cells (and cancer cells) are able to generate important substrates necessary for proliferation (4). Indeed, T-Tsc2–/– CD8+ T cells demonstrate increased glycolysis.
We propose that TSC2 controls glycolysis in part by its ability to inhibit mTORC1 (7, 46). Our observations that T-Rheb–/– T cells,
The Journal of Clinical Investigation
R e s e a R c h a R t i c l egranzyme B (NGZB), and Perforin (eBioOMAK-D). Anti-KLRG1 was obtained from Southern Biotech. The following immunoblot analy-sis antibodies were from Cell Signaling: TSC2, TSC1, anti-p-p70 S6 kinase (T421/424), anti-S6, anti-pS6 (S235/236, D57.2.2E), pS6 (S240/244, D68F8), AKT, pAKT (S473, D9E), anti-pAKT (T308, 244F9), anti-pFOXO1 (S256), anti-FOXO1 (C29H4), and anti–p4E-BP1 (T37/46). Anti-actin and 2DG were purchased from Sigma-Aldrich. BrdU was detected using the BrdU Flow Kit accord-ing to the manufacturer’s specifications (BD). Other reagents used included OVA Class-I tetramer (H-2 kb/SIINFEKL, Beckman Coulter); IL-2, IL-7, and IL-15 cytokines (all from Pepro Tech); and OVA class-I peptide (SIINFEKL, AnaSpec). Stimulatory CD3 (2C11) and anti-CD28 (37.51) were purified from hybridoma supernatants prepared in-house. Rapamycin was purchased from LC Laboratories. CFSE and MitoTracker Green FM were obtained from Invitrogen. GolgiPlug or GolgiStop (BD Biosciences) was used to inhibit cytokine secretion, and the FOXP3 Fixation/Permeabilization Kit (eBioscience) was used for intracellular staining procedures.
T cell in vitro and ex vivo stimulation. In vitro stimulation of
sple-nocytes was performed with soluble anti-CD3 (1 μg/ml) for 48 hours,
followed by a 10-fold media expansion with IL-2 (1 ng/ml) or IL-7 (10 ng/ml) and IL-15 (20 ng/ml) for 3 to 5 days. Live cells were col-lected by density gradient separation (Ficoll, GE Healthcare) and then
restimulated with plate-bound anti-CD3 (1 μg/ml) and soluble
anti-CD28 (2 μg/ml) in the presence of GolgiPlug (BD Biosciences)
over-night. For ex vivo stimulation, cells were stimulated with 10 μg/ml
OVA class I peptide (SIINFEKL) overnight with GolgiPlug. Purified
CD8+ T cells were stimulated with plate-bound anti-CD3 (1 μg/ml)
and soluble anti-CD28 (2 μg/ml).
Flow cytometry and cell sorting. All experiments were per-formed on a BD FACSCalibur or LSR II and analyzed using FlowJo software analysis. Naive cells were obtained after sorting for the
CD8+CD62LhiCD44lo population on a BD FACSAria II. For all flow
cytometry experiments, gates were set appropriately with unstimu-lated and isotype controls.
Immunoblot analysis. Magnetically purified CD8+ T cells (MACS,
Miltenyi Biotech) were stimulated with 1 μg/ml anti-CD3, 2 μg/ml
anti-CD28, and 0.75 μg/ml anti-hamster IgG1 (BD Biosciences).
Sam-ples were flash frozen at each time point and lysed in whole-cell lysis buffer with NaF, PI, PMSF, and NaOV3. Proteins were detected by ECL Plus substrate (GE Healthcare). All images were captured using the UVP Biospectrum500 Imaging System.
Vaccinia infection and Listeria rechallenge. WT, T-Tsc2–/–, and
T-Rheb–/– mice were infected with 1 × 10⁶ PFU vaccinia-OVA (made
in house) by i.p. injection. Six or thirty days after challenge, spleno-cytes were harvested. For adoptive transfer experiments, C57BL/6
CD90.2+ host mice (The Jackson Laboratory) were infected with 1 × 10⁶
PFU vaccinia-OVA i.p. and were given 1 × 10⁶ (unless otherwise noted)
CD8+CD90.1+ OT-I+ T cells by retro-orbital (r.o.) injection from WT,
T-Tsc2–/–, T-Rheb–/–, or T-Rictor–/– OT-I+ mice. Recovery of adoptively
transferred OT-I+ cells was based on CD8+CD90.1+ staining. A cohort
of mice received daily administration of 100 μg/kg rapamycin i.p.
from day 5 to 21. Some mice received a secondary infection with
2 × 10⁶ colony-forming units of lm-OVA i.p. (Lm-626-YNG; gift from
Charles Drake, Johns Hopkins University School of Medicine) on day 21. Mice were sacrificed 6 days after infection, and splenocytes were isolated for analysis. For naive adoptive transfer experiments, cells
This enhancement was associated with increased IL-7 and IL-15 receptor expression (24, 54). The expression of both of these genes is enhanced by FOXO nuclear translocation, which in turn is blocked by mTORC2 activity (34, 55, 56). Thus, mecha-nistically, we propose that mTORC2 limits memory generation by mitigating FOXO-induced expression of these key cytok-ine receptors. Consistent with this idea, recent work has found that CD8+ T cells deficient in FOXO1 are unable to transition to
a memory phenotype (57, 58). Metabolically, T-Rictor–/– T cells
readily mount a glycolytic response to antigen activation but also demonstrate an enhanced SRC associated with long-term survival. Likewise, T-Rictor–/– T cells exhibit high expression of
Cpt1a, endowing them with the ability to metabolize fat-derived carbon sources. It has been reported that memory CD8+ T cells
have enhanced glycolytic capacity upon activation (48). In con-trast to a report using pharmacologic blockade of mTOR that found that mTORC2 is required for the glycolytic switch required during the activation of memory cells, we found that genetic deletion of mTORC2 in CD8+ T cells (T-Rictor–/–) resulted in high
ECAR prior to and upon restimulation, which was not found in mTORC1-deficient (T-Rheb–/–) CD8+ T cells (59). These results
are consistent with a recent report demonstrating increased per-sistence of human tumor-infiltrating lymphocytes after pretreat-ment with an AKT inhibitor (resulting in reduced mTORC2 and mTORC1 activity) (60).
Similarly, our data identifying a role for mTORC2 activity in regulating memory cell generation have interesting clinical implications. Currently, the strategic use of rapamycin is being developed as a means to enhance vaccine efficacy (61). Clearly such a strategy will have to balance the inhibitory effects of rapamycin on effector function with its ability to enhance mem-ory cell generation. Our data using T-Rictor–/– mice suggest that
the selective inhibition of mTORC2 might prove to be an even more effective means of enhancing memory T cell generation, without dampening effector responses.
Methods
Mice. C57BL/6, Cd4-Cre, and OT-I mice were obtained from The Jackson Laboratory and bred to CD90.1 backgrounds. Mice with loxP-flanked Tsc2 alleles were generated by the laboratory of Michael Gambello, University of Texas Health Science Center at Houston, Houston, Texas, USA (21). Mice with loxP-flanked Rheb alleles were generated in the laboratory of Paul Worley, Johns Hopkins University School of Medicine (23). Mice with loxP-flanked Rictor alleles were a gift from Mark Magnuson, Vanderbilt University Medical Center, Nashville, Tennessee, USA (62). Genotyping was determined from respective protocols. All mice were backcrossed on to the C57BL/6 background for 9 generations. Male and female mice were used for each experiment; mice were sex and age matched accordingly.
Antibodies and reagents. Antibodies against the following proteins
were purchased from BD Biosciences: CD4 (GK1.5), CD8α (53-6.7),
CD90.1 (OX-7), Vβ5.1,5.2 TCR, CD44 (IM7), IL-2 (JES6-5H4), TNF-α
(MP6-XT22), IFN-γ (XMG1.2), active caspase-3, and BCL2 (K112-91).
The Journal of Clinical Investigation
R e s e a R c h a R t i c l e
cellular Flux Analyzer (Seahorse Biosciences). Preparation of cells
was as described above in Real-time PCR. 1.5 × 10⁵ cells were plated
per well on poly-d-lysine–coated TC-treated XF96 cell culture microplates. Plating Seahorse media contained 25 mM glucose, 2 mM l-glutamine, and 1 mM Na pyruvate in XF Assay Medium Modified DMEM (Seahorse Biosciences). Mitochondrial inhibitors used were Oligomycin (an inhibitor of mitochondrial ATP synthase,
final concentration 2 μM) and FCCP (an oxidative phosphorylation
uncoupler, final concentration 0.5 mM), both from Sigma-Aldrich. SRC was determined by dividing the OCR after FCCP administra-tion by the OCR before addiadministra-tion of inhibitors. For immediate
assess-ment of ECAR and OCR upon restimulation, isolated CD8+ T cells
were stimulated with plate-bound αCD3 and soluble αCD28 for
48 hours and then expanded into media supplemented with IL-7/
IL-15 for 4 days. 2.5 × 10⁵ live cells were loaded per well in a
lysine-coated TC-treated XF96 cell culture microplate in Seahorse media. The plate was loaded into an XF 96 Extracellular Flux Analyzer (Sea-horse Biosciences) and rested for 60 minutes prior to stimulation with
soluble αCD3/αCD28 (1 μg/ml final concentration). ECAR and OCR
were determined every 6 minutes for a total of 734 minutes. The FAO assay was also run on the XF 96 Extracellular Flux Analyzer. Cells were cultured in KHB assay medium (111 mM NaCl, 4.7 mM KCl,
2 mM MgSO4, 1.2 mM Na2HPO4, 2.5 mM glucose, 0.5 mM carnitine).
XF Palmitate-BSA FAO Substrate (PALM-BSA) was obtained from Seahorse bioscience. Etomoxir, an inhibitor of CPT1A, was added at
a final concentration of 200 μM. Addition of BSA alone served as a
control. PALM-BSA indicates palmitate-conjugated BSA, a substrate for lipid oxidation.
Statistics. All graphs were created using GraphPad Prism software, and statistical analyses were calculated using GraphPad Prism, except for repeated-measures analyses, which were calculated through an R statistical program. Comparisons between 2 independent groups were assessed by Mann-Whitney t tests; comparisons among 3 or more independent groups were calculated by a Kruskal-Wallis ANOVA with a Dunn’s post-test. A P value of less than 0.05 was considered statis-tically significant. Statistical analysis of multiple comparison survival curves was determined after performing Mantel-Cox tests comparing each parameter and correcting the significant P value based upon the Bonferroni correction. Repeated-measures analysis was assessed using R software, where group, time, and interaction between group and time were assayed for significance. All results were confirmed by at least 3 independent experiments. Error bars represent mean ± SEM.
Study approval. All mouse procedures were approved by the Johns Hopkins University Institutional Animal Care and Use Committee and were compliant with the Guide for the Care and Use of Laboratory Animals (8th ed. The National Academies Press. 2011.).
Acknowledgments
We thank Drew Pardoll and members of the Powell lab for review-ing the manuscript. We thank Ada Tam and Lee Blosser for assis-tance with flow cytometry sorting and Brian Herb and Christopher Gamper for assistance with statistical analysis. This work was sup-ported by NIH grants AI072677, AI77610, and AI091481.
Address correspondence to: Jonathan Powell, 1650 Orleans St., CRB-1 Rm 443, Baltimore, Maryland 21287, USA. Phone: 410.502.7887; E-mail: [email protected].
were sorted based on a CD8+Vβ5.1+/Vβ5.2+CD90.1+CD44loCD62Lhi
gating strategy. 1 × 10⁵ cells were injected r.o. into recipients infected
with 1 × 10⁶ PFU vaccinia-OVA i.p. For the secondary adoptive
trans-fer experiment, splenocytes were harvested 35 days after naive
adop-tive transfer and infection. Cells were sorted for the CD8+CD90.1+
population. 7.5 × 10⁴ sorted cells were injected r.o. into naive WT
CD90.2+ recipients infected with 1 × 10⁶ PFU vaccinia-OVA i.p. The
percentage of recovered CD8+CD90.1+ T cells was determined 6
days after transfer. For in vivo 2DG treatment, mice received daily doses of 500 mg/kg 2DG i.p.
In vivo CTL assay. Target cells obtained from WT C57/B6 spleno-cytes were split into 2 conditions. Half of the cells were labeled with
5 μM CFSE and pulsed with 3 μg/ml OVA-I peptide. The remaining
cells were labeled with 0.5 μM CFSE and not peptide pulsed. Cells
from both conditions were mixed at a 1:1 ratio, and 8 × 10⁶ cells were
injected i.v. into mice that had been infected with vaccinia-OVA 6 days prior. Ten hours after injection, spleens were harvested and CFSE-labeled populations were detected by flow cytometry. The percentage lysis was calculated after taking into account the propor-tion of CFSE populapropor-tions found in naive WT mice, using the
follow-ing calculation: 100 × (1 – [% experimental CFSEhi/% experimental
CFSElo]/[% naive CFSEhi/% naive CFSElo]).
Tumor experiments. For the thymoma model, 1 × 10⁶ EL4 cells
expressing luciferase (EL4-LUCI; gift of Hyam Levitsky, Johns Hopkins
University School of Medicine) were injected s.q. into WT or T-Tsc2–/–
mice. After administration, tumor burden was assessed by measuring luminescence on a Xenogen IVIS 10 minutes after i.p. injection of 1.5 mg/kg d-luciferin firefly salt (Caliper LifeSciences). For the
nonluci-ferase EL4-OVA line, 1 × 10⁶ EL4-OVA cells were injected s.q. into WT,
T-Rheb–/–, T-Tsc2–/–, T-Rictor–/–, or littermate control mice. For the B16
melanoma model, C57BL/6 WT mice received a s.q. injection of 2 ×
105 B16-OVA melanoma cells (gift of Hyam Levitsky) cultured in vitro
under OVA selection media containing 400 μg/ml G418 (Life
technol-ogies). Six days after tumor injection, mice received an adoptive
trans-fer of 1.5 × 10⁶ activated T-Rheb–/–, T-Tsc2–/–, Rhebfl/fl, or Tsc2fl/fl OT-I+
cells derived from splenocytes, which had been stimulated in vitro
with SIINFEKL peptide for 48 hours, sorted for CD8+CD90.1+CD44+
population, and expanded in IL-2 for 24 hours. For nonluciferase tumors, tumor burden was assessed every 2 to 4 days by measuring length and width of tumor. Tumor volume was calculated using the
formula for the prolate ellipsoid, (L × W2)/2, where L represents length
and is the longer of the 2 measurements and W represents width. Real-time PCR. Cells were stimulated for 48 hours and then expanded in media supplemented with IL-7 (10 ng/ml) and IL-15 (20 ng/ml) for 3 days. Total RNA was collected using TRIzol reagent (Life Technologies). cDNA was generated with the M-MuLV RT Kit (New England BioLabs), and real-time PCR was performed using TaqMan Universal Master Mix II (Invitrogen). Real-time PCR primers and probes were obtained from Applied Biosystems: Pfkl (Mm00435587_m1), Slc2a1 (Glut1, Mm00441480_m1), Cpt1a
(Mm01231183_m1), and Bcl211 (BCL-XL Mm00437783_m1). ΔΔCt
values were normalized to levels of housekeeping gene 18S ribo-somal RNA (Life Technologies). Relative expression is shown in comparison to WT levels (unless otherwise noted). Analysis was performed on an ABI OneStepPlus 96-well instrument.