© 2017, IRJET | Impact Factor value: 5.181 | ISO 9001:2008 Certified Journal
| Page 339
Analysis of GPS Trajectories Using Pearson and Spearman Correlation
Sharmila J
1, Anolya Anette Avila
2.E, Deepa. N
3, Prabhakaran V.S
41,2,3,4
School of Information Technology and Engineering,
VIT University,Vellore, India.
---***---Abstract-
The dataset has been feed by Android app called Go Track. Go! Track is an application derived from a
research project. The purpose of the application is to provide the user with a set of functionalities useful for daily
traffic:
1- Suggestion of routes;
2- Forecast of time of arrival and departure of bus to a certain point / shelter;
3- Forecast of travel time;
4- Forecast of arrival time;
5- Forecast of congestion;
6- among several others
Keyword
:
Pearson Correlation, Spearman Correlation and control chart.
Introduction
The effectiveness of these features, however, depends on data collected by the application as users intensify their
use. Some of the data collected are: Average speed, Distance traveled, Latitude and longitude (points along the
route), Time, Mode of transport (car or bus), Course evaluation (good, bad, regular) , Sunny), Bus evaluation (full,
normal, empty).In the current version of the application, the only functionality present is the ratio of all existing bus
stops in the city of Aracaju.To use GO! Track, simply activate the location device (GPS) of your smartphone and
choose the means of transport you will use at the moment: car or bus. After choosing the transport mode, tracking
will start immediately after the start button is activated.
© 2017, IRJET | Impact Factor value: 5.181 | ISO 9001:2008 Certified Journal
| Page 340
USER
id
speed
Time
Distance
rating
A
1
19.21059
0.138049
2.652
3
B
2
30.84823
0.171485
5.29
3
C
3
13.5601
0.067699
0.918
3
D
4
19.76668
0.389544
7.7
3
E
8
25.8074
0.154801
3.995
2
F
10
1.346913
0.006682
0.009
2
G
11
36.85079
0.228001
8.402
3
H
12
17.40513
0.038782
0.675
3
I
13
15.39544
0.526844
8.111
3
J
14
8.902729
0.003033
0.027
2
Table i: Sample of Go_TRACK Data
II
GRAPHICAL
REPRESENTATION
In this section, the data is imported to the octave software to form a 2D plot graph. A graphical representation of the data is always considered to be the best form to interpret the data. The number of instances of datas taken is 10 with no missing values.
© 2017, IRJET | Impact Factor value: 5.181 | ISO 9001:2008 Certified Journal
| Page 341
A. Pearson based Attribute Clustering
Correlation is a procedure for exploring the connection between two quantitative, nonstop factors, for instance, age
and circulatory strain. Pearson's connection coefficient (r) is a measure of the quality of the relationship between
the two factors.
The initial phase in concentrate the connection between two persistent factors is to draw a disperse plot of the
factors to check for linearity. The connection coefficient ought not be computed if the relationship is not direct. For
relationship just purposes, it doesn't generally make a difference on which hub the factors are plotted. Be that as it
may, expectedly, the free (or illustrative) variable is plotted on the x-hub (on a level plane) and the ward (or
reaction) variable is plotted on the y-hub (vertically).
The closer the disseminate of focuses is to a straight line, the higher the quality of relationship between the factors.
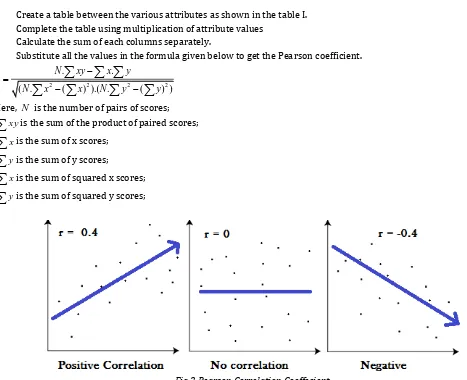
I. Create a table between the various attributes as shown in the table I. II. Complete the table using multiplication of attribute values
III. Calculate the sum of each columns separately.
IV. Substitute all the values in the formula given below to get the Pearson coefficient.
2 2 2 2
. .
( . ( ) ).( . ( ) )
N xy x y r
N x x N y y
Here, N is the number of pairs of scores; xy
is the sum of the product of paired scores;x
is the sum of x scores;y
is the sum of y scores;x
is the sum of squared x scores;y
[image:3.595.56.523.280.660.2]
is the sum of squared y scores;Fig 2:Pearson Correlation Coeffecient
Pearson's correlation coefficient (r) for continuous (interval level) data ranges from -1 to +1
© 2017, IRJET | Impact Factor value: 5.181 | ISO 9001:2008 Certified Journal
| Page 342
TABLE 2:PEARSON CORRELATIONB.Spearman based Attribute Clustering
Spearman's connection coefficient is a factual measure of the quality of a monotonic connection between matched information. In an example it is indicated by and is by configuration obliged as takes after Also, its understanding is like that of Pearsons, e.g. the closer is to the more grounded the monotonic relationship. The figuring of Spearman's connection coefficient and consequent centrality testing of it requires the accompanying information suspicions to hold:
- interim or proportion level or ordinal;
-monotonically related.
Note, dissimilar to Pearson's relationship, there is no necessity of typicality and thus it is a non-parametric measurement.
Here, ρ is the spearman co-efficient
.
ID SPEED TIME DISTANCE RATING
ID 1 -0.35758 -0.16364 -0.10303 -0.85455
SPEED -0.35758 1 0.636364 0.757576 -0.00606
TIME -0.16364 0.636364 1 0.951515 0.163636
DISTANCE -0.10303 0.757576 0.951515 1 0.163636
RATING -0.85455 -0.00606 0.163636 0.163636 1
Table 3:Spearman Similarity Matrix
Attributes ID speed time Distance Rating
ID 1 0.53377 0.46867 0.46713 0.6933
Speed 0.53377 1 0.59199 0.82213 0.85186
Time 0.46867 0.59199 1 0.92954 0.68039
Distance 0.46713 0.82213 0.92954 1 0.71325
© 2017, IRJET | Impact Factor value: 5.181 | ISO 9001:2008 Certified Journal
| Page 343
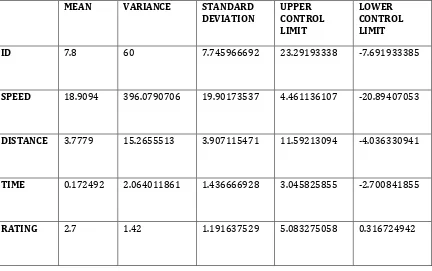
C. Control chart
The control outline is an intense device for accomplishing measurable process control. Be that as it may, in programming improvement it is hard to utilize control outlines in the formal SPC way. It is a considerable undertaking, if not incomprehensible, to characterize the procedure ability of a product improvement prepare. Under conditions, handle capacity is the innate variety of the procedure in connection to as far as possible. The smaller the procedure variety, the better the procedure's capacity. Damaged parts will be parts that are delivered with estimations of parameters outside as far as possible. Thus, coordinate connections exist among particulars, prepare control limits, handle varieties, and item quality. The littler the procedure varieties, the better the item quality will be. Such immediate relationships , in any case, don't exist or if nothing else have not been set up in the product advancement condition.
MEAN VARIANCE STANDARD
DEVIATION UPPER CONTROL LIMIT
LOWER CONTROL LIMIT
ID 7.8 60 7.745966692 23.29193338 -7.691933385
SPEED 18.9094 396.0790706 19.90173537 4.461136107 -20.89407053
DISTANCE 3.7779 15.2655513 3.907115471 11.59213094 -4.036330941
TIME 0.172492 2.064011861 1.436666928 3.045825855 -2.700841855
[image:5.595.84.516.243.514.2]RATING 2.7 1.42 1.191637529 5.083275058 0.316724942
Table 4: Control Chart Table
IV. CONCLUSION
Based on Pearson's correlation coefficient statistical inference often focuses on testing the null hypothesis that the true correlation coefficient ρ is equal to 0, based on the value of the sample correlation coefficient r. It derives a confidence interval that, on repeated sampling, has a given probability of containing ρ. Thus, the go track app is effectively analyzed using Pearson and spearman correlation and control chart.
V. References
1. Wilcox, Rand R. (2005). Introduction to robust estimation and hypothesis testing. Academic Press.
2. Devlin, Susan J; Gnanadesikan, R; Kettenring J.R. (1975). "Robust Estimation and Outlier Detection with Correlation Coefficients". Biometrika. 62 (3): 531–545. doi:10.1093/biomet/62.3.531. JSTOR 2335508.
3. Huber, Peter. J. (2004). Robust Statistics. Wiley.[page needed]
4. Katz., Mitchell H. (2006) Multivariable Analysis – A Practical Guide for Clinicians. 2nd Edition. Cambridge University Press. ISBN 978-0-521-54985-1. ISBN 0-521-54985-X doi:10.2277/052154985X
5. Hotelling, H. (1953). "New Light on the Correlation Coefficient and its Transforms". Journal of the Royal Statistical Society. Series B (Methodological). 15 (2): 193–232. JSTOR 2983768.
© 2017, IRJET | Impact Factor value: 5.181 | ISO 9001:2008 Certified Journal
| Page 344
7. A MATLAB Toolbox for computing Weighted Correlation Coefficients
8. Nikolić, D; Muresan, RC; Feng, W; Singer, W (2012). "Scaled correlation analysis: a better way to compute a
cross-correlogram" (PDF). European Journal of Neuroscience: 1–21. doi:10.1111/j.1460-9568.2011.07987.x.
9. Fulekar (Ed.), M.H. (2009) Bioinformatics: Applications in Life and Environmental Sciences, Springer (pp. 110) ISBN
1-4020-8879-5