http://dx.doi.org/10.4236/jgis.2014.66056
Integrated Evaluation of Soil Erosion Hazard
and Risk Management in the Oued Beht
Watershed Using Remote Sensing and GIS
Techniques: Impacts on El Kansra Dam
Siltation (Morocco)
Rabii El Gaatib, Abdelkader Larabi
Laboratory of Identification and Modelling of Natural Environment (LIMEN), Mohammadia School of Engineers (EMI), Mohammed V University, Rabat, Morocco
Email: [email protected], [email protected]
Received 21 September 2014; revised 20 October 2014; accepted 15 November 2014
Copyright © 2014 by authors and Scientific Research Publishing Inc.
This work is licensed under the Creative Commons Attribution International License (CC BY).
http://creativecommons.org/licenses/by/4.0/
Abstract
The initial state of the Oued Beht watershed (430,728 ha) is characterized by a socio-ecological vulnerability associated to the water erosion risk. Especially, the consequences are chained and the soil loss alters its hydrological behavior and its ability to protect functional and structural challenges (good land, El Kansra dam, agricultural activities). In this perspective, this study sug-gests a methodology, reproducible and generalizable, to assess the natural water erosion risk (R). The approach used is based on spatial processing technology of information to develop a spatial database and geographic information system (GIS) concerning biophysical and topoclimatic pa-rameters in the Oued Beht watershed. Thus, the risk analysis is obtained by combining thematic maps of Susceptibility (S) and potential Consequences (C). Although, the spatial analysis of maps obtained reveals the extent of susceptibility involving land degradation, with the potential risks, which generated a decrease in the storage capacity of El Kansra dam (−3.03 Mm3/year). The
re-sults show that erosion is active on more than three quarters (3/4) of the watershed, and a con-siderable loss of land with 8.36 Million tonnes per year. In this way, flood analysis and study of hydrometeorological events identified the vulnerability of flood sites (hot-spot) contributing at 77% of El Kansra siltation dam. Therefore, the consequence assessment is obtained by identifying risk elements and estimating potential damage coefficient, which represents the financial gap flow af-fecting the socio-economic context due to the erosion impacts.
Keywords
1. Introduction
The seasonal contrast that characterizes the Mediterranean climate of the region increases soil vulnerability and the water erosion risks. The soil capital, which represents a non-renewable resource in the short term, has de-graded and therefore the hydrological equipments, situated downstream, are also threatened. Thus, the erosion process is a dangerous phenomenon that has grown over the years. In Morocco, the superficial mobilization of water resources is 15 billion m3/year and the silting reduces the storage capacity of the dams −75 million m3/year [1]. In this perspective, this paper provides a reference framework for the prevention and management of erosion risks, and offers a roadmap using spatial analysis of biophysical and hydrological environments to handle the spiral of soil and water degradation in the Oued Beht watershed (hereinafter BVOB).
The risk of erosive system starting depends primarily on the presence of spatial manifestations of the phe-nomenon (random component), and secondly on the vulnerability of exposed elements that represent potential consequences (damage to good land, economic activity, livelihoods and the environment). However, on the haz-ard assessment (spatial occurrence), only the class of land susceptibility (S) is analyzed. Therefore, the risk (R) is expressed as a qualitative function of susceptibility and potential consequences, without reference to the tem-poral component of the random [2]. Thus, the main goal is the analysis and good governance of erosion risk, through a spatial approach that combines the characteristics of the phenomena generating the water erosion (Hazard) and characteristics of exposed elements (Vulnerability). Thus, the specific objectives of this study are focused on:
- Analysis of biophysical and hydrometeorological environment to identify erosion types and the extent of their damage.
- Assessment of the susceptibility to the soil loss through water erosion.
- Assessment of the potential consequences by identifying and analysis of potential damage.
- Erosion risk evaluation using spatial combination of susceptibility and consequences maps in order to iden-tify areas at risk and to prescribe scales of specific interventions.
2. Study Area
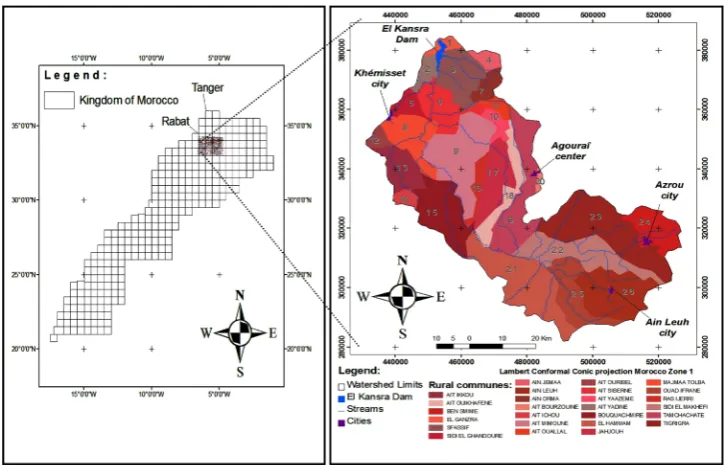
[image:2.595.132.496.467.703.2]The Oued Beht Watershed is located upstream of El Kansra dam (85 km from Rabat), across the Central High-lands and the Middle Atlas of Morocco. The main stream is Oued Beht, affluent of Sebou river one of the most important water resources in the kingdom. Its delimitation by the Geographic Information System (GIS) pro-vides a total area of 430,728 ha (Figure 1).
The Watershed overlaps the administrative territory erected into five (5) provinces and twenty-six (26) Rural Communes. It owns a developed urban system, occupying a central place in socio-economic activities; it is Khémisset city (542,000 inhabitants), Azrou (47,540 inhabitants) and urban centers of Agourai and Ain Leuh [3].
Topographic point of view, the watershed has an altitudinal distribution of its elongated form in a decreasing gradient of the upstream to downstream, in perpendicular bands to the axis coinciding with the direction of the main flow of Oued Beht stream witch represent the line of low altitude (Figure 5(a)).
Climate point of view, the watershed has a rainy winter and a dry summer. Thus, the rainfall is irregular and the rainy season is concentrated between October and May. The annual precipitation is about 500 mm varies from 360 mm in the North West (El Kansra station) to 1000 mm in the east (Ifrane station) [4]. Therefore, the effect of altitude on rainfall is more dominant than the approximation of the sea, while the upland areas are wet-ter than those near the sea (Figure 3).
3. Materials and Methods
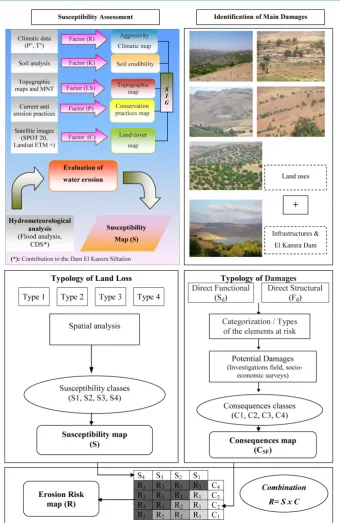
The primary objective of this study is to improve knowledge about the erosion risks linked to hydrogeomor-phological process in order to allow good environmental governance and a better long-term cohabitation with water erosion impacts. Indeed, the preparation of input is produced in GIS environment (ArcGIS 9.3). Thus, the spatial analysis of biophysical and hydrometeorological data is based on empirical models in order to product the decisional map risk. Moreover, the risk assessment obtained is qualitative, not integrate temporal variations. This is due to insufficient data on vulnerability, particularly related to the diversity of erosive processes and the lack of historical information about potential damage.
3.1. Susceptibility Analysis
The susceptibility (sediment producing area) evaluates the spatial occurrence (number of representative pixels) that soil losses take place following the local environmental conditions. The Approach analysis adopted is based on simulation models integrated with GIS tools to evaluate the behavior of the dependent variable (location of soil loss) from a combination of independent predictor variables for homogeneous geomorphologic sites. Thus, the susceptibility is simulated by the model of Universal Soil Loss [5] [6]; considered the most robust approach for erosion hazard assessment (A).
A = R K LS C P,⋅ ⋅ ⋅ ⋅ (1) A: Average annual soil losses possible (t/ha/year);
R: Factor of rainfall erosivity by geographic area; K: Factor of soil erodibility;
LS: Factor of length and gradient of slope; C: Factor of land cover;
P: Factor of conservation practices.
Qualitative assessment is used to give an interpretative synthesis of predisposing erosion factors into different forms (sheets, rills and gully erosion). The approach adopted is performed in accordance with the legend de-scribed in the Priority Action Programme [7]. This approach, based on the Action Plan for the Mediterranean, provides guidelines for mapping erosion types: Localized (<30% of the area is affected), dominant (30% - 60%) and Generalized (>60%).
The Hydrometeorological analysis is used to identify flood sites. Thus, the risk prevention and floods analysis correspond to the determination of flood flows (Qt) and the return period (T) on the reference station (Ouljet Sultan) located strait of the watershed using the Gradex method [8]. Moreover, the data obtained are extrapo-lated to the other sub-basins by the Francou-Rodier method [9]:
( )
1 (kT10)6
8
S SBV
Q T 10
10 −
⋅
= ×
; (2)
- Q (T): Flood flow of ungauged sub-basin for the return period (T); - S.SBV: Area of sub-watershed ungauged (Km2);
6 A
T 8
A
lnQ 10
k 10 1
lnS 10
= × −
; (3)
- QA: Flood flow gauged sub-basin (Ouljet Sultan station) for the return period (T);
- SA: Area gauged sub-basin of Ouljet Sultan (Km2).
a) Preparation of the input
The data used for the susceptibility analysis are grouped into five groups of explanatory variables (R, LS, K, C, and P). The variables used correspond to climatic, geomorphological (soil), topographic (gradient and length of slope, aspect, orientation), hydrographic parameters (distance to streams, drainage density) and land cover. Moreover, thematic maps are made from geoprocessing information. The map of rain erosivity (R) is extrapo-lated from data available in the stations with long periods of observation. The topographic parameters (LS) are derived from the digital terrain model DTM Aster (planimetric accuracy of 30 m, altimetric accuracy of 20 m). Thus, the interpretation of pedological features (K) is used to classify soils in the nomogram Wischmeier [6]. Furthermore, the land cover map (C) is extracted from satellite images SPOT 20 m combined with recent Land-sat ETM + through the supervised classification method and field investigations. Moreover, the Google Earth images and National Forest Inventory map are used to provide more spatial detail linked to agro forestry lands.
b) Susceptibility map
The final susceptibility map is the result of spatial geoprocessing (pixel) by crossing information correlated to water erosion, soil degradation and power flood to cause El Kansra dam siltation. Indeed, the hazard typology is prioritized with classes in order to delimit areas with homogeneous environmental characteristics: low (S1), moderate (S2), high (S3) and very high (S4).
3.2. Consequence Analysis
The potential consequences are evaluated by an analytical approach based on the identification of the exposed elements and the assessment of their vulnerabilities. In this approach, the potential damages are not expressed in numerical value but in hierarchical classes of values [10]. The consequence typology differs: (1) direct structural damages (CS) affecting the good land and the El Kansra dam; and (2) direct functional damages (CF) related to disruption of agricultural activities with local and immediate consequences. Considering the aims of the study, the consequence analysis does not take in consideration the disruption of socio-economic activities that have ex-tra-local (outside watershed).
Therefore, the consequence assessment is a fundamental part of erosion risk analysis. Thus, the various com-ponents of the vulnerability are structured according to a decreasing exponential function. Moreover, the vul-nerability analysis is based on the observation protocol of damage, original and reproducible, applicable to the analysis soil loss due to past erosion events [1]. The erosion cost is defined by the flow differences between the initial net revenue per hectare and the net revenue with the effect of erosion:
( ) xp t
t 0
R =R ×e− (4)
Rt = yield in the year t (tonne/ha);
R0 = initial yield (tonne/ha);
x = damage coefficients (parameters yield loss); p(t) = cumulative land loss in the year t (tonne/ha).
Consequently, the vulnerability input data is based on the results of socio-economic surveys describing the current yields (or revenue) and the latest census data (2004) available in the Office of the High Commissioner for Planning (HCP), the Government agency in charge of producing statistics [3].
Thus, the damage process typology helps to prioritize the consequences classes: low (C1), moderate (C2), high (C3), very high (C4).
3.3. Erosion Risk Assessment (R)
Figure 2.The methodological flowchart to identify priority areas and evaluate soil erosion.
Strong (R3).
4. Results
4.1. Erosion Susceptibility (S) - Rain erosivity factor (R)
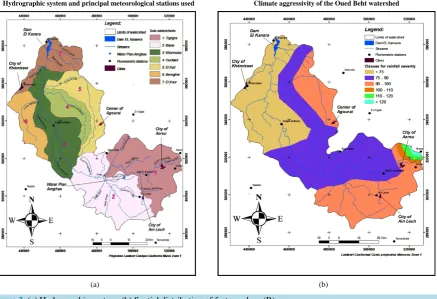
Hydrographic system and principal meteorological stations used Climate aggressivity of the Oued Beht watershed
[image:6.595.96.534.86.385.2]
(a) (b)
Figure 3. (a) Hydrographic system; (b) Spatial distribution of factor values (R).
allow an eminent climate analysis of the Oued Beht watershed [12].
The analysis of the distribution of Climate Aggressivity (Figure 3(b)) shows a double increasing gradient from North to South and from West to East. The larger values are located in the Middle Atlas region (Station Ifrane) with more than 120. Therefore, climate factor (C) has a significant effect on erosion hazard [13].
- Soil erodibility factor (K)
Interpretation of soil characteristics allows to classify all soils in the Wischmeier nomogram and to approach the erodibility factor (K) [6] [14].
The analysis of the soil map obtained (Figure 4(a)) shows that several types of soils coexist with a clear dominance (45%), especially in the downstream part, of poorly evolved soil (PE) used as rangeland, forest areas and agricultural land. Whereas, in the upstream part, the brown soils (B) and brown forest soils (BF) dominate the space. Thus, the results for the soil erodibility factor (K) show that the soils watershed are characterized by their sensitivity to rainfall impact (Figure 4(b)), especially in the upstream part. These intrinsic characteristics combined with slopes increases, which will inevitably cause an amplification of the erosion risk [15].
- Topographical factor (LS)
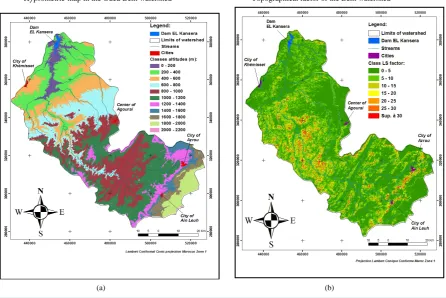
The topo hydrographical configuration is derived from ASTER MNT (30 m pixel). Thus, the configuration obtained is special, following an elongated from northwest to southeast (NW-SE). At the central level, the pres-ence of an atypical Strait (named Ouljet Soltane) separates the watershed to two real sub-basins (SBV). More-over, the relief upstream joins the classic form of karstic regions in the Middle Atlas; and elevations become weaker in a downstream direction (Figure 5(a)).
Except the sub-basin of Kharrouba (Figure 3(a), SBV3), the topographical factor distribution (Figure 5(b)) shows that almost two thirds of watershed (60%) corresponds to low values (less than 5). The majority relief does not present major risks to erosion. This result is equally confirmed in the biophysical study (Figure 5(b)). Moreover, the spatial processing shows that more than half of the slopes length (55%) is less than 1000 m with a majority slopes that are lower than 500 m (30%). The high values are concentrated in the Ouljet Soltane strait and in the downstream part.
- Vegetation cover Factor (C)
Soil types in the Oued Beht watershed Soil erodibility factor (K)
[image:7.595.80.540.81.396.2]
(a) (b)
Figure 4. (a) Soil map; (b) Spatial distribution of the factor (K).
Hypsometricmap in the Oued Beht watershed Topographical factor of the Beht watershed
[image:7.595.90.537.409.707.2]
(a) (b)
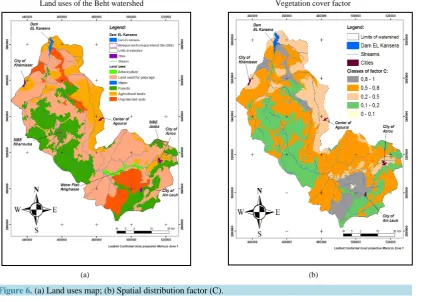
(15.9%), forest formations (28.7%), range lands (44%), Arboriculture (1.4%), Water (0.3%) and denuded Soil (9.7%) (Figure 6(a)). Therefore, the analysis of the cover Factor distribution (Figure 6(b)) shows that more than half of the watershed (55%) has low and very low protection levels (greater than 0.5). Consequently, vege-tation factor (C) has a significant effect on susceptibility.
- Cultural practices Factor (P)
The local investigations about land uses reveal that land allocated for agriculture and arboriculture are char-acterized by the absence of erosion control practices. The factor (P) consequently takes a value of 1.
- Erosion evaluation
The application of the Wischmeier model to each sub-basin gives an annual average quantity of 8.36 million tonnes; and the average soil erosion is 19.40 t/ha/year (Table 1) [16] [17].
Land uses of the Beht watershed Vegetation cover factor
[image:8.595.106.529.218.520.2]
(a) (b)
Figure 6.(a) Land uses map; (b) Spatial distribution factor (C).
Table 1. Average soil loss for sub-watershed.
N˚ SBV Main Stream Sup. (ha) DR* Specific Degradation
Average (t/ha/an) Total Loss (t/an)
1 Tigrigra 90,937 0.10 12.73 1 157 971.49
2 Ifrane 101,960 0.16 18.21 1 856 559.40
3 Kharrouba 79,812 0.58 43.08 3 437 970.86
4 Ouchket 32,653 0.15 7.34 239 795.75
5 El Kell 48,720 0.25 13.84 674 274.97
6 Beregline 35,326 0.31 16.64 587 840.54
7 El Kour 41,320 0.21 9.73 402 055.18
Watershed - 430,728 0.09 19.40 8 356 468.19
*
[image:8.595.89.539.538.705.2]The highest soil losses are recorded at the erodible sites linked to SBV 3, 2 and 1 (Figure 7(b)), respectively drained by the streams of Kharrouba, Ifrane and Tigrigra (Figure 3(a)) accumulating a quantity of 6.45 million t/year, representing 77% of the total sediment production in the Oued Beht watershed. Thus, urgent biological and physical actions are needed in this region to control erosion impact [18].
In addition, the examination of the transport coefficients calculated shows that the sediments begin in the sub-basins easily attain the nearest binding. Thus, the sediment transport correlated to erosion risk is facilitated by high density and high level hydrographical system in the Oued Beht watershed (Figure 3(b)).
The distribution analysis of the specific degradation (Figure 8) reveals that the extent of the hazard erosion is
Erosion types characterizing the watershed Susceptibility evaluation map
[image:9.595.108.524.207.656.2]
(a) (b)
Figure 7. (a) Water erosion types; (b) Susceptibility map.
higher in the Kharrouba sub-basin even though that its area (798.12 km2) is lower than the other two sub-basins of Ifrane and Tigrigra. Moreover, the Kharrouba sub-basin is characterized by difficult conditions translated on Topographical factor (LS) greater than 10 (Figure 5(b)).
4.2. Floods Analysis
Bathymetric data realized on the El Kansra, dam for a period of 23 years, gives an idea about the importance of siltation El Kansra Dam, which is 3.03 Mm3/year [4]. This indicator reveals the extent of the solid charge was transported and potential damage (functional and structural damage) related to driving the soil particles under the impact of the erosion risk.
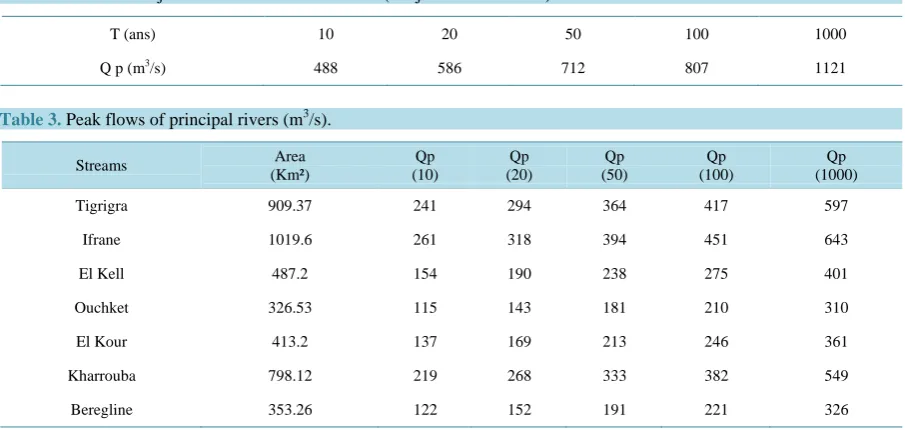
It is important to mention that right of the Ouljet Soltane station (Figure 3(a), SBV 3) the statistical adjust-ment of annual instantaneous flood flows, for a period of 22 years, shows that the decennial and the millennium flow are respectively 488 m3/s and 1.121 m3/s (Table 2).
For the other sub-basins, the application of the Francou-Rodier model and the calculating of the regional pa-rameter on gauged basin (right of Ouljet Soltane station) allow to extrapolate the flow-project obtained to adja-cent sub-basins and to identify flood sites (Figure 7(b)). Therefore, the risk areas are sites (sub-basins) drained by Ifrane, Tigrigra and Kharrouba rivers. These are vulnerable areas characterized by the importance of flood formation cycles and maximum instantaneous flows (Table 3).
In conclusion, the response of the watershed indicates a spatial homogeneity to rainfall fluctuations revealing high peak flows for different return periods (Table 3).
4.3. Susceptibility Evaluation
The hazard zoning obtained (Figure 7(b)) and the analysis of cumulative curves (number of pixels) defines four susceptibility classes in the Oued Beht watershed:
- Low susceptibility (S1): The start of the erosion is negligible almost half of the watershed, with 44.5%. In fact, micro zonal conditions contribute to the stability of the land. Gradients of the slopes are very low (lower than 5%), on agricultural land which are well maintained and well drained.
- Moderate susceptibility (S2): Local environmental conditions are also favourable to the onset of low land loss in almost a quarter of the watershed (24.4%). It is protected forest areas and the slope gradients are low to moderate (5% - 25%). However, the abandonment of the reservation land or the local presence of slope failure could lead to destabilization.
[image:10.595.87.540.501.716.2]High susceptibility (S3): Local environmental conditions are favourable for triggering erosion (11.4%). It is range land and unprotected forest formations located on moderately degraded and characterized by poor soil
Table 2. Statistical adjustment of annual flows flood (Ouljet Soltane station).
T (ans) 10 20 50 100 1000
Q p (m3/s) 488 586 712 807 1121
Table 3. Peak flows of principal rivers (m3/s).
Streams Area
(Km²) Qp (10) Qp (20) Qp (50) Qp (100) Qp (1000)
Tigrigra 909.37 241 294 364 417 597
Ifrane 1019.6 261 318 394 451 643
El Kell 487.2 154 190 238 275 401
Ouchket 326.53 115 143 181 210 310
El Kour 413.2 137 169 213 246 361
Kharrouba 798.12 219 268 333 382 549
drainage techniques. The degrees of slopes are moderate to strong (25% - 45%).
- Very high susceptibility (S4): The possibilities of the start of erosion are strong and the local environmental conditions are very favorable for that in 19.7%. Soils are severely degraded, poorly maintained and managed. The general appearance is marked by the absence of vegetation or forests. Thus, the erosion is very active with a significant soil loss with strong slope gradient (Sup 45%).
In conclusion, this exploratory procedure shows amply the system capacity to generate automatically the haz-ard zoning. Almost a third (31%) of the Oued Beht watershed presents high to very strong susceptibility. The four hazard levels can be combined with vulnerability with four levels. This Integrated analysis would produce risk maps, or rather the deficit existing protection.
4.4. Potential Consequences Analysis
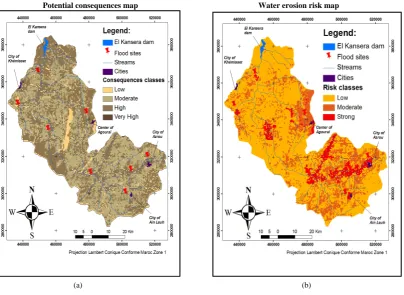
The analysis of socioeconomic studies shows that the local economy is mainly represented by the primary sector (farming and poly culture). The structural and functional damage map (CSF) is the result of a combination of damages due to land loss, siltation dam El Kansra that affect human activities. Thus, the potential damage map (Figure 9(a)) is obtained from survey results and helps to structure the erosion cost and to highlight the homo-geneous areas of vulnerability. The analysis of cumulative curves (number of pixels) has identified four conse-quences classes for the Oued Beht watershed.
- Low consequences (C1): minor damages to these lands are obsolete (1%) and hazard causes as much dam-age to human activities.
- Moderate consequences (C2): mild to serious damage to soils and to infrastructures witch are characterize half of the watershed (49%); mainly in the south watershed (upstream side) and partly downstream. More-over, disruption of socio-economic activities is also moderate.
- High consequence (C3): moderate to severe disturbances of human activities. Thus, strong and direct con-sequences are confined in space, but can be felt over the agricultural seasons, also they represents almost half of Oued Beht watershed. These consequences are partly located the watershed north (downstream) and mainly around the El Kansra dam but locally extending toward the centre and south.
Potential consequences map Water erosion risk map
[image:11.595.113.518.414.709.2]
(a) (b)
- Very High consequence (C4): the very strong damage is minimal and negligible (0.02%); this kind of ero-sion events would exceed the human capacity and prevention authorities concerned.
4.5. Risk Analysis
The risk map (Figure 9(b)), derived from a spatial combination of susceptibility and potential consequences classes, shows that high risk areas (R3) are developed on 6% of the territory. These sites identify the major risks and disruptions of human activities. The warning areas correspond to areas with high consequences (C3), lo-cated immediately upstream side and locally to the centre, presenting a very high to moderate susceptibility (S2, S3 and S4). Thus, measures appropriate precautions must be established (protected areas) and a Risk Prevention Plan (RPP) must be implemented.
Elsewhere, outside large spaces presenting a low risk (R1) on 72% of watershed, presenting the concept of acceptable risk, the risk level is moderate (R2) of 22% of the watershed (e.g. steep slopes but with the low to moderate consequences). This menace presents a moderate disruption to human activities and serious damage to infrastructure including dam El Kansra.
In conclusion, if improper resource management is implemented, the part of the Oued Beht watershed af-fected by moderate risk (22%) can be aggravated. Therefore, the potential risk can meet 28% of the watershed. Certainly, the development of management scenarios can complete this mapping study to improve the preven-tion of erosion risk in order to stop and reverse the degradapreven-tion trends of good lands and hydro-agricultural in-frastructures.
5. Discussion and Conclusion
This paper proposes the development of a methodology analysis for soil erosion hazard and risk administration, especially a very few studies are dedicated to the mapping of soil loss risks. The use of analytical models based on space technology information processing has developed a GIS database on biophysical and topoclimatic pa-rameters in Oued Beht watershed. Moreover, the procedure described evaluates the soil loss risk and El Kansra siltation dam located upstream side.
Indeed, the vulnerability and risk evaluation allowed the use of economic data to assess the expected damage cost. Therefore, the present approach is dynamic and flexible to modify the hierarchy of elements exposed ac-cording to their potential damage coefficients in order to highlight the management and protection measures for sites characterized by high erosion risk.
In addition, this research work demonstrates the potential of spatial analysis techniques to evaluate the erosion risks. An indicative mapping designed for the management and prevention risk is obtained, subject to control the source and quality of input and to characterize the conditions of validity of the models. Moreover, the difficul-ties encountered in the collection of quantitative damage data usually due to the lack of historical information, refer us to the idea that it would be necessary to create an observatory and full database related to erosion water damage.
These results indicate that the spatial analysis based on the objectivity of the calculation is efficient both for mapping susceptibility and production of erosion risk map. However, research is needed to introduce the tem-poral component (probability of erosion, return period) in a decision support perspective to implement a regional sustainable planning.
References
[1] High Commission for Water, Forest and Fight against Desertification HCEFLCD (1996) National Watershed Man- agement Plan (PNABV).
http://www.abhatoo.net.ma/content/download/28357/612736/version/1/file/Plan+National+d%E2%80%99Am%C3%A 9nagement+des+Bassins+Versants
[2] Aleotti, P. and Chowdhury, R. (1999) Landslide Hazard Assessment: Summary Review and New Perspectives. Bulletin of Engineering Geology and the Environment, 58, 21-44. http://dx.doi.org/10.1007/s100640050066
[3] High Commission for Planning HCP (2011) Moroccan Statistical Yearbook.
http://www.hcp.ma/downloads/Annuaires-statistiques-regionaux_t11956.html
[4] Water Basin Agency of Sebou (2011) Updating Integrated Water Resource Management Plan in the Sebou Watershed.
A&url=http%3A%2F%2Fwww.abhsebou.ma%2Fimages%2Factualite_event%2Frapport%2520PDAIRE.pdf&ei=CTa EVPHaFqT4yQOj3oGwAQ&usg=AFQjCNER_peG3QMmYy5D4SWGH3Ynoxjewg&bvm=bv.80642063,d.d2s
[5] Wischmeier, W.H. and Smith, D.D. (1965) Prediction Rainfall Erosion Losses from Cropland East of the Rocky Moun- tains: A Guide for Selection of Practices for Soil and Water Conservation. U.S. Department of Agriculture Handbook 282, Washington DC.
[6] Wischmeier W.H. and Smith D.D. (1978) Prediction Rainfall Erosion Losses, a Guide to Conservation Planning Sci-ence. U.S. Department of Agriculture Handbook 537, Washington DC, 60 p.
[7] PNUE (1998) Plan d’Action Prioritaire: Directives pour la cartographie et la mesure des processus d’érosion hydrique dans les zones méditerranéennes (PAP/CAR).
[8] Guillot, P. and Duband, D. (1968) La méthode du GRADEX pour le calcul de la probabilité des crues à partir des pluies, SHF, question 1, rapport 7, Paris.
[9] Francou, S. and Rodier, F. (1967) Essai de classification des crues maximales observées dans le monde. Cahiers de l’ORSTOM, 4, 19-46.
[10] Maquaire, O., Weber, C., Thiery, Y., Puisant, A., Malet, J.-P. and Wania, A. (2004) Current Practices and Assessment Tools of Landslide Vulnerability in Mountainous Basins. Identification of Exposed Elements with a Semi-Automatic Procedure. In Lacerda, W.A., Ehrlich, M., Fontoura, S.A.B. and Sayao, A.S.F., Eds., Proceedings of the 9th Interna-tional Symposium on Landslides, Rio de Janeiro, Brazil, Balkema Publishers, Rotterdam, 171-176.
[11] Ko Ko, C., Flentje, P. and Chowdhury, R. (2004) Landslides Qualitative Hazard and Risk Assessment Method and Its Reliability. Bulletin of Engineering Geology and Environment, 63, 149-165.
http://dx.doi.org/10.1007/s10064-004-0231-z
[12] Arnoldus, H. (1981) An Approximation of the Rainfall Factor in the USLE. In: et Gabriels, B., Ed., Assessment of Ero-sion, John Wiley, Hoboken, 127-132.
[13] Kalman, R. (1967) The Climatic Factor of Erosion in the Sebou Watershed Morocco. Sebou Project, 32 p.
http://infodoc.agroparistech.fr/index.php?lvl=author_see&id=50587
[14] Roose, E. (1977) Erosion et ruissellement en Afrique de l'Ouest. Vingt années de mesures en petites parcelles. ORSTOM Paris, Travaux et doc., No. 78, 105 p.
[15] Roose, E. (1988) Soil and Water Conservation Lessons from Steep Slopes Farming in French Speaking Countries of Africa. In: Moldenhauer, W.C. and Hudson, N.W., Eds., Conservation Farming on Steep Lands, Soil and Water Con-servation Society, Ankeny, 129-139.
[16] Heusch, B. (1969) L'érosion dans le bassin de Sebou Maroc: Une approche quantitative. Revue Géogr. Maroc, 15, 109-128.
[17] Roose, E. (1976) Use of the Universal Soil Loss Equation to Predict Erosion in West Africa. In: Soil Erosion: Predic-tion and Control, SCSA, Special PublicaPredic-tion No. 21, 60-74.