A Study of Safety Evaluation Method for Medical
Diagnostic Table
Xiaoyan Zhang, Jia Liu, Jun Guo, Lei Feng
MICT Engineering Department, GE Hangwei Health Care Co. Ltd., Beijing, China Email: [email protected]
Received May2013
ABSTRACT
Medical diagnostic tables are widely used in the medical diagnostic equipment. For multifarious diagnostic needs, the medical diagnostic table works in various operating modes. In order to ensure patient safety, safety factor of medical diagnostic table must meet safety requirement. The paper puts forward a method to find relations between key parame-ters and stress of table, identify maximum stress modes, reduce modes number of load test, and remove conservative high stress areas from finite element analysis result, by synthesizing the stress result of finite element analysis and measurement data for various operating modes of medical diagnostic table. It will help shorten test time, avoid over strength design, and reduce table’s cost. An application example of the method is presented by evaluating a specific CT medical diagnostic table. This method can be a reference for safety evaluation of all medical diagnostic tables.
Keywords: Medical Diagnostic; CT Table; Medical Equipment; Safety Factor; Stress
1. Introduction
Medical diagnostic tables are widely used in the medical diagnostic equipment. Usually there are CT scan table [1], MR table, X-ray table, PET table, surgery table and so on [2]. There are various supporting structure designs for medical diagnostic tables, such as scissor, actuator, pa- rallelogram structure, and so on.
Supporting parts will bear stress. IEC60601-1 third edition [3] and relative standards require the minimum safety factor of supporting parts should be more than 2.5.
When a medical diagnostic table is designed, finite element analysis is executed firstly for the supporting parts. Using the finite element analysis result, we can find high stress areas in the parts. Because of the com- plexity of boundary constrain and the arithmetic limita- tion of the finite element analysis method, some high stress areas found are conservative. Over design will happen, if the design only relies on the result of finite element analysis. Therefore actual strain or stress mea-surement in high stress area is necessary.
Based on the finite element analysis result, we can figure out the high stress points on each supporting part. By measuring and investigating regular pattern of stress for those high stress points, table maximum stress modes can be identified. Such findings will be instructive and provide guidance to the actual table loading test, which is used to evaluate table’s strength. It reduces modes num- ber for the actual loading test and cost.
This paper cites an example of test of a specific CT medical diagnostic table to make detail description of the safety evaluation method. This CT medical diagnostic table under study uses parallelogram structure. It pro- vides various operating modes, such as working on dif- ferent height and different cradle extension for patient application needs.
Investigation results show that load, table height and cradle extension length impact the stress of the support- ing parts. Two maximum stresses modes for all the sup- porting parts are found. One is maximum load, lowest patient loading table height and no cradle extension. The other is maximum load, lowest working height within the gantry bore and full cradle extension. Table’s load test should be executed on both modes.
2. CT Medical Diagnostic Table with
Parallelogram Structure
Figure 1. CT medical diagnostic table.
3. Various Operating Modes of CT Medical
Diagnostic Table
In order to cover various operating modes of the CT medical diagnostic table, several key parameters of table are determined. They are the lowest table height for pa- tient loading, the lowest table working height within the gantry bore for the patient scanning, the highest table working height within the gantry bore for the patient scanning, cradle not extended and cradle fully extended. Only when the table height is between the lowest and the highest working height, can cradle move in and out. For the specific CT medical diagnostic table, 525 mm is its lowest patient loading height, 780 mm is its lowest working height, 991 mm is its highest working height, 2045 mm is its maximum cradle extension length, and 306 kg is its maximum working load. Table 1 gives de- tailed description of the CT table’s 18 operating modes and 1 movement process.
4. Supporting Parts
When patient is loaded on the cradle, the table’s main supporting parts are bearing large forces, and are trans-ferring the forces from table top to bottom. The main supporting parts on a parallelogram structure table are Cradle, Channel Support, Front Leg, Rear Leg, Base, and Frame. Figure 2 shows the main supporting parts.
5. Strain Measurement Points
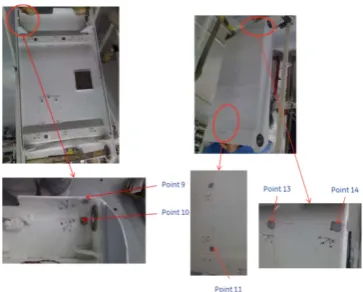
Strain gauges are attached to the high stress areas identi-fied from finite element analysis to get the actual stress data through measurement.
Figure 3 shows measurement points on Cradle.
Figure 4 shows measurement points on Channel Sup-port.
Figure 5 shows measurement points on Front Leg.
Figure 6 shows measurement points on Rear Leg.
Figure 7 shows measurement points on Base
Figure 8 shows measurement points on Frame.
6. Strain Gauges
Right angle strain array gauges are used to measure strain of high stress points on the supporting parts. The kind of strain array is shown on Figure 9 [4]. Each piece of
Cradle extension:0 mm
3 Table height: 780 mm. Load: 0 kg. Cradle extension: 2045 mm
4 Table height: 991 mm. Load: 0 kg. Cradle extension: 0 mm
5 Table height: 991 mm. Load: 0 kg. Cradle extension: 2045 mm
6 Table height: 991 mm. Load: 0 kg. Cradle extension: 1022.5 mm
7 Table height: 525 mm. Load: 153 kg. Cradle extension: 0 mm
8 Table height: 780 mm. Load: 153 kg. Cradle extension: 0 mm
9 Table height: 780 mm. Load: 153 kg. Cradle extension: 2045 mm
10 Table height: 991 mm. Load: 153 kg. Cradle extension: 0 mm
11 Table height: 991 mm. Load: 153 kg. Cradle extension: 2045 mm
12 Table height: 991 mm. Load: 153 kg. Cradle extension: 1022.5 mm
13 Table height: 525 mm. Load: 306 kg. Cradle extension: 0 mm
14 Table height: 780mm. Load: 306kg. Cradle extension:0mm
15 Table height: 780 mm. Load: 306 kg. Cradle extension: 2045 mm
16 Table height: 991 mm. Load: 306 kg. Cradle extension: 0 mm
17 Table height: 991 mm. Load: 306 kg. Cradle extension: 2045 mm
18 Table height: 991 mm. Load: 306 kg. Cradle extension: 1022.5 mm
1 Movement process
Table height: 991 mm. Load: 306 kg. Cradle extension: from 0 to 2045 mm
Figure 3. Measurement points on cradle.
[image:3.595.111.233.203.353.2]Figure 4. Measurement points on channel support.
Figure 5. Measurement points on front leg.
[image:3.595.348.496.292.443.2]Figure 6. Measurement points on rear leg.
Figure 7. Measurement points on base.
Figure 8. Measurement points on frame.
Figure 9. Right angle strain array gauge.
strain gauge array detects strain on direction 0˚, 45˚ and 90˚.
7. Test Procedures
7.1. Attach Strain Gauge
[image:3.595.82.259.377.548.2] [image:3.595.318.533.470.585.2] [image:3.595.81.263.573.719.2]for 18 table operating modes and 1 movement process as shown in Table 1.
8. Equivalent Stress at Measurement Point
Based on strain data
0
ε,
45
ε ,
90
ε measured by strain gauges, normal stresses σ σ1, 2 [4] are:
(
)
(
)
(
)
(
) (
)
0 90 1 2 20 45 45 90
+ = 2 1 2E + + 2 1 ε ε σ µ
ε ε ε ε
µ Ε − × − − + (1)
(
)
(
)
(
) (
) (
)
0 90 2 2 20 45 45 90
2 1
2E
2 1
E ε ε
σ
µ
ε ε ε ε
µ + = − − × − + − + (2) where 0
ε is the strain on 0˚ direction.
45
ε is the strain on 45˚ direction.
90
ε is the strain on 90˚ direction.
E is the elastic module of material.
μ is the Poisson’s ratio of material. Equivalent stress [6] at the point is:
(
) (
2) (
2)
21 2 2 3 3 1
2
v
σ σ σ σ σ σ
σ = − + − + − (3)
where σ3 is zero
Equivalent stress at any point can be calculated using Equations (1), (2) and (3).
9. Investigation of Stress on Supporting
Parts for 18 Table Operating Modes
9.1. Stress on Supporting Parts When Load Changes
• Figure 10 shows stress on Cradle when load is 0 kg, 153 kg, 306 kg for 18 table operating modes. The stress on Cradle is directly proportional to load. Maximum stress mode is mode 15 with table height 780 mm, load 306 kg, and Cradle extension 2045 mm.
• Figure 11 shows stress on Channel Support when load is 0 kg, 153 kg, 306 kg for 18 table operating modes. The stress on Channel Support is directly proportional to load. Maximum stress mode is mode 15.
Figure 10. Stress on cradle when load changes.
Figure 11. Stress on channel support when load changes.
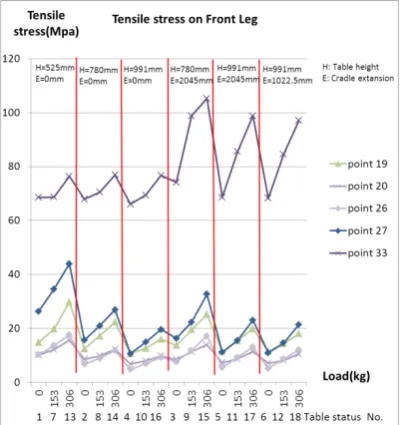
• Figure 12 shows stress on Front Leg when load is 0 kg, 153 kg, 306 kg for 18 table operating modes. The stress on Front Leg is directly proportional to load. Maximum stress modes are mode 13 and 15. Mode 13 is with Table height 525 mm, load 306 kg, and Cradle extension 0 mm.
• Figure 13 shows stress on Rear Leg when load is 0 kg, 153 kg, 306 kg for 18 table operating modes. The stress on Rear Leg is directly proportional to load. Maximum stress mode is mode 15.
• Figure 14 shows stress on Base when load is 0 kg, 153 kg, 306 kg for 18 table operating modes. The stress on Base is directly proportional to load. Maxi-mum stress modes are mode 13 and 15.
Figure 12. Stress on front leg when load changes.
Figure 13. Stress on rear leg when load changes.
9.2. Stress on Supporting Parts When Table Height Changes
Stress on Channel Support, Front Leg, Rear Leg, Base and Frame are analyzed when table height changes for 18 table operating modes. The stress is inversely propor- tional to table height. Maximum stress modes are mode 13, 15.Stress on cradle doesn’t relate to table height.
9.3. Stress on Supporting Parts When Cradle Extends
Figure 16 shows stress on measurement points of Cradle when Cradle extends from 0 mm to full extension 2045 mm. The stress is directly proportional to cradle exten-sion length. But stress is not sensitive to cradle extenexten-sion length when measurement points on cradle are extended
[image:5.595.71.275.331.515.2]Figure 14. Stress on base when load changes.
Figure 15. Stress on frame when load changes.
out of support roller.
Figure 17 shows stress on those measurement points of supporting parts, where stress is directly proportional to Cradle extension length when Cradle extends from 0 mm to full extension 2045 mm.
[image:5.595.324.524.442.602.2]Figure 16. Stress on cradle when cradle extends.
Figure 17. Stress at the points where stress is directly pro-portional to cradle extension length.
Figure 18. Stress at the point where stress is inversely pro-portional to cradle extension length.
10. Maximum Stress Modes Identification
[image:6.595.59.288.251.409.2]After investigating maximum stress of each individual supporting part for 18 table operating modes, it is identi- fied that there are 2 maximum stress modes to cover all supporting parts. One is mode 13 with lowest patient loading height 525 mm, no cradle extension, and maxi- mum load 306 kg. Another is mode 15 with lowest
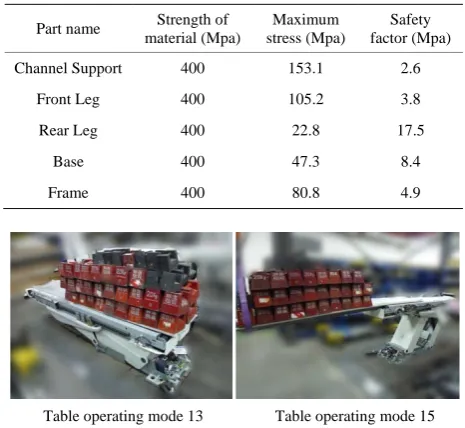
Table 2 shows safety factor of supporting parts on maxi- mum stress modes of the CT medical diagnostic table identified by using strain measurement method. It means that safety factor of supporting parts meet IEC require- ment of 2.5.
11.2. Load Test Method to Evaluate Safety Factor of Supporting Parts
[image:6.595.58.290.448.610.2]The method described in 11.1 is feasible to evaluate safety factor. Furthermore, based on the maximum stress modes identification result, we have developed another safety factor evaluation method. It is 4 times of maxi- mum working load test method. When 4 times of maxi- mum working load is put on Cradle on the maximum stress modes, if the supporting parts survive the test without any break, it means the safety factor of support- ing parts is higher than 2.5.
Figure 19 shows a load test example of the CT medi- cal diagnostic table on the 2 maximum stress modes 13 and 15 to evaluate its safety factor. After test is com- pleted, all supporting parts are checked, and no broken sign is found.
12. Conclusion
[image:6.595.306.539.507.721.2]By synthesizing stress results of finite element analysis
Table 2. Safety factor of supporting parts.
Part name Strength of material (Mpa)
Maximum stress (Mpa)
Safety factor (Mpa)
Channel Support 400 153.1 2.6
Front Leg 400 105.2 3.8
Rear Leg 400 22.8 17.5
Base 400 47.3 8.4
Frame 400 80.8 4.9
Table operating mode 13 Table operating mode 15
[image:6.595.308.538.507.720.2]and measurement data analysis for various operating modes of a CT medical diagnostic table, the maximum stress modes are identified. Stress on supporting parts is directly proportional to load, and inversely proportional to table height. Stress on almost all points of support parts is directly proportional to cradle extension length except several points. The CT medical diagnostic table is tested using the above mentioned test method with pass-ing result. By uspass-ing this method, after the maximum stress modes of medical diagnostic table with a specific kind of supporting structure design are identified, 4 times of maximum working load test on the maximum stress modes can evaluate its safety factor. Thus modes number of load test can be reduced, some conservative high stress areas from finite element analysis result can be removed. It will help shorten test time, avoid over strength design, and reduce table cost. This method can be a reference for safety evaluation of all medical diag- nostic tables.
REFERENCES
[1] J. Hsieh, “Computed Tomography Principle, Design, Artifacts and Recent Advances,” SPIE Press, Bellingham, 2009, pp. 179-205.
[2] Crotty and J. Dominic, “Patient Bed Design for an Inte- grated SPECT-CT Dedicated Mammotomography Sys- tem,” Nuclear Science Symposium Conference Record, Vol. 6, No. 3, 2003, pp. 3915-3919.
[3] International Electrotechnical Commission, “International standard IEC60601-1,” 3d Edition, Switzerland, 2005, pp. 291-293.
[4] H. W. Liu, “Mechanics of Materials,” People’s Education Press, Beijing, 1980, pp. 200-212.
[5] J. Dia and d.-p. Wang, “Sticking Technique of Strain Gauge in Electrometric Stress-test,” Journal of Hunan In- stitute of Engineering,Vol. 13, No. 3, 2003, pp. 55-57. [6] H. W. Liu, “Mechanics of Materials,” Higher Education