IJPSR (2016), Vol. 7, Issue 3 (Review Article)
Received on 09 September, 2015; received in revised form, 15 December, 2015; accepted, 05 February, 2016; published 01 March, 2016
SCIENCE AND RISK BASED APPROACH TO THE PROCESS VALIDATION – LINK FROM QUALITY BY DESIGN TO PROCESS VALIDATION.
Prasad Kanuri
Executive – CQA, Vasudha Pharma Chem Limited, Unit-II, Plot No:79, Jawaharlal Nehru Pharma City, Parawada, Visakhapatnam – 531019. India.
ABSTRACT: The approach to the process validation of pharmaceutical
manufacturing processes has been changed and the minimal approach (traditional) is no longer recommended 1-6. As the regulatory requirements are being changed, considering the patient safety and drug efficacy, an enhanced and science based approach is recommended for the process validation of medicinal product manufacturing processes. The major regulatory bodies like USFDA and EU has revised their approaches towards process validation and recommending industry to proceed with enhanced approach towards process validation. To reach the regulatory requirements regarding the process validation, tools like Quality risk management (ICH Q9), Pharmaceutical quality systems (ICH Q10) shall be useful. In-addition Quality by design is a new approach, which is a combination of several Quality system elements like Pharmaceutical development, Quality risk management, Pharmaceutical quality system which will leads to a life cycle approach to the process validation 7. This article will enable the readers to understand the science and risk approaches to the process validation, and usage of Quality by design concepts while developing a design space for the manufacturing process as recommended by ICH, FDA and EU.
INTRODUCTION: “Process Validation is the documented evidence that the process, operated within established parameters, can perform effectively and reproducibly to produce a medicinal product meeting its predetermined specifications and quality attributes” 9
. This article explains the current regulatory oversight towards performing a process validation in an enhanced manner not only for the drug products, but also for the drug substances.
QUICK RESPONSE CODE
DOI:
10.13040/IJPSR.0975-8232.7(3).914-29
Article can be accessed online on:
www.ijpsr.com
DOI link: http://dx.doi.org/10.13040/IJPSR.0975-8232.7 (3).914-29
FDA (food and drug administration) and EMA (European medicinal agency) are the major regulatory bodies which are taking care of public health through regulation and supervision of
pharmaceutical products. Hence the
recommendations made by these two regulatory bodies are considered while writing of this article. FDA is proposing a 3 stages process validation, where EMA is also recommended for the enhanced process validation which is similar to the FDA‟s 3 stages process validation. Different phases of these validations and the similarities between the FDA and the EU approached are described in this review article.
Considering simply three batches for the process
validation shall not confirm the process
consistency. To verify the process consistency and Keywords:
Process validation, Quality by Design, Process performance qualification
(PPQ), Process design.
Correspondence to Author: Prasad Kanuri
Executive - CQA, Vasudha Pharma Chem Limited, Unit-II, Plot No: 79, Jawaharlal Nehru Pharma City, Parawada, Visakhapatnam – 531019, India.
the product quality there should be a science and risk based rationale for the no. of batches to be selected for the process validation 6. Before going to the process validation, the product requirements should be well understood, and the process should be developed in line to the product requirements. After development of the process, the process should be well understood before going for the commercialization.
During the process development stage, the principles of Quality by design were very helpful in understanding the process. This article will explain the different principles of Quality by design with
examples for the easy understanding and
interpretation in the regular use.
As the day by day requirements of the medicinal product are being increased, cost of the product manufacturing is also getting amplified, for uninterrupted supply of the medicines to the patients; and to protect the manufacturers from the heightened manufacturing costs FDA is proposing a more freethinking guidance for the industry to develop and control medicinal products in the context of patient safety 8. Hence it is opportunity for the industry to understand the requirements of the regulatory bodies and to develop robust processes for the production of the quality medicines. As the robust process is basis for the drug manufacturing, every manufacturer should validate their manufacturing process, so that the alterations in the manufacturing process can be
minimized after submissions. Even after
submission of the drug master files(DMF) to the regulatory bodies, the manufacturers are requesting for the process changes because of the scaling issues and some quality issues. Hence the regulatory bodies are accepting a design space concept, where the changes within the design space need not considered as changes and need not to go for prior approval. With this design space the manufacturers can make desired changes within the design space without prior approval of the regulatory bodies.
Discussion:
As the requirements of the drug products are being increased day by day, the drug efficiency and safety are very important while developing a
pharmaceutical product. Hence at the time of
developing and validating of a drug
substance/product manufacturing process only the quality of the product should be controlled. In order to avoid the repetition of lengthy and costly tests, it is necessary to gather information during properly designed development and process optimization studies, when scaling up from laboratory through pilot to production scale. Such information provides the basis for justification that scale-up can be achieved without a consequent loss in quality 2. Quality cannot be assured by in-process and finished product testing. Quality, safety & efficacy of the drug substance/product should be designed into the product 4. Whatever the methods followed for process development and validation, the ultimate goal is to improve output, lower costs and ensure product quality. Process validation should not be viewed as a one-off event.
A lifecycle approach should be applied linking product and process development, validation of the
commercial manufacturing process and
maintenance of the process in a state of control during routine commercial production. Irrespective of whether a medicinal product is developed by a traditional approach or an enhanced approach, the manufacturing process should be validated before the product is placed on the market 10.
Process validation should focus on the control strategy, which primarily includes critical process
parameters, and other relevant studies
demonstrating that the process is capable of delivering the desired product quality. Process should be controlled to assure finished product meets all quality attributes including specifications, that means what are critical process parameters should be monitored, remaining should be in control. Variations in critical process parameters should be understood and plan should be developed to monitor these critical process parameters.
provided further in this article. The key focus should be on process variation, understand the variation, detect the possibilities of variations, respond to the observed variations and try to control these variations from input through output. To understand these variations, process should be well designed.
Both US & EU approaches of process validation recommends for use of the ICH quality elements
Pharmaceutical development (ICH Q8),
Pharmaceutical quality risk management (ICH Q9), Pharmaceutical quality system (ICH Q10) and Development and manufacture of Drug substance (ICH Q11). All the above stated quality elements are interrelated and each element refers to the other element while execution which will leads to a life cycle 13 management of the product.
Lifecycle management allows making changes in formulation and manufacturing processes during development and providing additional opportunities to gain added knowledge and it further supports establishment of the design space. Design space is planned by the applicant and will undergo regulatory assessment and approval. Working within the design space is not considered as a change. To develop design space, Quality by design principles was useful. In a QbD concept, the regulatory burden is less because there are wider ranges and limits based on product and process understanding 3. Changes within these ranges and limits do not require prior approval.
Design space and real time release risk assessment
15
are other parameters for implementation of QbD. International conference on harmonization in its Q8 pharmaceutical development, Q9 quality risk assessment and Q10 pharmaceutical quality system gives stringent requirements regarding quality of product.
FDA‟s view of QbD is “QbD is a systematic approach to product and process design and development”.
USFDA’s approach to the process validation: FDA first issued its process validation guideline in 1987 with an entitle “Guideline on general principles of process validation”. Since then the
same guidance is being followed by industry while proceeding for a process validation. But during all these years, the requirements of process validation and process understanding are being increased. Hence with this oversight FDA has revised its guidance on the process validation in the year 2011. This new guidance suggests us to use the risk management principles while developing & validating a process.
FDA is proposing a 3 stages process validation approach.
Stage-I: Process design: In this stage, commercial, proposed process should be defined based on the knowledge gained during process development and scale up activities. In this control strategy should be developed for the process control like which process parameters should be considered as critical and which of them should be monitored and controlled.
Stage-2: Process qualification: In this stage process design is evaluated to determine the
process capability and reproducibility of
commercial scale manufacturing. In this stage design of facility and qualification of utilities and equipments, and process performance qualification will be verified.
Stage-3: Continued process verification: In this stage of process validation and ongoing assurance shall be gained during routine production that the process remains in a state of control. An heightened monitoring of process should be done along with the routine monitoring.
Above said each stage is described clearly and interpreted for easy understanding in this article. But before going for stages of validation we need to understand the objective of a process validation. A successful validation program depends upon information and knowledge from product and
process development. This knowledge and
understanding is the basis for establishing of an approach to control of the manufacturing process, the results in products with desired quality attributes. Manufacturer should
Detect the presence and degree of variation
Understand the impact of variation on the process and ultimately on the product quality attributes
Control the variation in a manner
commensurate with the risk it represents to the process and product.
Focusing exclusively on qualification / validation efforts without understanding the manufacturing process and associated variations may not lead to adequate assurance of quality. Hence before proceeding for a process validation manufacturer should understand the manufacturing process and critical process parameters to meet the required quality attributes.
Process design: stage is intended for the defining of the commercial manufacturing process with the knowledge gained during the laboratory studies and scale up activities. It is not intended that the experiments conducted to design a process should be conducted under GMP conditions. But there should be a quality oversight while developing a process in the laboratory scale and the documents should be available with necessary tracing for the life cycle verification of the process design and should be preserved for the product life cycle. As the lab developed process is the basis for the commercial manufacturing process, during the development stage only it should be considered for the variations that may occur due to commercial manufacturing equipment, in case of different lots the variation in the product homogeneity, operators execution variations, environmental conditions and variation in measuring instruments all these should be considered in the process design stage only.
To obtain sufficient knowledge and control over the process, design of experiments can be used with the risk analysis tools (as mentioned in the ICH Q9) to understand the critical process parameters, in-process material controls, intermediate controls and finished product quality. Based on the
knowledge gained during the design of
experiments, the final process with critical process parameters and critical quality attributes shall be
defined. FDA does not expect manufacturers to develop and test the process until it fails.
This stage of FDA‟s process validation can be achieved by following the principles laid down in Quality by design. The detailed stages of quality by design were described further in this articles which is helpful in understanding the product and process requirements.
Process qualification: during this stage, the process developed during the process design stage
shall be evaluated for its capability in
manufacturing the required product with specified quality attributes in commercial scale. During this stage, the principles of cGMP should be followed. This stage has two elements,
1. Design of facility and qualification of equipment and utilities and
2. Process performance qualification (PPQ).
Design of facility and qualification of equipments and utilities:
This phase of process qualification definitely precedes the process performance qualification. Qualification refers to activities undertaken to demonstrate that utilities and equipments are suitable for their intended use and perform properly. Qualification of utilities and equipments can be performed under a single plan or separate plan, but the qualification should ensure that intended usage. During the qualification risk management principles can be used. Changes to the qualified state of the equipments should be considered in the qualification protocol. The qualification of utilities and equipments is in the different stages like DQ, IQ, and OQ.
Design qualification includes the selection of utilities and equipment construction materials,
operating principles, and performance
characteristics based on whether appropriate for their specific uses.
Installation qualification includes verifying that utility systems and equipments are built and
installed in compliance with the design
Operation qualification includes verifying that utility systems and equipments operate in accordance with the process requirements in all
anticipated conditions. This should include
challenging the equipment or system functions while under load comparable to that expected during routine production. Qualification of utilities and equipment can be covered under individual plans or as part of an overall project plan. The qualification plan should be risk based and should identify:
1. Studies, tests and criteria to assess outcomes
2. Responsibilities of departments
3. Procedures for documenting and approving
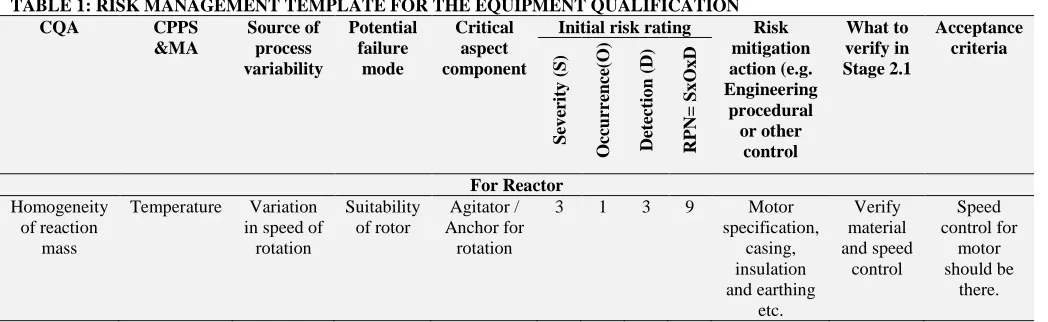
[image:5.612.43.567.262.423.2]The quality unit must review and approve the plan and report. The scope of qualification should include Equipments, services, automated controls, CPPS, materials impact, PAT tools etc. An example of risk template is provided below considering the impact of equipment design on critical quality attributes.
TABLE 1: RISK MANAGEMENT TEMPLATE FOR THE EQUIPMENT QUALIFICATION
CQA CPPS
&MA Source of process variability Potential failure mode Critical aspect component
Initial risk rating Risk
mitigation action (e.g. Engineering procedural or other control What to verify in Stage 2.1 Acceptance criteria S ev er ity (S ) O cc u rr en ce (O ) De te ctio n (D) RPN= S x O x D For Reactor Homogeneity of reaction mass
Temperature Variation in speed of
rotation Suitability of rotor Agitator / Anchor for rotation
3 1 3 9 Motor specification, casing, insulation and earthing etc. Verify material and speed control Speed control for motor should be there.
Process performance qualification:
This phase of process qualification will combine the Stage-I and first element of stage-2. This stage is nothing but the verification of the process developed under the process design stage in commercial scale. The PPQ combines the actual facility, utilities, equipment (each now qualified), and the trained personnel with the commercial manufacturing process, control procedures, and components to produce commercial batches.
In general the batches manufactured in this stage should be released to market after completion of the validation. But considering a benefit of risk or other scientific justification the PPQ batches can be concurrently released to the market. Before releasing to the market there should be a sound scientific justification which can be gained from the laboratory studies (design of experiments, laboratory trials, and scale up activities).
In most cases, PPQ will have a higher level of sampling, additional testing, and greater scrutiny of
process performance than would be typical of routine commercial production. The level of monitoring and testing should be sufficient to confirm uniform product quality throughout the batch. However, it is not typically necessary to explore the entire operating range at commercial scale if assurance can be provided by process design data. Previous credible experience with sufficiently similar products and processes can also be helpful. In addition FDA strongly recommends the firms to employ objective measures (e.g. statistical metrics) to achieve adequate assurance on manufacturing process.
There should be written protocol for this stage describing the manufacturing conditions, Critical process parameters, in-process controls, sampling plans, tests to be performed, acceptance criteria and statistical methods required to compile the data, Equipment qualification details, provision for
recording deviations, personnel training,
should be duly approved by the competent personnel and quality units. Once the validation is completed a report should be prepared containing all the information mentioned in the protocol and the results obtained during the execution of the validation should be analyzed with respective statistical tools. Discussion about any process deviation and delays should be reported. A conclusion should be made with recommendations further. Validation report also should be duly approved by quality unit.
Selecting no. of PPQ batches is the critical aspect of the Process performance qualification. The no. of PPQ batches considering during the validation should be based on the residual risk, which was identified at the end of stage-I. The no. of PPQ
batches should reflect the confidence in
commercial process performance; this can be
achieved by product knowledge, process
understanding and defined control strategy which were developed during the process design stage. For determining the no. of PPQ batches, here is a small flow indicated for easy understanding.
[image:6.612.309.569.348.462.2]
FIG.1: RESIDUAL RISK ASSESSMENT FOR
DETERMINING THE NO. OF PPQ BATCHES
Product Knowledge should be gained from the FDA stage-I process validation, or previous similar products history also can be used. During this stage what could impact the CQAs of the product during processing (Critical process parameters) should be understood and allowable acceptance ranges for the CQAs should be defined.
Process Understanding, this also part of the stage-I process validation (Where QbD is helpful), process
can be well understood during the development activities and prior knowledge from similar product types. Assess the process variability during the scaling activities.
Effectiveness of control strategy, Variability that may impact the product during the commercial manufacturing, e.g. Critical equipment operations, Material attributes, sampling and testing etc.
Residual risk, estimate the residual risk of the process by using the above process knowledge, product understanding 5 and control strategy. For each CQA categorize risk levels of each risk factor e.g. Impact of variation on patient safety & efficacy. Calculate Risk probability number (RPN) for each factor. Based on the RPN propose no. of PPQ batches. The residual risk can be classified as below. Residual risk level is nothing but confidence in commercial process performance.
TABLE 2: CLASSIFICATION OF RESIDUAL RISK RATING
Residual risk Basis
Severe (5) Multiple factors have high risk rating High (4) All factors have medium risk rating or few
factors have high risk rating Moderate (3) Medium risk level for multiple factors or
high risk level for one factor. Low (2) Few factors have medium risk rating and the
rest are low
Minimum (1) All factors have low risk rating
There are different approaches to determine the no. of batches, these are
1. Rationale and experience
2. Target process confidence and process
capability
3. Expected coverage
Rationale and experience:
This approach is based on assumption that, for low risk process, the preparation of three consecutive batches is appropriate. In other words, successfully preparing three batches can provide an acceptable degree of assurance to show reproducibility for low-risk processes, as has been shown by historic success of using this number of batches for many
validation studies. Using a rationale-based
[image:6.612.48.299.402.597.2]historical success with low risk process and acknowledgements that increased residual risk should be accompanies by an increased number of
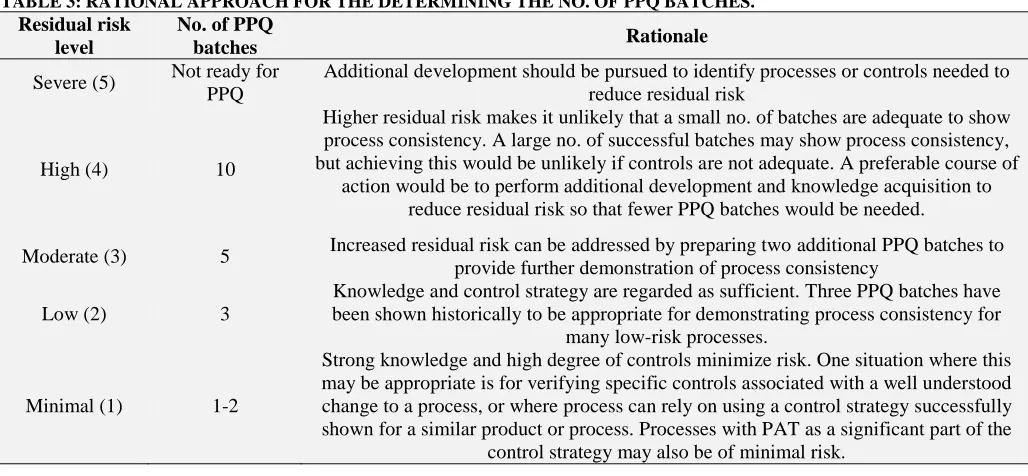
[image:7.612.48.562.111.349.2]PPQ batches. An illustrative examples shown below.
TABLE 3: RATIONAL APPROACH FOR THE DETERMINING THE NO. OF PPQ BATCHES.
Residual risk level
No. of PPQ
batches Rationale
Severe (5) Not ready for PPQ
Additional development should be pursued to identify processes or controls needed to reduce residual risk
High (4) 10
Higher residual risk makes it unlikely that a small no. of batches are adequate to show process consistency. A large no. of successful batches may show process consistency, but achieving this would be unlikely if controls are not adequate. A preferable course of
action would be to perform additional development and knowledge acquisition to reduce residual risk so that fewer PPQ batches would be needed.
Moderate (3) 5 Increased residual risk can be addressed by preparing two additional PPQ batches to provide further demonstration of process consistency
Low (2) 3
Knowledge and control strategy are regarded as sufficient. Three PPQ batches have been shown historically to be appropriate for demonstrating process consistency for
many low-risk processes.
Minimal (1) 1-2
Strong knowledge and high degree of controls minimize risk. One situation where this may be appropriate is for verifying specific controls associated with a well understood change to a process, or where process can rely on using a control strategy successfully shown for a similar product or process. Processes with PAT as a significant part of the
control strategy may also be of minimal risk.
Target process confidence and process capability: The FDA guidance states that “Before any batch from the process is commercially distributed for use by consumers, a manufacturer should have gained a high degree of assurance in the performance of the manufacturing process such that it will consistently produce APIs and drug products meeting those attributes relating to identity, strength, quality, purity and potency”. This statement poses two questions:
1. What is an objective measure that the process will consistently produce product that meets its requirements?
2. What is acceptable high degree of
assurance?
These two questions are termed as target process performance (question 1) and target process confidence (question 2).
Target process performance:
Statistically one measure of process robustness that can be used to assess the ability or capability of the process to meet the required quality requirements is process capability (CpK). Demonstration of a CpK of 1.0 as a starting point for assessing the capability
of a process undergoing validation seems reasonable. However the level of confidence in this assessment should be commensurate with the risk
associated with the level of knowledge,
understanding and robustness of the control strategy. Where the risk of process failure has been established as low, an estimated process capability of CpK ≥ 1.0 with 90% confidence does not seem to be unreasonable based on the limited experience and data available at commercial product launch.
Target process confidence:
Therefore if we can accept the premise that depending on the product and process risk it may be acceptable to begin commercial distribution prior to reaching an extremely high confidence level such as 99%, then what is the trigger that allows us to say that stage 2 PPQ activities been successfully completed.
While any confidence level selected is somewhat arbitrary, it seems reasonable that at least a 90%
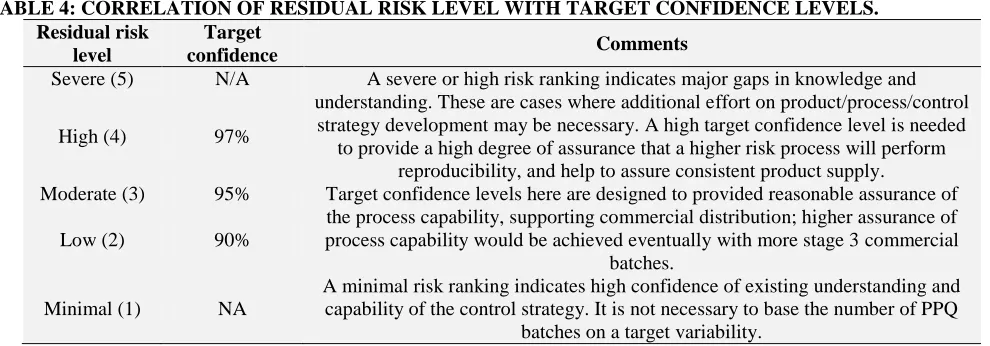
[image:8.612.55.550.206.379.2]confidence in the capability of the process to meet the quality standards considers both patient risk and process robustness. At the same, within batch process capability data and enhanced sampling required for the stage 2 PPQ batches will help to ensure appropriate quality to support commercial product release. Below table is an example of how target confidence levels can be determined based on the risk assessment.
TABLE 4: CORRELATION OF RESIDUAL RISK LEVEL WITH TARGET CONFIDENCE LEVELS. Residual risk
level
Target
confidence Comments
Severe (5) N/A A severe or high risk ranking indicates major gaps in knowledge and understanding. These are cases where additional effort on product/process/control
strategy development may be necessary. A high target confidence level is needed to provide a high degree of assurance that a higher risk process will perform
reproducibility, and help to assure consistent product supply. High (4) 97%
Moderate (3) 95% Target confidence levels here are designed to provided reasonable assurance of the process capability, supporting commercial distribution; higher assurance of process capability would be achieved eventually with more stage 3 commercial
batches. Low (2) 90%
Minimal (1) NA
A minimal risk ranking indicates high confidence of existing understanding and capability of the control strategy. It is not necessary to base the number of PPQ
batches on a target variability.
Based on the correlation, A statistical method based on confidence intervals for CpK provides a justifiable no. of batches utilizing the readily pas criteria, the target process performance and the target process confidence. Assuming the readily
[image:8.612.45.569.477.579.2]pass criteria of greater than or equal to 1.6, below table indicates the minimum no. of batches required to assure that we are confident that readily passing processes are capable.
TABLE 5: MINIMUM NO. OF PPQ BATCHES NEEDED IF THE READILY PASS CpK IS 1.6
Residual risk level
Minimum no. of batches
Target process confidence for
CpK 1.0
Acceptance criteria Readily pass
calculated CpK
Marginally pass calculated CpK
Fail calculated CpK
Severe (5) Not ready for PPQ NA
High (4) 14 97
≥1.6 1.6>CpK≥1.0 < 1.0
Moderate (3) 11 95
Low (2) 7 90
Minimal (1) 1-3 NA
From the above example, if a product and process has been determined to be of moderate residual risk at the end of stage 1, and if the data from at least 11 batches calculates to a CpK of at least 1.6, then there is at least 95% confidence that the CpK is at least 1.0. However if the calculated CpK is greater than or equal to 1.0 but less than 1.6 there is still potential that the process has acceptable capability, but the data provided less than 95% confidence that the true CpK is at least 1.0. Finally if the CpK is less than 1.0, then there is less than 50%
confidence that the true CpK is at least 1.0. In this case process improvement should be considered before proceeding.
Expected Coverage:
increases as well. A low residual risk process does not require high degree of assurance from the PPQ batches alone, while with high risk process after stage-I lifecycle would demand high assurance from the PPQ batches. While there is some arbitrariness to any choices of the expected coverage, a high expected coverage for a severe high risk ranking process provides some degree of assurance. Another statistical approach of Narrow limit gauging can be used, where the existing specification is tightened to 50%, and the no. of batches within the tightened specification and no. of batches outside the tightened specification but within the original specification will assessed by means of graphical charts, and based on that the no. of PPQ batches will be decided.
Use of statistical tools for the assessment of Process validation effectiveness:
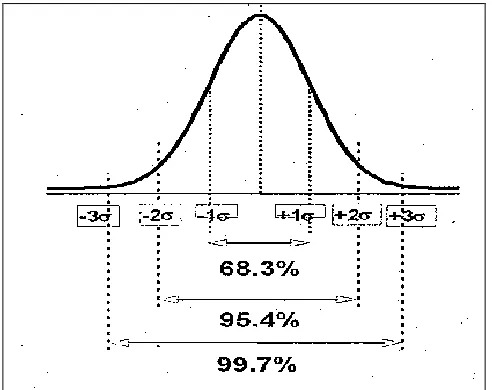
[image:9.612.315.564.177.361.2]FDA recommend that a statistician or person with adequate training in statistical process control techniques develop the data collection plan and statistical methods and procedures used in measuring and evaluating process stability and process capability. As described in the above determination of PPQ batches, there is a requirement to use effective statistical tools to understand the process control. Calculate the sigma (σ) ranges for the given process and interpret the observed results in the given sigma ranges using distribution curves will give knowledge on process capability and based on that actions can be taken to meet the desired state 1. A sample sigma distribution curve shown below.
FIG.2: SAMPLE DISTRIBUTION CURVE
The above distribution curve tells us about the distribution of observed results within the different sigma ranges. Applying control charts (Fig.3) for the observed results and determine the alert and action limits for the given process will give more clarity on the process capability and preferred actions to be taken.
FIG.3: CONTROL CHART INDICATING ACTION AND ALERT LIMITS
Use of statistical tools like process capability (Cp), process index variation (CpK) and Sigma ranges for the observed results be preferred for the statistical process control. Based on the Cp and CpK values the process capability can be predicted where more degree of assurance can be gained on the process to meet the requirements. CpK = Cp when process is centered and CpK < Cp then process is not centered. With calculation of Cp and CpK, the process variation can be understood. There will be two types of process variations, viz., Random variations (e.g Raw material variability) and special cause variations (e.g. Change in raw material supplier). Based on the understanding of the process variability, using the distribution curves, the state of the process can be defined. An interpretation shown in the below figure (Fig. 4).
[image:9.612.51.297.536.731.2]FIG.4: UNDERSTANDING OF CAPABLE, MARGINAL AND INCAPABLE PROCESSES USING DISTRIBUTION CURVES.
Continued process verification, the objective this stage is to continual assurance that the process remains in a state of control during the routine commercial production. A system for detecting unplanned departures from the process as designed in essential to reach the goal of this stage. Adherence to the CGMP requirements, specifically, the collection and evaluation of information and data about the performance of the process, will allow detection of undesired process variability.
As recommended by FDA there should be a statistician or person with adequate training to evaluate the data collected during the routine manufacturing. There should be defined procedures for how to evaluate and what data should be collected to identify the process capability and variation. Variation can also be detected by continual and timely assessment of the complaints, out of specifications, process deviation reports, yield variations and batch records.
FDA strongly recommends that the personnel from the Quality assurance should regularly meet the production personnel and should have close monitoring on the process activities, discuss with the production people to understand the potential variations. Data gathered during this stage will help in ways to optimize the process by altering some aspects of product or process. A description of the planned change, a well-justified rationale for the change, an implementation plan, and quality unit
approval before implementation must be
documented. Depending on how the proposed change might affect product quality, additional process design and process qualification activities could be warranted.
Maintenance of the facility, utilities, and equipment is another important aspect of ensuring that a process remains in control. The equipment and facility qualification data should be assessed periodically to determine whether re-qualification should be performed and the extent of that re-qualification.
These 3 stages of process validation are linked and interrelated as shown in below diagram (Fig.1)
FIG.5: FDA THREE STAGE PROCESS VALIDATION
EU Approach on process validation:
In addition to the existing validation guidance (Guidance on process validation), EU has revised its existing Annex-15 Qualification and validation which is effective from the 1st October 2015. This guideline laid downs some additional principles to
Stage-I
Process design
Stage-2
Process qualification
Design of facility & Qualification of
utilities and equipments
Process performance qualification
Stage-III
Continued process verification
Confirmation
Ch
an
g
es
Commercialize
Ch
an
g
es
the process validation without interfering the principles laid down in the current EU regulatory guidance. As per this Annex-15 “It is a GMP requirement that manufacturers control the critical aspects of their particular operations through qualification and validation over the life cycle of the product and process. Any planned changes to the facilities, equipment, utilities and processes, which may affect the quality of the product, should be formally documented and the impact on the validated status or control strategy assessed. The relevant concepts and guidance presented in ICH Q8, Q9, Q10 and Q11 should also be taken into account.”
A quality risk management approach should be applied throughout the lifecycle of a medicinal product. As part of a quality risk management system, decisions on the scope and extent of qualification and validation should be based on a justified and documented risk assessment of the facilities, equipment, utilities and processes. Based on the guidance provided by EU, Qualification of utilities, equipments and facilities are an integral part of validation. In addition the validation planning, validation master plan should be there before going for a validation, which should describe the inter-relation between documents in complex validation projects should be clearly defined.
For large and complex projects, planning takes on added importance and separate validation plans may enhance clarity on Qualification and validation. User requirement specification (URS),
Design qualification (DQ), Factory acceptance test (FAT)/Site acceptance test (SAT), Installation qualification (IQ), Operational qualification (OQ) and Performance qualification (PQ)are different phases of Qualification. There should be a system to re-evaluate the effective functioning of the equipment, facility and utility systems periodically. As per the EU Annex-15, A traditional approach can be accepted but science and risk based (continuous process verification) approach is encouraged for the better control over the manufacturing process. Process validation should establish whether all quality attributes and process parameters, which are considered important for ensuring the validated state and acceptable product quality, can be consistently met by the process. The basis by which process parameters and quality attributes were identified as being critical or non-critical should be clearly documented taking account the results of risk assessment activities. There are 3 approaches to the process validation 1) Traditional approach 2) Continuous process verification 3) Hybrid. After completion of process validation ongoing process verification should be done whatever the approach for the process validation.
Comparison of US & EU approach towards process validation:
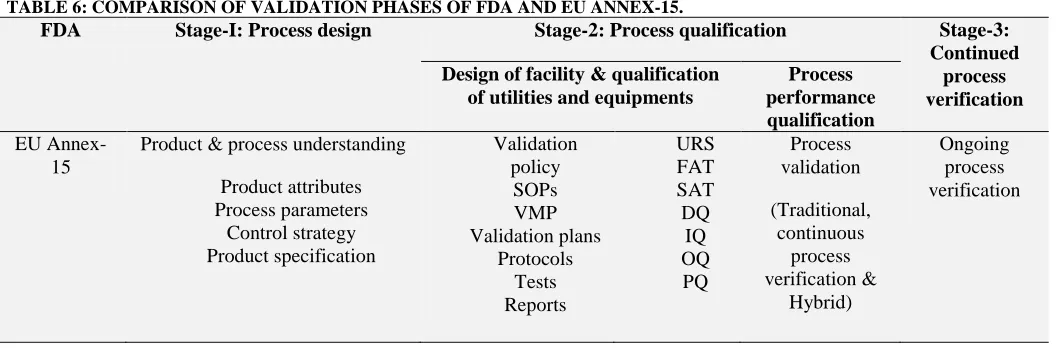
[image:11.612.45.573.551.725.2]All these phases of Qualification and validation mentioned in the EU annex-15 are somewhat comparable to the 3 phase process validation of USFDA. These similarities are depicted in the below table (Table 1).
TABLE 6: COMPARISON OF VALIDATION PHASES OF FDA AND EU ANNEX-15.
FDA Stage-I: Process design Stage-2: Process qualification Stage-3:
Continued process verification Design of facility & qualification
of utilities and equipments
Process performance qualification
EU Annex-15
Product & process understanding
Product attributes Process parameters
Control strategy Product specification
Validation policy
SOPs VMP Validation plans
Protocols Tests Reports
URS FAT SAT DQ
IQ OQ PQ
Process validation
(Traditional, continuous
process verification &
Hybrid)
Even though there are similarities between the FDA and EU approach towards process validation, there are some differences in the both approaches
like definition of process validation. The
differences of these approaches are given below.
FDA’s definition of process validation:
The collection and evaluation of data, from the
process design stage through commercial
production, which establishes scientific evidence
that a process is capable of consistently delivering quality product.
EU definition of process validation:
[image:12.612.55.552.206.355.2]The documented evidence that the process, operated within established parameters can perform effectively and reproducibly to produce a medical product meeting its predetermined specification and quality attributes.
TABLE 7: DIFFERENCE/COMPARISON BETWEEN FDA AND EU PROCESS VALIDATION PHASES.
FDA EU Annex-15
Stage 1
Process design:
Process understanding and strategy for process control
Establishment of CQAs, CPP and control strategy using the ICH Q8, Q9, Q10 & Q11.
Stage 2 2.1
2.2
Equipment/Utility Qualification
Process performance qualification (PPQ) (To confirm stage-1) (No. of validation batches to be
justified)
URS, QD, FAT, SAT, IQ, OQ & PQ
Traditional (or) Continuous (or)
Hybrid
(Traditional min 3 batches) Stage 3 Continuous process verification (CPV) Ongoing process verification
Link from QbD to process validation:
Quality by design is defined as a systematic approach to development that begins with predefined objectives and emphasizes product and process understanding and process control, based on sound science and quality risk management. The main objective of QbD is to understand the product and process control with the means of effective tools like Pharmaceutical development (Q8 &
Q11), Quality risk management (Q9),
Pharmaceutical quality system (Q10) by which the
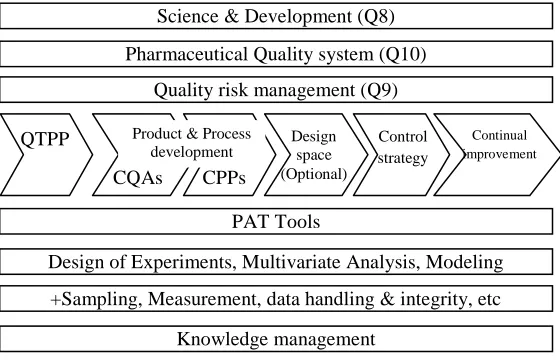
[image:12.612.181.461.541.721.2]medicinal product can be manufactured in a state of control to produce the consistent quality of product. To follow the QbD, first we need to work on the product and process understanding. Simply the QbD can be as similar as FDA stage-I. For the preparation of process design the principles of QbD are very much helpful. The principles laid down in the ICH Q8, Q9, Q10 & Q11 should be considered throughout the development of the process design i.e. establishing a commercial manufacturing process. The simple QbD flow can be as below[14].
FIG.6: A SIMPLE FLOW OF QbD Science & Development (Q8)
QTPP
Pharmaceutical Quality system (Q10)
Quality risk management (Q9)
CQAs CPPs
Design space (Optional)
Control strategy
Continual improvement
Product & Process development
PAT Tools
Design of Experiments, Multivariate Analysis, Modeling
+Sampling, Measurement, data handling & integrity, etc
Knowledge management
Quality target product profile is the basis of design for the development of product. The QTPP should include intended dosage form, dosage strength, route of administration, Container closure system, other physical and chemical attributes which impact the drug release (like dissolution) and other quality and purity requirements of the drug product11. QTPP can be simply said as the desired product quality specification, it may be either in-house or pharmacopeial.
Critical Quality Attributes are the physical, chemical, biological or microbiological property or characteristic that should be within an appropriate limit, range or distribution to ensure the desired product quality. The CQAs of drug product or drug substance are direct indicatives for process consistency and based on the CQAs variability the product quality might effect and process outputs might varied. CQAs can be quantitative or qualitative. (Ex: purity, potency, particle size and physical form). Based on the required product QTPP, the CQAs that need to be controlled during the process should be defined. The well defined CQAs will leads to enriched output of the process. If consider an API process, the CQAs can be defined as below.
During Reaction of intermediates, the
purity, appearance, impurities can be controlled.
During the crystallization of API Ash
content or Residue on ignition, impurities can be controlled.
During the centrifugation or filtration Ash content or Residue on ignition, impurities can be controlled.
During the drying water content, residual solvents can be controlled.
During the milling particle size and bulk density of the material can be controlled.
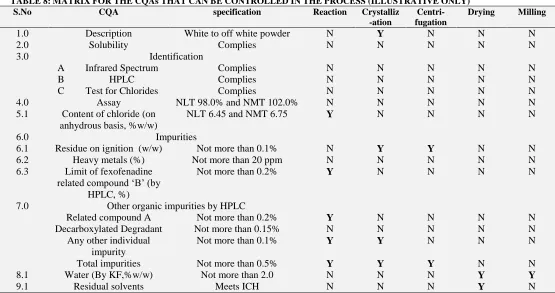
[image:13.612.38.593.457.750.2]The above said process is just illustrative, but for some products it may vary for CQAs, but we should understand at what stage of the process our desired QTPP can be controlled and we should develop an in-process check if required for that specific CQA. Based on the product physical and chemical properties, if we consider below matrix with CQAs, the process impact on the required QTPP can be controlled in the different stages of processing.
TABLE 8: MATRIX FOR THE CQAs THAT CAN BE CONTROLLED IN THE PROCESS (ILLUSTRATIVE ONLY)
S.No CQA specification Reaction Crystalliz
-ation
Centri- fugation
Drying Milling
1.0 Description White to off white powder N Y N N N
2.0 Solubility Complies N N N N N
3.0 Identification
A Infrared Spectrum Complies N N N N N
B HPLC Complies N N N N N
C Test for Chlorides Complies N N N N N
4.0 Assay NLT 98.0% and NMT 102.0% N N N N N
5.1 Content of chloride (on anhydrous basis, %w/w)
NLT 6.45 and NMT 6.75 Y N N N N
6.0 Impurities
6.1 Residue on ignition (w/w) Not more than 0.1% N Y Y N N
6.2 Heavy metals (%) Not more than 20 ppm N N N N N
6.3 Limit of fexofenadine related compound „B‟ (by
HPLC, %)
Not more than 0.2% Y N N N N
7.0 Other organic impurities by HPLC
Related compound A Not more than 0.2% Y N N N N
Decarboxylated Degradant Not more than 0.15% N N N N N
Any other individual impurity
Not more than 0.1% Y Y N N N
Total impurities Not more than 0.5% Y Y Y N N
8.1 Water (By KF,%w/w) Not more than 2.0 N N N Y Y
Critical process parameters are process parameters whose variability has an impact on a critical quality attribute and therefore should be monitored or controlled to ensure the process produce the desired quality. CPPs are having direct impact on the CQAs. In addition to the CPPs, Material attributes are also having direct impact on the material CQAs. Material attributes(MA) is the input material quality, i.e. change in the quality of the input material will be having some impact on the CQAs. A simple relation between the CQAs, CPPs and MAs is shown below.
FIG.7: AN ILLUSTRATIVE EXAMPLE OF CPPs, MAs AND CQAs RELATION
To determine the impact of CPPs and MAs on the CQAs different tools like PAT, Design of experiments, multivariate analysis can be used. These experiments can be conducted in lab scale, based on the results obtained during the design of experiments study/multivariate analysis prepare a risk matrix and update and whenever required.
Design space can be defined as the multidimensional combination and interaction of input variables and process parameters that have been demonstrated to provide assured quality. Changes within the design space not required prior approval. The development of design space needs an excessive study on the critical process parameters and respective critical quality attributes. One can develop design space in lab scale, but its subsequent application in the commercial scale should be demonstrated. Here one example
furnished for the simple design space
demonstration.
The design space for a drying operation that is dependent upon the path of temperature and/or pressure over time. The end point for moisture content is 1-2%. Operating above the upper limit
of the design space can cause excessive impurity formation, while operating below the lower limit of the design space can result in excessive particle attrition. (Reference from ICH Q8)
Where in the above example drying temperature is the critical process parameter, and impurity, and particle attrition are the critical quality attributes, and Moisture content is the required product quality specification. Because of variation in the drying time and initial moisture content of the product, there is a direct impact on the product CQAs even though the final MC complies. But meeting the MC limit is not only criteria, but the other CQAs shouldn‟t be affected with the process variations.
Hence as shown in the above graph it should be understood that working with in the design space will not affect the product quality. For example if the initial MC of the material is about 30%, it can be dried for a period of ~10 to 12 Hrs. Where if the initial MC is ~ 22%, a period of 6 to 8 hours drying is suffice. With this graph we can understand that for the given material with the initial MC range of ~23 – 32%, an expended drying period of 6 to 12 Hrs can be applied. Hence with the defined design space the process parameters can be relaxed whenever required without considering it as a change. Working outside the design space might lead to some irregular product quality as shown in the above graph.
For a simple development of a design space below is the strategy.
1. Select the process parameters which are likely to have impact on the product quality
0% 5% 10% 15% 20% 25% 30% 35%
0 2 4 6 8 10 12
time (hr)
M
o
is
tu
re
C
o
n
te
n
t
Design space lower limit Design space
upper limit
Excessive impurity formation
Excessive particle attrition Endpoint
criterion {
(From the above example initial MC and drying temperature are likely to have impact on the product quality).
2. Set each parameter to a fixed value and measure the results.
3. Keep one parameter to the fixed value and change other parameters and measure the results.
4. Now keep varying the both parameters and monitor the results of the product quality.
5. Every time measure the CQAs and adjust parameters to ensure the CQAs meets the specification.
Control strategy: is a planned set of controls, derived from current product and process understanding that assures process performance and product quality. The controls can include parameters and attributes related to drug substance and drug product materials and components, facility and equipment operating conditions, in-process controls, finished product specifications, and the associated methods and frequency of
monitoring and control (ICH Q10). The
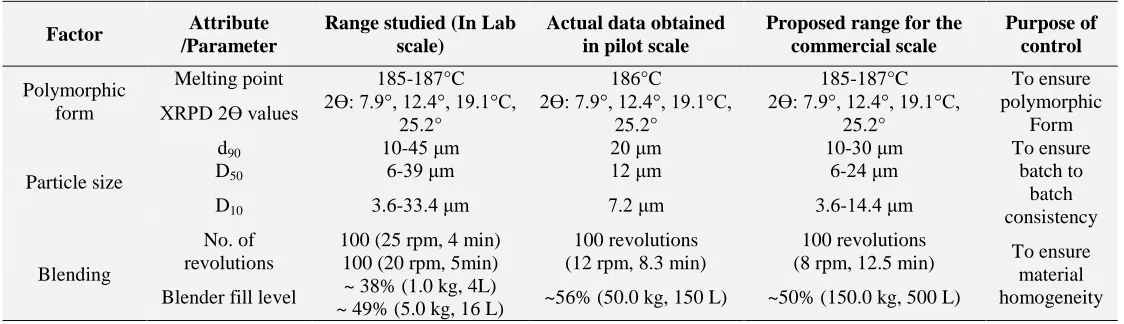
[image:15.612.26.588.315.477.2]identification and linkage of the CQAs and CPPs should be considered when designing the control strategy. A well-developed control strategy will reduce risk but does not change the criticality of attributes. An illustrative example of control strategy is provided below.
TABLE 9: AN ILLUSTRATIVE EXAMPLE FOR CONTROL STRATEGY DEVELOPMENT
Factor Attribute
/Parameter
Range studied (In Lab scale)
Actual data obtained in pilot scale
Proposed range for the commercial scale
Purpose of control
Polymorphic form
Melting point 185-187°C 186°C 185-187°C To ensure
polymorphic Form XRPD 2Ɵ values 2Ɵ: 7.9°, 12.4°, 19.1°C,
25.2°
2Ɵ: 7.9°, 12.4°, 19.1°C, 25.2°
2Ɵ: 7.9°, 12.4°, 19.1°C, 25.2°
Particle size
d90 10-45 μm 20 μm 10-30 μm To ensure
batch to batch consistency
D50 6-39 μm 12 μm 6-24 μm
D10 3.6-33.4 μm 7.2 μm 3.6-14.4 μm
Blending
No. of revolutions
100 (25 rpm, 4 min) 100 (20 rpm, 5min)
100 revolutions (12 rpm, 8.3 min)
100 revolutions
(8 rpm, 12.5 min) To ensure material homogeneity Blender fill level ~ 38% (1.0 kg, 4L)
~ 49% (5.0 kg, 16 L) ~56% (50.0 kg, 150 L) ~50% (150.0 kg, 500 L)
CONCLUSIONS: The QbD is mostly useful in stage-I of the FDAs process validation. After determination of the control strategy the product can be manufactured in a commercial scale. Whatever the MAs, CPPs and CQAs defined during the process design (with the use of QbD principles) should be validated in the next stage of validation i.e. stage-II (Process performance qualification). In this phase the process and related equipment systems shall be validated. And the impact of the equipment (during the scaling) must be studied during this stage. As the batch size and equipment sizes increases there might be some variation in the expected outputs.
All these results should be analyzed and studied for the further developments. Validation simply doesn‟t mean manufacturing of defined no. of
batches and making and report, the validated state of the process should be monitored in a regular basis. The additional knowledge gained during routine manufacturing shall be utilized for adjustment of process parameters as part of the continual improvement of the drug product.
Even though different regulatory bodies
recommend for the different approach of the process validation, their ultimate intention is patient safety and timely delivery of the quality medicines to the product. Whatever the approach (Traditional / Enhanced) is followed for the
validation of the pharmaceutical product
REFERENCES:
1. Quality by Design, Vince McCurdy.2010; 30(4):12-32 2. Process Understanding: For Scale-Up and Manufacture of
Active Ingredients, First Edition. Edited by Ian Houson. @ 2011 Wiley-VCH Verlag GmbH & Co. KGaA. Published 2011 by Wiley-VCH Verlag GmbH & Co. KGaA
3. U.S. Department of Health and Human Services Food and Drug Administration, Pharmaceutical cGMPS for the 21st Century – A Risk-Based Approach: Second Progress Report and Implementation Plan 2004.
4. Juran, J.M., Juran on Quality by Design – The New Steps for Planning Quality into Goods and Services, the Free Press 1992.
5. Quality by Design and the New Process Validation Guidance A Report from IBC‟s Biopharmaceutical Development and Production Week by Cheryl Scott. 6. Discussion paper for ISPE on stage 2 process validation:
Determining and justifying the number of process performance qualification batches.
7. ICH Quality Implementation Working Group, Points To Consider, ICH-Endorsed Guide for ICH Q8/Q9/Q10 Implementation.
8. US FDA Guidance for Industry, Process Validation: General Principles and Practices
9. Guidance on process validation by European medicinal agency
10. EU Guidelines for Good Manufacturing Practice for Medicinal Products for Human and Veterinary Use, Annex 15: Qualification and Validation
11. Quality by Design (QBD): An Emerging Paradigm For Development of Pharmaceuticals, Chaudhari, et al. Int J Pharm 2014; 4(2): 138-146
12. EMA-FDA pilot program for parallel assessment of Quality-by-Design applications: lessons learnt and Q&A resulting from the first parallel assessment, European Medicines Agency, www.ema.europa.eu and www.fda.gov 13. Technical and Regulatory Considerations for Pharmaceutical Product Lifecycle Management, Endorsed by the ICH Steering Committee on 9 September 2014 14. Gupta Anuj et al., Short review on Quality by design: A
new Era of Pharmaceutical drug development; International Journal of Drug Development & Research, |July-September. Vol. 4 Issue 3; 2012: 43-46
15. The evolution of QbD –From inception to maturity in 2012, Lesley Maughan, Woodley Bio Reg Limited. 16. Pharmaceutical Development, Q8 (R2), Current Step 4
version, dated August 2009.
All © 2013 are reserved by International Journal of Pharmaceutical Sciences and Research. This Journal licensed under a Creative Commons Attribution-NonCommercial-ShareAlike 3.0 Unported License.
This article can be downloaded to ANDROID OS based mobile. Scan QR Code using Code/Bar Scanner from your mobile. (Scanners are available on Google Playstore)
How to cite this article: