10
INDUSTRY 4.0 REVOLUTION IN AUTONOMOUS AND
CONNECTED VEHICLE
A NON-CONVENTIONAL APPROACH TO MANAGE BIG
DATA
1ALESSANDRA PIERONI, 2NOEMI SCARPATO AND 3MARCO BRILLI
1Guglielmo Marconi University, Dept. of Innovation and Information Engineering, Rome, Italy
2San Raffaele Roma Open University, Dept. of Human sciences and Promotion of the quality of life,
Rome, Italy
3Marco Brilli, Sinergia s.c.a.r.l., Rome, Italy
E-mail: 1[email protected], 2[email protected], 3[email protected]
ABSTRACT
In literature, the term Industry 4.0 is used to represent the current Industrial Revolution. This revolution, however, involves different sectors: from manufacturing to healthcare. Indeed, the current revolution is also known as the ‘Internet of Things’ or ‘Internet of Everything’ or the ‘Industrial Internet’, and it is a vision rather than a technological improvement. Industry 4.0 is able to create value during the entire product life cycle. For the reasons described above, the outcome of this revolution may be an object but also a service designed for a final user, whose development is driven by innovation in several areas: IT, embedded systems, production, automation technique and mechanical engineering, all of them combined in order to deliver more complex systems as we know today.
In this scenario, Autonomous and Connected Vehicles (ACV) represent the perfect connection between digital and real world, an issue that stands in the center of Industry 4.0. This article intends to present a brief overview of the Autonomous and Connected Vehicles, while proposing a non-conventional approach to manage the great amount of data generated by the sensors disseminated inside the vehicle and all around itself, in other words, in the urban environment where the vehicle is completely spread-in.
In this paper, we address the issue of the calculation of the paths of vehicles totally connected. We present two approaches: the relational approach and the GraphDB solution.
Our intent is to demonstrate that the GraphDB approach is more convenient and easy respect to RDBMS solution especially in relation to real-time big-data management.
Keywords: Autonomous Vehicle, Connected Vehicle, Big Data, GraphDB, Internet of Things, Industry 4.0.
1. INTRODUCTION
In this paper, we present a novel approach to calculate the paths of vehicles totally connected. We realized and compared two approaches: the relational approach and the GraphDB solution.
We aim to prove that the GraphDB approach is more convenient and easy respect to RDBMS solution especially in relation to real-time big-data management.
The development of the processes belonging to the so-called fourth industrial revolution are driven by innovations in the areas of IT, embedded systems, production, automation technique and mechanical engineering. The aim consists of creating new factories able to manage much more complex systems as we know today [1]. Smart products and
smart production equipment are connected with the network and will overview the entire process, from the product idea, the product design, the supply chain and manufacturing. This approach allows to obtain more efficient results in all the value-chain production. Smart production also covers the delivery of products to the end users, after sales services and product recycling. The connection of all elements within the value chain in real time is considered the basis of Internet 4.0.
11 we are dealing with will bring valuable opportunities for manufacturing companies globally.
In this scenario, also vehicles are becoming “smart” and totally connected with the rest of the world through Internet technologies. Indeed, the advancements in modern technologies have allowed the comprehensive integration of essential systems and data for autonomous vehicle operations. This allows the vehicles to process decisions based on defined criteria informed by actual conditions, such as:
• Global Position System (GPS) – Satellite-based global location and time reference of vehicles for an accurate and constant position tracking.
• Inertial Navigation System (INS) – Monitors and calculates positioning, direction and speed of vehicles, assisted by sensors on-board.
• Laser Illuminated Detection and Ranging (LIDAR) – Laser detection sensors to identify surrounding objects.
On the other hands, collectively all the synchronization mechanisms provide the decision-making data that are necessary for the vehicle to be aware of position, traffic conditions and possible movements.
Currently, it is possible to identify two different categories of smart vehicle: AV (Autonomous Vehicle - vehicles that perform all driving functions with or without the "human driver", also called vehicles without driver) and CAV (Connected Autonomous Vehicle - vehicles provided with advanced communication technologies toward other vehicles or infrastructure). Both of them will lead new investment in urban infrastructure in order to reinforce features (especially of wireless communication) between the vehicle and the infrastructure at the edge of the road (e.g. smart lamppost) to transmit in real time an increasing amount of bidirectional data between vehicle and the urban infrastructure.
In this paper, the communication between CAV and the neighboring urban infrastructures is considered and a non-conventional approach to manage the huge amount of bidirectional data is presented.
Nowadays, many studies have been provided to introduce big data technologies into the CAV field of research.
In [2] authors analyze the industrial applications of Big Data and show as this technology is adopted in different industrial systems.
In [3] authors underlay the importance of the big-data technologies in the improvement of the efficiency, safety, and cost of road systems.
In [4] authors describe the importance of the connected vehicle implementation and of the related
big-data management opportunities. In particular many studies has been provided to realize systems
able to calculate the optimal path [5] in CAV environment.
To realize the idea to introduce big-data technologies into the CAV system in order to calculate the optimal path, we will apply a traditional RDBMS and a GraphDB approaches and we will compare their performance in term of data modeling accuracy and of time of execution.
Next sections illustrate a brief overview on the Connected Autonomous Vehicle and a comparison between two different methodologies able to threat with the big data generated from the sensors on-board vehicle, being the first methodology based on a RDBMS conventional approach and the second based on a non-conventional GraphDB approach.
2. THE TECHNOLOGICAL IMPACT OF
CAVS
Several vehicles have been designed and developed to be tested in various markets around the globe [6].
Figure 2 illustrates the conceptual evolution vision of a smart, integrated, dynamic and connected society in which the diffusion of connected autonomous vehicles is growing. Focusing the attention on the bidirectional flow of data between vehicles and infrastructure, a non-negligible aspect that has to be considered concerns the regulation about the privacy of the exchanged of data.
[image:2.612.312.518.129.255.2]Regulations exist, varying from state to state, that govern this issue which include the privacy [7] of the collection, the preservation, and the use of data in the connected society. Several protocols have been implemented to collect data from vehicles to infrastructure (V2I) and between vehicles (V2V). The former is better defined as an infrastructure
12 communication technology, while the latter as a cooperative communication technology.
Obviously, in the V2I protocol the infrastructure plays a coordination role by gathering global or local information on traffic and road conditions and then suggesting or imposing certain behaviors on a group of vehicles. The V2V protocol, instead, is more difficult to realize because of its decentralized structure, and aims at organizing the interaction among vehicles and possibly developing collaborations among them [8].
Progress in on-board computational technology has introduced "adaptive" intelligence, in other words vehicle change its behavior according to environmental conditions (for example, traffic condition). This processing must be performed in real-time, considering at the same time the speed of the vehicle, the obstacles present in the roadway and the traffic conditions, in order to have time to make appropriate changes keeping the vehicle in the lane and suggesting alternative itineraries.
As a consequence, the complexity of the vehicle embedded software is increasing, not only for the above-mentioned growing-up of the existing interactive functionalities, but also for the development of the orchestration layer that allows the communication between the various software modules and the on-road infrastructure.
Figure 2 illustrates an estimation of the complexity (in MoC - Million-of-line-Code) of the software modules that are provided for a vehicle totally connected compared to the software on board the vehicle with other existing functionalities.
It is possible to observe that the software embedded in a totally-connected vehicle can reach and exceed 100 millions of lines of code[9]. Even if the measure of line-of-code is not widely recognized, it can represent a valid indicator of the software complexity in this type of vehicle.
For all the cited reasons, it is mandatory reduce the computational time, the complexity of the embedded software while maintaining at the same time the availability and the reliability of software itself.
This software complexity requires the availability of processors with increasing performances. In the literature, this issue has been faced with different approaches. An interesting solution is based on the use of mixed architectures composed by a main microprocessor and a hardware accelerators [10][11]–[13]. Due to the inherently complexity of the studied systems, distributed simulation approach may be considered in order to study the performance of this kind of systems[14][15][16][17].
Next sections illustrate the conventional approach to manage the big data originated by urban
infrastructural sensors and by the sensor on-board and the non-conventional proposed approach using GraphDB methodology.
3. TYPICAL BIG DATA INFRASTRUCTURE
In literature the term Big Data is not clearly defined [18], in general, we can affirm that big data is a large set of heterogeneous information. Many attempts are been provided to realize collaborative environment for information management via artificial intelligent technology[19][20] these attempts should been applied in very different field such as legal domain [21][22], earth observation [23], Cultural Heritage [24].
In order to exploit Big Data, we need to use the so-called Big Data Technology and Analytic Methods instead of traditional data mining methods. We can find Big Data Technology in a very different research areas such as Medicine[25]–[27], IoT[7] and Internet of Vehicles[28].
For example, in the automotive sector, the next-generation PW1000G family of engines (manufactured by Pratt & Whitney, United Technologies division) installed on new Airbus A320 aircraft, count up to five thousand sensors that transmit data approximately 10 GB / Sec for each single engine, this brings the total amount of data generated, in one hour flight, to one TB. By comparison, one Formula 1 Williams car, with its 200 sensors installed, generates about a thousand streams for a total of 250 GB data for each trial session (weekend).
Another example of this is the experiences gained by the Ford® manufacturer, who, utilizing the Big Data massively to having the best advantage from it, as well as other major automotive manufacturers.
Therefore, it is natural to use Big Data when we need to manipulate a lot of data came from motion sensors and electronic control boards on board vehicle. Otherwise, this amount of data could become unmanageable.
[image:3.612.315.521.132.219.2]On the strictly technical side, the example of Google ™ Car is impressive: from field tests, with the set of active sensors, the Google ™ car generates a data volume of approximately 1 GB / sec.
13 Considering an average (for the United States alone), people drive a single vehicle about 600 hours per year, producing a data volume of more than 2 PB (approximately 2000 TB or two million GB).Since worldwide, the number of cars is near to one billion units, it is difficult to imagine the amount of data involves. In this context, then, the number of information provided by the various vehicles is intended to increase sharply, with a consequent increase in the complexity of the management of the same. One of the possible solutions to deal with the management of these moles of data is the appeal to cloud infrastructure;
In this context, the number of information provided by the various vehicles is expected to increase dramatically, resulting in augmented complexity in managing them. One of the possible solutions to deal with these amount of data is the employ of the cloud infrastructure because this type of infrastructure is based on "Commodity Hardware" where you can scale the number of nodes in the order of thousands of units. In this way, there is a high storage capacity, typically accomplished through the use of local hard disks that then constitute a distributed file system.
The presence of a network typically at high speed complete the infrastructure. The use of these resources requires that the customer (user), pay only a predetermined height (fee) that corresponds to an hourly cost, or to the number of nodes occupied, or storage used.
The advantages, from an operational point of view, are:
- Low initial costs: these costs are reduced to a minimum, since no initial investment is required; there is only one annual fee for service delivery.
- Backup Procedures: These procedures allow data to be saved (in aggregate or raw form) and stored for a possible recovery in case of hardware or software failure.
- Updates (Operating Systems and Databases): Systems are regularly updated to avoid the malfunctionings (often software) that occurs under certain circumstances.
- Scalability: This issue can be easily solved by requiring additional power (computing, storage, networking) to its provider. The service provider will then be responsible for providing the appropriate resources.
Type of structure adopted for the operating platform can be classified as:
- Infrastructure as a Service (IaaS): the services provider supplies the customer with basic
infrastructure for the various segments (computing, storage, network) represented by individual components such as CPU RAM and network adapters.
This solution is very flexible because it gives the customer the possibility to customize the entire infrastructure according to their needs. With this methodology, for example, the customer can install how many virtual servers they want, with the Operating Systems with which they intend to create and manage resources.
- Platform as a service (PaaS): the service provider defines the entire infrastructure by choosing, in agreement with the client, the type of resources and the associated systems. The customer needs only to define its applications, in order to optimize the costs according to the initial needs.
- Software as a Service (SaaS): the service provider customizes also the standard applications (such as mail, CRM and web services).
4. RDBMS APPROACH
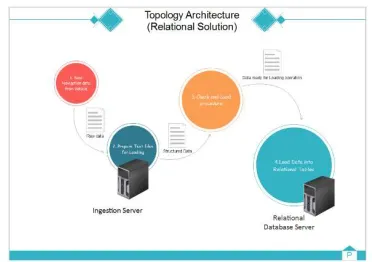
[image:4.612.328.514.480.611.2]As shown in the figure 3, the data sent from Connect Vehicle, has been received from Ingestion Server that provide a set Ascii files in order to be load into existing Relational Tables. Obviously, only structured data regarding sensor values will be treated. In this way, after loading into tables, the SQL queries retrieve the number of vehicle lying in the long tail line of the road artery.
Figure 3: Topology Architecture – Relational Solution
14 them. The latest table contains the information about
Figure 3: RDBMS Model
the geo-referencing, this information is useful to calculate the simulated path of vehicles.
The master table is linked, through specific referential integrity constraints, with each table representing the individual sensor; in this way, it will be possible to navigate the data, by searching by the specific characteristics of interest.
Figure 4 shows whole described elements and their relationships.
RDBMS Approach brings two main benefits:
- The management of multi-vehicle: this management is available already at the beginning. Indeed, in case of management of a fleet of vehicles, just need to enter in the vehicle identifier in the master table and the sensor data (even not complete) in the related tables.
- The possibility, at the almost null cost, of adding a new sensor (or type of sensors) to cope with the new requirements that may arise. It is, in fact, sufficient to create a new table, with the specific fields relating to the timestamp, to the value of the data provided and the key field that binds the latter to the master table.
However, the RDBMS approach leads three main problems:
- Non-linear increasing of response times that implies grows the complexity of navigation.
- Data Management only for structured data.
- Impossibility of the real-time case implementation.
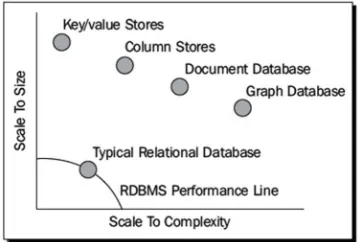
As mentioned above the management of the considered data with traditional technologies (RDBMS) is no longer feasible due to the unstructured data nature. A further limit in the RDBMS is represented by the so-called scalability (horizontal and/or vertical). In this context, as well exploiting the hardware platforms more efficient or even a dedicated cloud, you reach soon the saturation limit through the use of a traditional database (RDBMS) (see Fig. 5).
5. GRAPHDB APPROACH
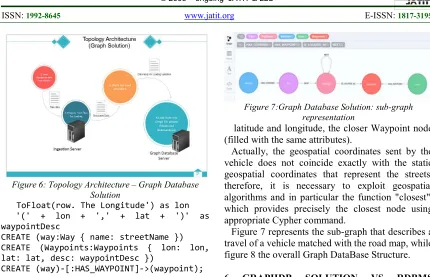
In this section, a description of the Graph DataBase solution is illustrated, as represented in Fig. 6. In this case the start set file is the same but some differences are regarding the loading
methodology and the concept involving GraphDB. The data are loaded into GraphDB scheme. As a consequence, node entities and relationships that will be stored in the same main area (RAM typically) will be generated.
As mentioned above, the RDBMS approach isn’t efficient in the implementation of the model both in the real-time case and in the case of not structured
data, furthermore, its performances about scalability and response time are poor at the increase of the amount of managed data.For these reasons, we implement a GraphDB approach in order to solve the issues described in the previous section.
First step of our approach is the loading of the dataset. The loading inside the new environment is made through the execution of the LOAD CSV native command, this command can be executed via a "classic" mode with the presence of the file in the local environment (file) or via standard protocols such as HTTP HTTPS FTP. This command provides, as an option, the possibility to create the nodes and the relations between them.
Following is shown the script for the loading of the dataset containing the considering road (i.e. Way), the corresponding waypoints that contain the geospatial coordinates and its relationships:
//
// CREATING (:Way) nodes // CREATING (:Waypoints) nodes
// CREATING (:Way)-[:HAS_WAYPOINT]->(:Waypoints) relationships
//
USING PERIODIC COMMIT
LOAD CSV file with headers from 'file:///Florence-station-ways.csv' as row WITH row. The Way' as streetName,
[image:5.612.325.505.259.380.2]ToFloat(row. The Latitude') as lat,
15
Figure 6: Topology Architecture – Graph Database Solution
ToFloat(row. The Longitude') as lon '(' + lon + ',' + lat + ')' as waypointDesc
CREATE (way:Way { name: streetName }) CREATE (Waypoints:Waypoints { lon: lon, lat: lat, desc: waypointDesc })
CREATE (way)-[:HAS_WAYPOINT]->(waypoint);
The second step of our approach is the creation of the following additional three types of nodes:
- Vehicle: each vehicle is univocally represented by a specific node.
- Trip: Every time a vehicle is "Started" (by setting the parameter ignition_status as 'run'), it generates a Trip type node, this node represents the started car travel. The timestamp associated with the sending of the data of the sensor ignition_status is stored in 'start' attribute of the node. When the sensor sends a "stopped" (ignition_status = 'off') signal to the vehicle, will be added an attribute of type 'end', filled with the respective timestamp, to represent the fact that the car travel is finished.
- TripData: contains, for each Trip, all data received from the following sensors: accelerator_pedal_position, engine_speed, latitude, longitude, and vehicle_speed. The transmissions sequence is managed as a linked list.
In addition, has been introduced the following two types of relations:
- HAS_COVERED: is a relation between a specific vehicle and each of its related trips;
- NEXT: is a relation able to constitute the concatenated list between the individual data transmissions (TripData), relating to the specific travel (Trip).
In order to determine the position of the vehicle in the road surface, it is necessary to associate to each
[image:6.612.89.519.63.340.2]TripData node, characterized with the attributes
Figure 7:Graph Database Solution: sub-graph representation
latitude and longitude, the closer Waypoint node (filled with the same attributes).
Actually, the geospatial coordinates sent by the vehicle does not coincide exactly with the static geospatial coordinates that represent the streets, therefore, it is necessary to exploit geospatial algorithms and in particular the function "closest", which provides precisely the closest node using appropriate Cypher command.
Figure 7 represents the sub-graph that describes a travel of a vehicle matched with the road map, while figure 8 the overall Graph DataBase Structure.
6. GRAPHDB SOLUTION VS RDBMS
SOLUTION
There are several problems to face with the solution of this kind of applications, such as time and computational complexity. In this context, GraphDB seems to be more performant since makes possible the execution of complex queries based on the nodes graph.
As example, exploiting these queries is possible to determine, more or less in real time the shortest path between two locations; in this code fragment however, is not consider the possibility that one or more ways are busy.
Following, the statement Cypher able to calculate the shortest path:
MATCH p = shortestPath((start:Way)-[:HAS_WAYPOINT|:NEXT*]-(end:Way)
WHERE start.name = 'Via degli Arazzieri' AND end.name = 'Via Pietro Toselli' RETURN p
The results of this statement is: “to arrive in Via Pietro Toselli, starting from Via degli Arazzieri, the shortest path passes by 27 April, Piazza dell'Indipendenza, Via Giuseppe Dolfi, Viale Filippo Strozzi, Viale Belfiore and finally to Via Delle Porte
Nuove (congested)”.
16
MATCH p = shortestPath((start:Way)-[:HAS_WAYPOINT|:NEXT*]-(end:Way)
WHERE start.name = 'Via degli Arazzieri' AND end.name = 'Via Pietro Toselli' AND NOT 'Via Delle Porte Nuove' in
[image:7.612.91.297.171.264.2]Extract( way in nodes(p) | way.name ) RETURN p
Figure 8: Graph Database Structure
The result of the query is represented by the alternative route shown in Figure 9, useful to avoid the queue.
[image:7.612.92.305.443.513.2]The aim of this paper is achieved, demonstrating that for this specific category of problems (i.e. those involving paths of vehicles totally connected), the GrapgDB solution is more convenient and easy respect to RDBMS solution. We executed the proposed algorithm with the benchmarks and the experiment has confirmed a capacity to take over 50 million crossings per second. It is clear that this type of structure can be easily used when we consider a large number of objects and response times near real-time.
Figure 9: Alternate shortest path performed by system to avoid “Via Delle porte Nuove” queue.
It is clear that the advantages of this approach are:
- The GraphDB representation: is easily understandable and can be automated with dedicated tools.
- The data modeling: data modeling process is more accurate respect to RDBMS. GraphDB representation allows users to describe domain with a complex graph model able to represent the whole domain, its concepts, and their relations.
- The GraphDB query language: the query language provides many native commands able to highlight the shortest path or, as shown in the case study, an alternative path easily; this gives
a good level of abstraction and is independent of the knowledge of the data structures, differently from the relational context. Statistically, an
optimized query for graph database contains
fewer errors respect to the equivalent realized in SQL language.
- The implementation: the GraphDB technology allows storing both the node that the reports which it has with other neighboring nodes (mechanism of index-free adjacency), for this reason it no need of complex join operations to be carried out at the time of execution. Due this feature the above-mentioned solution is better respect to RDBMS solution in terms of scalability and efficiency.
- Performance: the GraphDB query performance is near to real-time. Using GraphDB, the complex join (i.e. the so-called join pain that is a typical issue of RDBMS) are converted into the crossings of the graph, thus maintaining the performance in the range of milliseconds
7. OPEN RESEARCH ISSUES
This paper deals with a complexity problem that concern the treatment of real-time big-data management in the autonomous vehicle environment. The proposed solution, that consists of using GraphDB technology to manage this data seems to be useful and actionable. However, a step forward has to be done introducing, in the proposed simulated model, a more complex sensor network to represent the urban digital infrastructure. Another possible improvement would consist of creating several network interfaces to add, for example, other traffic information sources, useful to complete the proposed algorithm on the “alternative shortest path”.
8. CONCLUSIONS
The term Industry 4.0 is used to represent the current Industrial Revolution, that involves different sectors, i.e. manufacturing and automotive. The current revolution is also known as the ‘Internet of Things’ or ‘Internet of Everything’ or the ‘Industrial Internet’, and it been able to create value during the entire product life cycle. In this revolution,
17 Autonomous and Connected Vehicles (ACV) represent the perfect connection between digital and real world, an issue that stands in the center of Industry 4.0.
This article has presented a brief overview of the Autonomous and Connected Vehicles and proposed non-conventional approach to manage the great amount of data generated by the sensors disseminated inside the vehicle and all around itself, in other words, in the urban environment where the vehicle is completely spread-in.
In particular, the article presented a simple case study where the information of the sensors has been attached to the geolocation of the vehicle, making it possible to discover in time near real-time the queue event. This is of great help to potential stakeholders such as traffic control structures and assurance agencies.
Furthermore, the benefits deriving from the adoption of the proposed solution have been highlighted, that consists of using the GraphDB methodology to manage the huge amount of information deriving from the bidirectional exchange of data between the sensors on board the ACV and the digital urban infrastructure.
In order to demonstrate the advantages that may be obtained using the GraphDB it has been executed the proposed algorithm with specific benchmarks, and the experiment has confirmed a capacity to perform over 50 million crossings per second.
Concluding, the proposed methodology provides the following advantages: the easily representation of the model; the accuracy of the data modeling; the usability of the GraphDB query language; the innovation of implementation, in terms of mechanism of index-free adjacency, and the temporal complexity performance, near to real-time.
REFERENCES:
[1] M. Bremicker, “Industry 4.0: The challenges of tomorrow,” 2016.
[2] A. Mosavi, A. Lopez, and A. R. Varkonyi-Koczy, “Industrial Applications of Big Data: State of the Art Survey,” Springer, Cham, 2018, pp. 225–232.
[3] C. N. Bowman and J. A. Miller, “MODELING TRAFFIC FLOW USING
SIMULATION AND BIG DATA
ANALYTICS,” in 2016 WINTER
SIMULATION CONFERENCE (WSC),
2016, pp. 1206–1217.
[4] SAS Institute Inc., “The connected vehicle: big data, big opportunities,” SAS White Pap., p. 10, 2016.
[5] H. Al Najada and I. Mahgoub, “Autonomous vehicles safe-optimal trajectory selection based on big data analysis and predefined user preferences,” in 2016 IEEE 7th Annual Ubiquitous Computing, Electronics &
Mobile Communication Conference
(UEMCON), 2016, pp. 1–6.
[6] “Baidu opens up driverless car tech to challenge Google, Tesla.” [Online]. Available:
https://www.cnbc.com/2017/04/19/baidu-
driverless-cars-open-source-technology.html. [Accessed: 04-Oct-2017]. [7] F. Guadagni et al., “Personal and Sensitive
Data in the e-Health-IoT Universe,” in
Internet of Things. IoT Infrastructures: Second International Summit, IoT 360° 2015, Rome, Italy, October 27-29, 2015,
Revised Selected Papers, Part II, B.
Mandler, J. Marquez-Barja, M. E. Mitre Campista, D. Cagá\vnová, H. Chaouchi, S. Zeadally, M. Badra, S. Giordano, M. Fazio, A. Somov, and R.-L. Vieriu, Eds. Cham: Springer International Publishing, 2016, pp. 504–514.
[8] K. C. Dey, A. Rayamajhi, M. Chowdhury, P. Bhavsar, and J. Martin, “Vehicle-to-vehicle (V2V) and vehicle-to-infrastructure (V2I) communication in a heterogeneous wireless network - Performance evaluation,” Transp.
Res. Part C Emerg. Technol., vol. 68, pp.
168–184, 2016.
[9] “Million Lines of Code — Information is Beautiful.” [Online]. Available: http://www.informationisbeautiful.net/visua lizations/million-lines-of-code/. [Accessed: 04-Oct-2017].
[10] G. C. Cardarilli, L. Di Nunzio, R. Fazzolari, and M. Re, “Algorithm acceleration on LEON-2 processor using a reconfigurable bit manipulation unit,” in 2010 8th Workshop on Intelligent Solutions in
Embedded Systems, 2010, pp. 6–11.
[11] G. C. Cardarilli, L. Di Nunzio, R. Fazzolari, M. Re, and R. B. Lee, “Butterfly and Inverse Butterfly nets integration on Altera NIOS-II embedded processor,” in 2010 Conference Record of the Forty Fourth Asilomar Conference on Signals, Systems and
Computers, 2010, pp. 1279–1283.
[12] G. C. Cardarilli, L. Di Nunzio, R. Fazzolari, and M. Re, “Fine-grain Reconfigurable Functional Unit for embedded processors,”
18
Fifth Asilomar Conference on Signals,
Systems and Computers (ASILOMAR),
2011, pp. 488–492.
[13] G. C. Cardarilli, L. Di Nunzio, R. Fazzolari, and M. Re, “TDES cryptography algorithm acceleration using a reconfigurable functional unit,” in 2014 21st IEEE International Conference on Electronics,
Circuits and Systems (ICECS), 2014, pp.
419–422.
[14] D. D’Ambrogio, A., Iazeolla, G., Pieroni, A., Gianni, “A model transformation approach for the development of HLA-based distributed simulation systems,” in
SIMULTECH 2011 - Proceedings of 1st International Conference on Simulation and Modeling Methodologies, Technologies and
Applications, 2011, pp. 155–160.
[15] G. Iazeolla and A. Pieroni, “Energy saving in data processing and communication systems.,” ScientificWorldJournal., vol. 2014, p. 452863, Jun. 2014.
[16] A. D’Ambrogio, D. Gianni, G. Iazeolla, and A. Pieroni, “Distributed simulation of complex systems by use of an HLA-transparent simulation language,” in 2008
Asia Simulation Conference - 7th
International Conference on System
Simulation and Scientific Computing, 2008,
pp. 460–467.
[17] G. Iazeolla, A. Pieroni, A. D’Ambrogio, and D. Gianni, “A Distributed Approach to Wireless System Simulation,” in 2010 Sixth Advanced International Conference on
Telecommunications, 2010, pp. 252–262.
[18] A. De Mauro, M. Greco, and M. Grimaldi, “A formal definition of Big Data based on its essential features,” Libr. Rev., vol. 65, no. 3, pp. 122–135, 2016.
[19] M. T. Pazienza, N. Scarpato, A. Stellato, and A. Turbati, “Din din! The (Semantic) Turkey is served!,” in CEUR Workshop
Proceedings, 2008, vol. 426.
[20] M. T. Pazienza, N. Scarpato, A. Stellato, and A. Turbati, “Semantic Turkey : A Browser-Integrated Environment for Knowledge Acquisition and Management,” Semant. Web, vol. 0, pp. 1–14, 2011.
[21] M. Bianchi, M. Draoli, G. Gambosi, M. T. Pazienza, N. Scarpato, and A. Stellato, “ICT tools for the discovery of semantic relations in legal documents,” in CEUR Workshop
Proceedings, 2009, vol. 582.
[22] M. T. Pazienza, N. Scarpato, and A. Stellato, "STIA*: Experience of semantic annotation
in Jurisprudence domain", In Frontiers in
Artificial Intelligence and Applications vol. 205. 2009.
[23] F. Fallucchi, M. T. Pazienza, N. Scarpato, A. Stellato, L. Fusco, and V. Guidetti, “Semantic bookmarking and search in the earth observation domain,” in Lecture Notes in Computer Science (including subseries Lecture Notes in Artificial Intelligence and
Lecture Notes in Bioinformatics), 2008, vol.
5179 LNAI, no. PART 3, pp. 260–268. [24] A. R. D. Accardi and S. Chiarenza, “Musei
digitali dell ’ architettura immaginata : un approccio integrato per la definizione di percorsi di conoscenza del patrimonio culturale Digital museums of the imagined architecture : an integrated approach,”
DISEGNARECON, vol. 9, 2016.
[25] P. Ferroni et al., “Risk Assessment for
Venous Thromboembolism in
Chemotherapy-Treated Ambulatory Cancer Patients,” Med. Decis. Mak., vol. 37, no. 2, pp. 234–242, 2016.
[26] P. Ferroni, F. M. Zanzotto, N. Scarpato, S. Riondino, F. Guadagni, and M. Roselli, “Validation of a Machine Learning Approach for Venous Thromboembolism Risk Prediction in Oncology,” Dis. Markers, vol. 2017, Sep. 2017.
[27] F. Guadagni et al., “RISK: A random optimization interactive system based on kernel learning for predicting breast cancer disease progression,” in Lecture Notes in Computer Science (including subseries Lecture Notes in Artificial Intelligence and
Lecture Notes in Bioinformatics), 2017, vol.
10208 LNCS, pp. 189–196.
[28] M. Gerla, E. K. Lee, G. Pau, and U. Lee, “Internet of vehicles: From intelligent grid to autonomous cars and vehicular clouds,” in
2014 IEEE World Forum on Internet of

![Figure 2: Complexity of modern software [4]](https://thumb-us.123doks.com/thumbv2/123dok_us/8905097.956441/3.612.315.521.132.219/figure-complexity-of-modern-software.webp)