6256
DETECTION OF BREAST CANCER IN MAMMOGRAMS
THROUGH A NEW FEATURES AND DECISION TREE
BASED, CLASSIFICATION FRAMEWORK
ANWAR YAHYA EBRAHIM
Dr.in Computer Science, Babylon University, Babylon, IRAQ E-mail: [email protected]
ABSTRACT
This research proposes a new framework for detection of breast cancer. Currently, mammography is the primary tool for early detection and diagnosis. The use of computer systems to assist clinicians in digital mammography image screening has advantages over traditional methods. Computer-aided techniques can enhance the appearance of the mammogram images and highlight suspicious areas. Also it extracts certain dynamic features to distinguish between benign and malignant mammograms. Although great efforts have been made to come out with effective methods, their performances especially in terms of accuracy are fallen short due to poor image resolution, noise, and distinction between cancerous and non-cancerous tumours is very subtle. Thus, this study presents an automatic classification scheme to classify breast cancer into normal, benign and malignant, which covers background detection, image enhancement, pectoral muscles separation, selected features and classification processes. To this aim, this framework uses set of various techniques. First step we have achieved improvement on mammogram to improve the image accuracy based on this framework, after new method has been used for features extraction. A new method named Weighted Sparse Principal Component Analysis (WSPCA) is applied to select the distinctive features of the images of mammogram. The analysed mammograms of images are then identified as benign or malignant through decision tree by comparing the performance of Decision Tree with Support Vector Machine (SVM) and Bayesian classification on the MIAS data set. Decision Tree classifier is chosen to classify the mammograms using the above features as its input. The evaluations are carried out on the entire Mammography Image Analysis Society (MIAS) standard dataset. The proposed framework tested on MIAS data set achieved an overall accuracy of 90% with Decision Tree classifier and the perform accuracy of 97.8% using WSPCA features with Decision Tree classifier for sequential selection of benign versus malignant mammograms. Suggested method achieves good results when we have verified on various mammograms.
Keywords: Chest Cancer, Mammograms, Feature Extraction, Weighted Features, Classification
Techniques
1. INTRODUCTION
Breast cancer is the most common malignancy and cause many deaths among women. The early detection is the only way to shun mastectomy, increase survival probability, and decrease mortality rate. Mammography is the most efficient way of screening for breast cancer patients which can diagnose a malignancy (cancer) up to two years before a lump can be aroused. Mammography cannot stop or decrease breast cancer but is helpful only in the early detection in order to reduce mortality rate (DeSantis et al., 2011).
There are a number of renowned and probable causes for chest cancer. These can be splitted into
6257 and misinterpreted abnormalities [8]. With the
development of technology, Computerized
enhancement, segmentation and detection of lesions (benign or malignant) are also being done for mammograms with high precision. Various computer-aided techniques are being developed for the enhancement and diagnosis of breast cancer as well as for assessing the breast cancer threat.
Computerized examination in screening
mammography has already produced promising results. People become more aware of computer applications in medical imaging. In this paper, enhanced Principle Component Analysis (PCA) was used to extract features. Although PCA has been widely applied in the area, but the features considered in this study have not been extracted before [9]. Further, these extracted features are reduced to the best features only. Features selection, that have been investigated and used for classification include but are not limited to Discrete Cosine Transform (DCT) (Kendall and Flynn, 2014) features, etc. Principal component analysis (PCA) (Bichen Zheng et al., 2014) is used to reduce the dimensionality of extracted features by removing the redundant ones. After features extraction and selection, next step is to fuse them in order to obtain the best features set. This process is accomplished by two variations of PCA as Sparse Principle Component Analysis (SPCA) [12] and Weighted Sparse Principle Component Analysis (WSPCA). The choice of the (ideally "small") number of principal components (PCs)to include into the description of the information without losing too much information was somewhat arbitrary [12]. In automatic classification of breast cancer, it is important to decide which parameters give the best differentiation between categories such normal, benign and malignant. The objective of the study is to create entirely automated techniques for image enhancement, pectoral muscle separation and classification of mammogram images into normal, benign (harmless) and malignant (cancer) categories on the basis of proposed features. An experiment is performed to judge the classification accuracy in the presence/absence of quantum noise. Some Discrete Cosine Transform (DCT) features are extracted and classified by using well known classifiers such as Decision Tree, support vector machine (SVM) and Bayesian [13][14]. The results show that there is a significant improvement in the classification accuracy rate after selected features. This study introduces (WSPCA) features used to classify mammograms into normal and abnormal categories in order to minimize false-positive result. Project is
ordered as follows: Introduction is displayed in stage first. stage second presents related work. stage third defines the suggested method. stage forth contains experimental outcomes and conclusion is presented in stage fifth.
2. BACKGROUND OF THE STUDY
Numerous classification schemes have been designed in literature [15][16][17][18] for characterization of malignant and benign breast lesions but tragically couldn’t achieve the encouraging results due to their incompetence either in removing noise or lack of robust and differentiating features or selection of misfit classifier [19]. High detection rate is mainly depends upon proper and state-of-the-art pre-processing techniques (noise restoration, exclusion of non-breast areas, and visual enhancement due to poor quality images), discriminating features and sophisticated classifier harmonized with the nature of data to detect cancer in order to avoid misclassification problems [16]. Several studies (Liu et al., 2010) have been conducted in the literature to rule out the malignancy from mammographic images and unfortunately couldn't acquire the desired results. The possible reason for not attaining higher detection accuracy rate is the possibility of standard pre-processing techniques for enhancement, features selection and inclusion of unnecessary parts from breast such as pectoral muscles. Most of the researchers used already available techniques for preprocessing, they mainly focused on features extraction, selection and classification. It seems their lack of interest in preprocessing steps [21][22], while preprocessing bring the image to that standard where it can be best suitable for further processing such as features extraction and classification into normal, benign and malignant cases. Some of them used one type of transform based or shape features [23], rest did not check the various classifiers to select the best one according to available features, and they just used any one of those such as SVM or KNN [24][25][26]. Due to aforementioned reasons they were unable to achieve the higher accuracy rate in classifying mammograms into normal, benign and malignant cases. Hence, only a classification
scheme with state-of-the-art pre-processing
6258 main aim of segmentation in mammograms is to separate the breast tissue and unwanted regions from breast part (which are not part of breast and have no utility in breast cancer detection) in order to limit the area of interest. Only useful, correct and most discriminating extracted features from the mammogram images can produce better results for the diagnostic of abnormality and provide higher
classification accuracy rate. Redundant,
insignificant and non-representative features given to classifier as an input carry no weight in terms of accuracy rate and may yield misleading results [30]. The classification process is mainly depends on correct feature extraction methods. The extracted features should be capable to differentiate between normal, benign and malignant masses [31][32]. It is a demanding job for automatic techniques to extract good features set for classification in order to achieve promising results because malignancy detection depends upon the most representative and robust features [21]. The selection of suitable classifier according to nature of input features is the task of utmost importance at classification stage that may deliver state-of-the-art performance in classifying mammograms into normal, benign and malignant categories with higher accuracy rate. tables.
3. PROPOSED TECHNIQUE
The projected method is splitted into (4) major phases as presented in Figure 1: Enhancement by applying Histogram Equalization, Feature Selection, Tree Classifier. Every part of these four phases is defined below one after another.
3.1 Improvement for Image
In this phase, Histogram Equalization method has been used. The improvement is focused in flat regions of the image, which avoid over development of noise. It also decreased influence of edge shadowing.
3.2 Features Extraction
Features performed an important role in CAD environment. We have applied DCT feature for our projected method.
3.2.1 Discrete cosine transform (DCT)
Features Discrete cosine transform (DCT) is applied for converting the signal into its frequency parts. In image processing DCT attempts
to de-correlate the image information [33]. DCT has the ability to pack the image data into as few DCT coefficients as possible without any distortion [34]. DCT has the property of separability and symmetry. 2-Dimensional DCT of the input is presented by the following equation:
C(u,v)=α(u)α(v) (1)
Where 0≤ u ≤ N, & 0≤ v ≤ N, and
α(u)α(v) =
3.3 Feature Selection
6259 algorithm is proposed. In addition, we propose a novel form to calculate the total difference of the modified PCs. Further, the algorithm for WSPACA in parallel to PCA and SPCA is presented in detail
with example: Let DCT features (variables) F = (F1,
F2... Fp)’ represent a p-dimensional random vector
with a multivariate normal distribution. It is possible that some features correlate with one
another. For instance, if the variables F1 and F2are
highly correlated, such that the correlation index
between F1and F2approaches 0.9, then either F1 or
F2could be eliminated from the analysis as its role
i1s duplicated by the other. By doing this, the basis of the original features is altered to a more efficient set by using linear combinations. In the general p-dimensional case, this leads to a candidate set of new features. The explained steps are presented in Algorithm 1.
Algorithm 1
Step 1: S
u
ppose A beginning at V [1: k], theloadings of the headmost k (PCs).
Step 2: Assumed a constant A = [α1.. αk], fix the
next elastic net issue
XW=∑jn=1Wj Xj j=1,….,n (2)
Step3:ΒWSPCA1= +
, j=1,...,k (3)
Step 4: For a fixed βj = [βSPCA1,...,βSPCkf], PCA can
be found via compute the SVD of the features matrix, Calculate the
SVD of XWTXW = UDVT, (4)
Then update AW=UVT. (5)
Step 5: reiterate Steps 4-5, until concourse.
Step6:Normalization:Ṽ= (6)
In step 1. the presented PCs are the linear combinations of all original features, V is the response vector (non-zero components) and it is less than or equal to k, given an integer k with 1≤k≤p. In Step2, A is a vector matrix. In Step3,
assumed variables of X are presented in (nxp)
matrix, where n rows represent an independent feature from features (number of observations)
and p is the number of variables (dimensions),
where is spare coefficients, j be the predictors
for nonzero entries, is feature vector, XTX is
represent (covariance matrix) transpose for vector matrix by row vector of features, where represents the norm in the constraint.
In the current research, in order to find the best number of features, λ is penalty by directly imposing a constraint on PCA and λ1,j = 0 call SPCA criterion r. Β = (β0, β1, β2,., βk)T where
its regression coefficients represent the optimal
minimizing. In Step 4, SVD is a singular value
decomposition, UD are PCs, the columns of VT
are the congruouing loading of the PCs
eigenvectors, V diagonalizes the covariance
matrix XTX, U are called Eigen values of the
covariance matrix, D is the diagonal matrix,
which has the eigenvalues of covariance matrix.
XTX and V are the Eigen – genes, which
represent the sparse loading of feature matrix.
In Step 6, Wj is weighted features, and, βj=
[βSPCA1,...,βSPCAf],. Then (XW) was calculated,
which represents weighted feature matrix. Where X is a new feature matrix of SPCA and represents 8 types of features.
Coefficients for WSPCA technique were obtained by minimizing both SPCA and weighted feature matrix. In Step 7, represents highly correlated by weighted features among all features, is penalty by directly imposing an
constraint on PCA and (λ1,j = 0), represents to
exclude redundant features with very little variation from other features that sufficiently represents it. This is where adaptive weights were used for penalizing different coefficients in the 1 penalty, Here, we can ignore the penalty
part in calculating Step 8. Then, AW= UVT was
updated where PCs were selected for displaying
the selected features. Thus, a large
dimensionality decrease was realized. Then
after (Vj) Normalization was calculated for
approximated weighted sparse principal
components.
Step 9 was where βWSPCA was the WSPCA
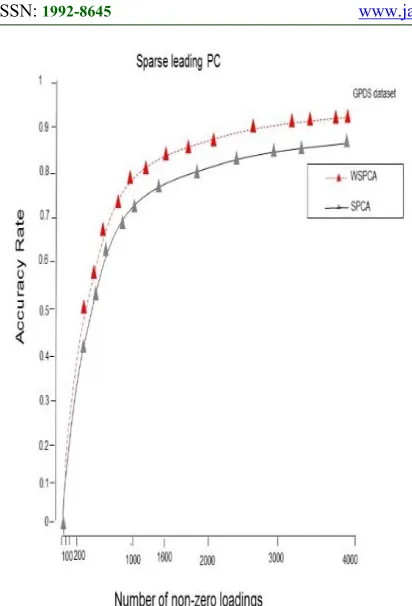
coefficient. Therefore, WSPCA gives more accuracy for important features than SPCA as shown in Figure 2. WSPCA represents advantages in a number of aspects, including
calculation efficiency, high interpreted
6260 Figure 2: Scatter plot for DCT Features with WSPCA
Applied to Find Leading PC
4. OUTCOMES AND DISCUSSION
We have applied widely presented datasets MIAS. The database is taken from the Mammographic Institute Society Analysis (MIAS) [36]. Each image of mammogram is of size 1024 x 1024 pixels, and resolution of 200 microns as shown in Figure 3. There are 322 mammograms of right and left chest of 161 patients in this database.
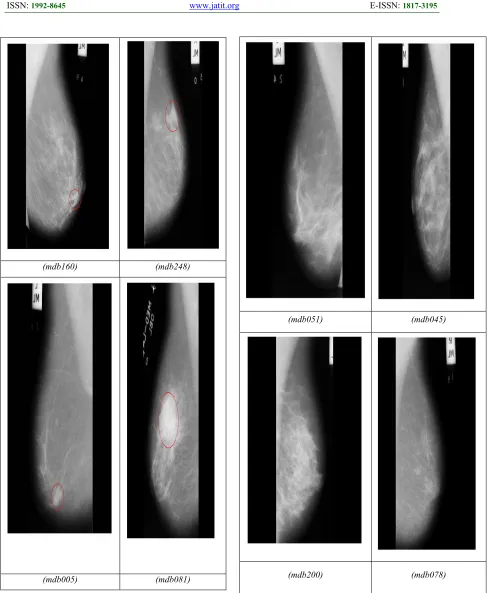
69 mammograms were diagnosed as being benign, 54 malignant as shown in Figure 4 and 207 normal as presented in Figure 5.
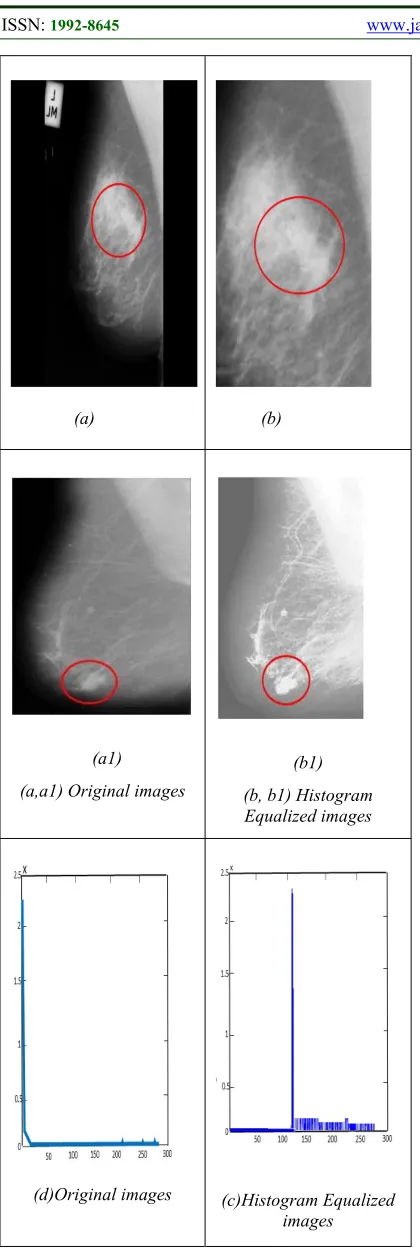
[image:5.612.94.300.73.376.2]Improvement has been done by histogram equalization [37]. Outcomes have been display in Figure 6.
(a) Right view (mdb009)
b) Left view (mdb004) [image:5.612.311.527.189.456.2]
6261
Figure 4:Benign mammogram images Figure 5: Normal mammogram images
(mdb160) (mdb248)
(mdb005) (mdb081)
(mdb051) (mdb045)
6262
(a)
(b)
(a1) (a,a1) Original images
(b1)
(b, b1) Histogram Equalized images
(d)Original images (c)Histogram Equalized
[image:7.612.90.300.66.690.2]images
Figure 6: Show The Results by Histogram Equalization
We have verified the achievement of the Decision Tree by computing and examination of accuracy, specificity and sensitivity for malignancy discovery [38]. achievement of classifiers is computed by the
next achievement measures. Features of the object
is seem independent of each other in Decision Tree classifier [39][40]. In Decision Tree classifier database is split. various classifier outcomes with MIAS dataset and, various classifier outcomes using WSPCA features with MIAS dataset are displayed in Table 1 and Table 2.
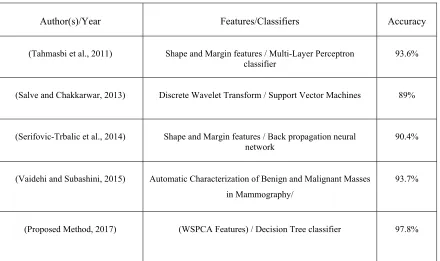
5. COMPARISON WITH STATE-OF-THE-ART TECHNIQUES
This is a rigid task to critically compare proposed work with various existing methods in the literature due to certain reasons such as various mammographic databases, various samples within same datasets, sample size, different training and testing ratio. However, the main aim is to have common trends of performance comparison and proposed technique is compared with other existing techniques on the basis of performance measures such as accuracy. Results in Table 3. have clearly shown that the proposed method outperformed other existing techniques in accuracy. This excellent performance is due many factors, among others: enhancement, pectoral muscle separation, features selection and classification.
6. CONCLUSION
Suggested method is improved for test the breast cancer from mammograms. This technique achieves this testing in multiple stages. The preprocessing stage on image is done to improve image accuracy. Then features extraction and features selection has been achieved. Decision Tree has been applied for classification. All proposed methods are developed properly to attain the best possible results. MIAS dataset have been used for experimentation purpose. Performance measures are used to evaluate the capacity of proposed techniques and tools.
state-of-6263 the-art features, using empirically selecting suitable classifier and along with well contribution on newly proposed pre-processing techniques.
The Decision Tree classifier is implemented into two steps: mammograms are first classified as normal or abnormal, then the abnormal mammograms are further classified into benign and malignant. This study discussed the Fuzzy logic to enhancements technique to enhance image foreground. Segmentation of pectoral muscle is also introduced to extract the breast part from the mammographic image. This research also discussed in great length about new selected features (WSPCA) features along with their analysis. The sensitivity of mammography screening process is usually influenced by quality of image and radiologist’s expertise level since the majority of screening mammograms are benign, hence the proposed classification scheme can help a radiologist by handling this issue as well. All tests display that the projected method provides especially perfect outcomes.
ACKNOWLEDGEMENTS
The writers are thankful to the Babylon University, Iraq for providing study means in achieves this project.
REFERENCES
[1] DeSantis, C., R. Siegel, "Breast cancer statistics, 2011." CA, A Cancer
[2] N. Naveed, T. S. Choi and M. A. Jaffar, “Malignancy and abnormality detection of mammograms using DWT features and
ensembling of classifiers”, International
Journal of the Physical Sciences Vol. 6(8), pp.
2107–2116, 2011 April 18.
[3] M. Wallis, M. Walsh and J. Lee, “A review of false negative mammography in a ymptomatic population", Clin. Radiology, vol. 44, pp. 13-15,
1991.
[4] J. Tang, R. Rangayyan, J. Xu, I. El Naqa and Y.
Yang,“Computer-aided detection and
diagnosis of breast cancer with mammography:
Recent advances”, Information Technology in
Biomedicine, IEEE Transactions on 13(2), 2009
pp. 236–251.
[5] G. Kom, A. Tiedeu and M. Kom, “Automated detection of masses in mammograms by local
adaptive thresholding”, Comput. Biol. Med. 37(1), 2007 pp. 37–48.
[6] N. Eltonsy, G. Tourassi and A. Elmaghraby, “A
concentric morphology model for the
detection of masses in mammography”, Medical
Imaging, IEEE Transactions on 26(6), 2007, pp.
880–889.
[7] Kaul, K. and F. M.-L. Daguilh, "Early detection of breast cancer, is mammography enough?"
Hospital Physician 38(9),2002, 49-54.
[8] Brodersen, J. and V. D. Siersma, "Long-term psychosocial consequences of false-positive
screening mammography." The Annals of
Family Medicine, 2013, 11(2): 106-115.
[9] Hui ZOU, Trevor Hastie, and Robert Tibshirani, " Sparse Principal Component nalysis". Journal
of Computational and Graphical Statistics,
Volume 15, Number 2, 2006, Pages265– 286DOI:. 1198/106186006X113430.
[10] Kendall, E. J. and M. T. Flynn, "Automated Breast Image Classification Using Features
from Its Discrete Cosine Transform." PloS one
9(3): e91015, 2014.
[11] X. Wang, B. Zheng, W. F. Good, J. L. King and Y. Chang, “Computer assisted diagnosis of breast cancer using a data-driven bayesian
belief network”, International Journal of
Medical Informatics, 54(2):115–126, (1999)
May. Techniques Accuracy (%) Sensitivity (%) Specificity (%) KNN 76.2 77.2 77.5 Neural Network 85.3 84.1 85.3 SVM 86.3 87 87.3 Bayesian 87.3 89.3 89.6 International Journal of Multimedia and Ubiquitous Engineering Vol. 7, No. 2, April, 2012 363.
[12] I. T. Jolliffe, “Principal Component Analysis”, Springer-Verlag, 1986, pp. 487.
[13] R. Campanini, D. Dongiovanni, E. Iampieri, N. Lanconelli, M. Masotti, G. Palermo, A. Riccardi, M. Roffilli, “A novel featureless approach to mass detection in digital mammograms based on support vector
machines”, Phys. Med. Biol., 2004, 49:
961-975.
[14]Q. Guo, J. Shao and V. Ruiz, “Investigation of support vector machine for the detection of architectural distortion in mammographic images”, J. Phys. Conf. Ser., 2005, 15: 88–94. [15] Kom, G., A. Tiedeu, "computerized detection
of masses on mammograms by entropy
maximization thresholding." The Abdus Salam
6264 [16] Maitra, I. K., S. Nag, "Technique for
preprocessing of digital mammogram."
Computer methods and programs in
biomedicine 107(2), 2012, 175-188.
[17] Vállez, N., G. Bueno, "Breast density classification to reduce false positives in CADe
systems." Computer methods and programs in
biomedicine, 2014, 113(2): 569-584.
[18] Shanthi, S. and V. M. BHASKARAN (2014). "A novel approach for classification of abnormalities in digitized mammograms."
Sadhana 39(Part 5) 2014.
[19] Tahmasbi, A., F. Saki, "Classification of benign and malignant masses based on Zernike
moments." Computers in biology and medicine
2011, 41(8): 726-735.
[20] Liu, B., H. D. Cheng, "Fully automatic and segmentation- robust classification of breast tumors based on local texture analysis of ultrasound images." Pattern Recognition 43(1): 280-298, 2010.
[21] Du, J., L. Wang, "Differentiating benign from malignant solid breast lesions: combined utility of conventional ultrasound and contrast-enhanced ultrasound in comparison with
magnetic resonance imaging." European
journal of radiology, 2012, 81(12): 3890-3899.
[22] Eltoukhy, M. M. and I. Faye, "An Optimized Feature Selection Method For Breast Cancer Diagnosis in Digital Mammogram using
Multiresolution Representation." Applied
Mathematics & Information Sciences, 2014
8(6): 2921-2928.
[23] Salve, M. S. and V. Chakkarwar, "Classification of Mammographic images using
Gabor Wavelet and Discrete Wavelet
Transform." International Journal of advanced
research in ECE ISSN: 2278-909X 2: 573-578,
2013.
[24] Cheng, H., X. Shi, "Approaches for automated detection and classification of masses in mammograms." Pattern Recognition 2006, 39(4): 646-668.
[25] Ren, J., "ANN vs. SVM, which one performs better in classification of MCCs in mammogram
imaging." Know.-Based Syst. 2012, 26,
144-153.
[26] Karahaliou, A., Skiadopoulos, S., Boniatis, I., Sakellaropoulos, P., Likaki, E., Panayiotakis, G., "Texture analysis of tissue surrounding microcalcifications on mammograms for breast cancer diagnosis", 2014.
[27] Jalalian, A., Mashohor, S. B., Mahmud, H. R., Saripan, M. I. B., Ramli, A. R. B., & Karasfi, "Computer-aided detection/diagnosis of breast cancer in mammography and ultrasound" a
review. Clinical imaging, 2013, 37(3), 420-426.
[28] Jaleel, J. A. and S. Salim, "Mammogram mass classification based on discrete wavelet transform textural features" Advances in
Computing, Communications and Informatics
IEEE International Conference on ICACCI,
2014, 718-722.
[29] Ganesan, Karthikeyan, "Computer-aided breast cancer detection using mammograms: a
review." IEEE Reviews in biomedical
engineering 6 (2013): 77-98.
[30] Murala, S. and J. Wu, "Local Mesh Patterns Versus Local Binary Patterns: Biomedical Image Indexing and Retrieval.", 2014.
[31] Martins, L. d. O., A. M. d. Santos, " Classification of normal, benign and malignant tissues using co-occurrence matrix and Bayesian neural network in mammographic
images". Neural Networks, IEEE Proceedings
of the Ninth Brazilian Symposium on
SBRN'06,2006,24-29.
[32]Ganesan, Karthikeyan, "Automated diagnosis of mammogram images of breast cancer using discrete wavelet transform and spherical wavelet transform features: a comparative
study." Technology in cancer research &
treatment 13.6 (2014): 605-615.
[33]Qurat-ul Ain, S. M. Naqi and M. A. Jaffar, “Bayesian Classification Using DCT Features for Brain Tumor Detection”, Lecture Notes in
Computer Science, Volume 6276, Knowledge
-Based and Intelligent Information and
Engineering Systems, 2010, pp. 340-349.
[34] J. Suckling, “The Mammographic Image
Analysis Society Digital Mammogram
Database Exerpta Medica”, International
Congress Series 1069, 1994, pp. 375-378.
[35] Jolliffe, Ian T., Nickolay T. Trendafilov, and Mudassir Uddin, " A modified principal component technique based on the LASSO".
Journal of computational and Graphical
Statistics 12.3 (2003): 531-547.
[36]G. Strang, “The Discrete Cosine Transform,”
SIAM Review, Vol. 41, No. 1, (1999), pp.135-
147.
[37] P. Miller and S. Astley, “Automated detection of breast asymmetry using anatomical features”, in State of the Art in Digital
6265
Perception Artif. Intell., 9: 247-261, (1994).
[38] R. O. Duda, P. E. Hart and D.G. Stork, “Pattern
classification”, 2nd edition, John Wiley and
Sons, New York, (2001).
[39] Sutton, Clifton, "Classification and regression trees, bagging, and boosting". Handbook of statistics 24 (2005): 303-329.
[40] Quinlan J.R, "Induction of Decision Trees". 1986 Kluwer Academic Publishers, and Boston - Manufactured in The Netherlands,
Machine Learning 1: 81-106, 1986.
[41] Serifovic- Trbalic, A. Trbalic, " Classification of benign and malignant masses in breast
mammograms". Information and
Communication Technology, Electronics and
Microelectronics (MIPRO), 2014 37th
International Convention on, IEEE.
[42]Vaidehi, K., & Subashini, "Automatic Characterization of Benign and Malignant
Masses in Mammography". Procedia Computer
Science, 2015, 46, 1762-1769.
6266
Figure 1: Projected Technique
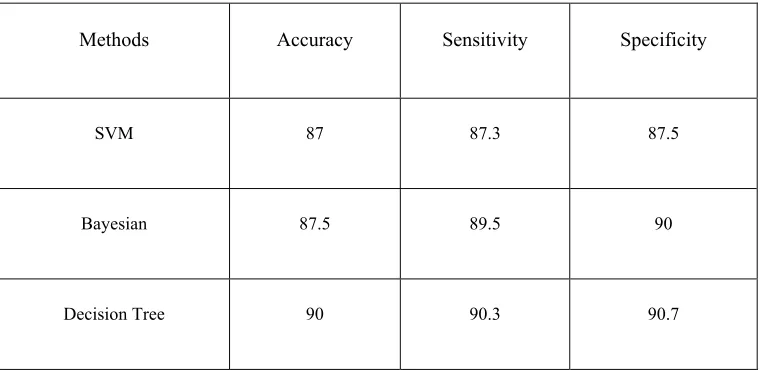
Table 1: Comparison of Achievement Measurement of Various Classifiers of MIAS dataset
Methods Accuracy Sensitivity Specificity
SVM 87 87.3 87.5
Bayesian 87.5 89.5 90
Decision Tree 90 90.3 90.7
[image:11.612.117.497.346.531.2]
6267
Table 2: Comparison of Achievement Measurement of Various Classifiers using (WSPCA) features from MIAS dataset
Classification Methods using (WSPCA) Features
Accuracy Sensitivity Specificity
SVM 95 93 98.5
Bayesian 93.5 91.3 96
Decision Tree 97.8% 95% 100
Table 3. Comparison with state-of-the-art techniques
Author(s)/Year Features/Classifiers Accuracy
(Tahmasbi et al., 2011) Shape and Margin features / Multi-Layer Perceptron
classifier 93.6%
(Salve and Chakkarwar, 2013) Discrete Wavelet Transform / Support Vector Machines 89%
(Serifovic-Trbalic et al., 2014) Shape and Margin features / Back propagation neural network
90.4%
(Vaidehi and Subashini, 2015) Automatic Characterization of Benign and Malignant Masses in Mammography/
93.7%
(Proposed Method, 2017) (WSPCA Features) / Decision Tree classifier 97.8%
[image:12.612.87.527.380.641.2]