http://dx.doi.org/10.4236/jectc.2014.43008
How to cite this paper: Atarashi, T., Tanaka, T., Tsubaki, S. and Hirasawa, S. (2014) Calculation Method for Forced-Air Con-vection Cooling Heat Transfer Coefficient of Multiple Rows of Memory Cards. Journal of Electronics Cooling and Thermal Control, 4, 70-77. http://dx.doi.org/10.4236/jectc.2014.43008
Calculation Method for Forced-Air
Convection Cooling Heat Transfer
Coefficient of Multiple Rows of
Memory Cards
Takayuki Atarashi1,2*, Tetsuya Tanaka1, Shigeyasu Tsubaki3, Shigeki Hirasawa2
1Hitachi, Ltd., Infrastructure Systems Company, Toshima, Tokyo, Japan 2Department of Mechanical Engineering, Kobe University, Kobe, Japan
3Hitachi, Ltd., Information and Telecommunication Systems Company, Hatano, Japan
Email: *[email protected]
Received 1 July 2014; revised 1 August 2014; accepted 30 August 2014 Copyright © 2014 by authors and Scientific Research Publishing Inc.
This work is licensed under the Creative Commons Attribution International License (CC BY).
http://creativecommons.org/licenses/by/4.0/
Abstract
Forced-air convection cooling of high-power electronic devices is widely used, but it has a problem that a rise in temperature of the air used to cool the upstream devices decreases the cooling capa-bility for the downstream devices. In this study we made an experimental apparatus including a memory card array and measured the effect of the rise in temperature of the air on the heat transfer coefficient of the memory cards that were downstream in the air flow. Using these mea-surements, we devised a simple calculation model, called the thermal diffusion layer model, to calculate the heat transfer coefficient of multiple rows of memory cards. The rise in temperature of downstream memory cards due to higher temperature air can be evaluated with a parameter representing the delay of thermal mixing for air. The heat transfer coefficient calculated with the thermal diffusion layer model agreed with our experimental results.
Keywords
Forced Convection, Heat Transfer Performance, LSI Cooling, Memory Array
1. Introduction
The heat density of high-load electronics, such as high-performance servers and the inverters used in vehicles, has been increasing as a result of higher processing speeds and higher power outputs. Focusing on the heat
den-*
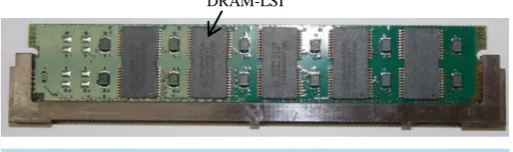
these reasons, we have been developing a forced-air convection cooling structure to cool multiple LSI (Large Scale Integration) packages and memory arrays that are mounted on a flat wiring board in electronic equipment. A parallel flow method is used in which the LSI packages and arrays are cooled sequentially by air that flows parallel to the wiring board. A problem with this method is that the heat from the upstream devices raises the temperature of the cooling air so that its cooling capability is decreased remarkably for the downstream devices. Yanagida [3] analyzed the temperature distribution of air after heating devices and proposed a method that used the thermal diffusion layer model to calculate temperature distribution of LSI packages on a printed wiring board. The authors developed highly efficient cooling methods using inclined strip fins and air-jet cooling me-thods that were not affected by an increase in the temperature of the cooling air [4] [5]. Kheirandish et al.[6] analyzed forced convective laminar flow in a channel with a heated obstacle attached to one wall. Recently, Nakayama [7] reviewed various cooling methods of electronic devices. In this work we study forced-air convec-tion cooling of multiple rows of memory cards placed on a printed wiring board. Each memory card has many DRAM-LSIs (Dynamic Random Access Memory LSIs) mounted on both sides (Figure 1). Some studies [8] on this topic reported on the cooling performance of a single memory card, but very few have dealt with rows of memory cards.
In this study, we made an experimental memory card apparatus with four rows in the flow direction and eight rows in the parallel direction. We measured the effect of a rise in the temperature of the air on the heat transfer coefficient of the downstream memory cards. Using these measurements, we then devised a simple model for calculating the heat transfer coefficient of multiple rows of memory cards. We compared the calculation and experimental results and found their values to be in good agreement.
2. Experimental Apparatus
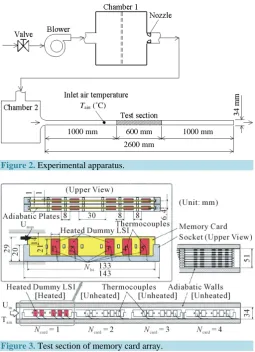
Figure 2 shows the experimental apparatus. The test section is placed in an acryl duct. The outside of the duct is thermally insulated with 50-mm-thick of glass wool. Cooling air from a blower flows into the test section after flow rate G and temperature Tain are measured in chambers 1 and 2. Figure 3shows the test section. Memory cards are four rows in the flow direction and eight rows in the parallel direction in the duct. Each memory card has five model-LSIs mounted on both sides. In the heat transfer experiment, any one of the four rows in the flow direction is replaced with heating model-LSIs and others are non-heating model-LSIs. The heating model-LSI is aluminum block with a stainless steel heater with heating rate Q of each model-LSI is 0.2 W. The surface tem-perature Ts of the heating model-LSI was measured with a T-type thermocouple, and the heat transfer coefficient
h was obtained using Equation (1).
(
)
S S ain
Q h
A T T
=
− (1)
Here, Tain is the inlet air temperature, and As is the surface area. Also, the surface temperatures of non-heating model-LSIs were measured with thermocouples. In this paper, the number of rows of memory cards in the flow
[image:2.595.185.442.636.712.2]DRAM-LSI
Tain (˚C)
1000 mm 1000 mm
[image:3.595.186.442.83.436.2]2600 mm 600 mm
Figure 2. Experimental apparatus.
Figure 3. Test section of memory card array.
direction is expressed as Ncard = 1 - 4 and number of rows of the memory LSIs in each card is expressed as Nlsi = 1 - 5.
3. Experimental Results of Temperature Rise of LSIs and Thermal Diffusion
Layer Model
First, we measured the temperature rise of non-heating LSIs when they were heated by the air flow from the up-stream memory card. Figure 4 shows the experimental results of the temperature rise ΔTa of the non-heating
LSIs at the Nlsi = 1 or 5 position on the downstream memory cards at the Ncard = 2 - 4 positions when the heating memory card was placed at the Ncard = 1 - 3 positions. Figure 5 shows the parameter αt= ΔTa/ΔTmwhich means
the delay of thermal mixing in air, ΔTais the measured temperature rise of the non-heating LSI, and ΔTmis the
calculated temperature rise of completely mixed air. The temperature rise ΔTmwas calculated with the air flow
rate and heating rate of the LSI. When the air is not mixed completely, αt is larger than 1. The parameter αt
de-creases downstream and comes close to 1 at all heating memory card positions, Ncard.
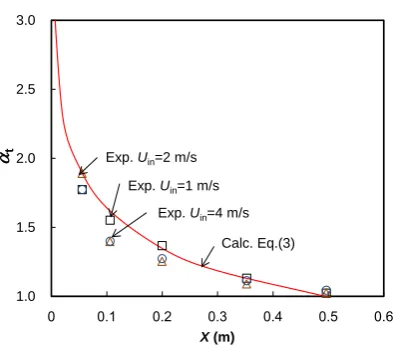
Figure 6 shows the relation between the delay of thermal mixing in air αt and the distance from the heat
source X for various heating positions and flow velocities. We can obtain the relationship between the parameter
αt and the distance from the heat source X, similar to the thermal diffusion layer model proposed by Yanagida
[3].
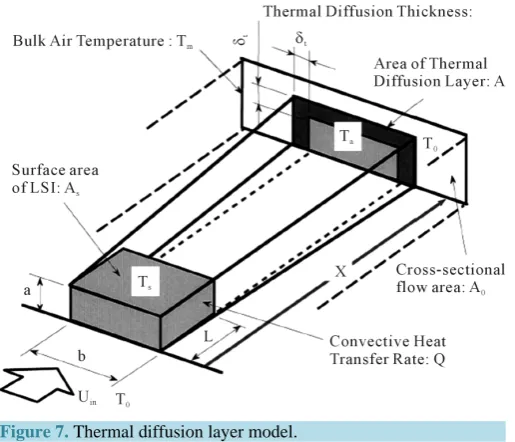
Figure 7 shows the thermal diffusion layer model for our experimental apparatus. The dimensions of the heating LSI were as follows: height a = 1 mm, width b = 21 mm, and length L = 10 mm. The area of the thermal diffusion layer A is wider than the front area of the LSI (a ×b) by the thermal diffusion thickness δt. Hence, we
can write A = (a ×b) + (2a + b) ×δt. The delay in thermal mixing in the air flow αt= ΔTa/ΔTm can be calculated
Figure 4.Temperature rise of LSIs.
Figure 5.Delay of thermal mixing in air.
Figure 6. Relation between delay of thermal mixing in air and distance from heat source.
0 2 4 6
∆
Ta
(
°
C
)
LSI position
Uin=2 m/s
Q=0.2 W
Ncard = 2 2 3 3 4 4
Nlsi = 1 5 1 5 1 5
1 1.1 1.2 1.3 1.4 1.5
αt
LSI position
Uin=2 m/s
Ncard = 2 2 3 3 4 4
Nlsi = 1 5 1 5 1 5
Heated
Ncard = 1 Heated
Ncard = 3
Heated
Ncard = 2
1.0 1.5 2.0 2.5 3.0
0 0.1 0.2 0.3 0.4 0.5 0.6
αt
X (m) Calc. Eq.(3) Exp. Uin=2 m/s
Exp. Uin=4 m/s
[image:4.595.215.412.518.693.2]Figure 7.Thermal diffusion layer model.
to X , and the proportionality constant is obtained using our experimental data shown in Figure 6, as follows:
0.0032
t X
δ = (2)
The parameter αt and the distance from the heat source X have following relationship using Equation (2):
(
)
0 0
0.0032 2
t
A A
A ab a b X
α = =
+ + (3)
Calculation results with Equation (3) agree with the experimental results in Figure 6.
4. Experimental Results of Heat Transfer Coefficient and Comparison with
Calculation Using Thermal Diffusion Layer Model
Figure 8 shows the experimental results of the heat transfer coefficient h of LSIs at the Nlsi = 1 - 5 positions on the memory card at the Ncard = 1 position with a change in the inlet air velocity uin when the heating memory card was placed at the Ncard = 1 position. We see that the heat transfer coefficient h of the downstream LSIs is lower than that of the upstream LSIs, because of the temperature rise in the air flow.
The heat transfer coefficient hS on a flat surface of a single LSI can be calculated with the following equations
[9] by using the Reynolds number, max
a
Re u L
ν
= :
0.5 0.33 a
S 0.664 Re Pra h
L
λ
= (4)
Here, umax is the air velocity above the LSI’s surface, L is the length of LSI, νa is the dynamic viscosity of air, Pra is the Prandtl number of air, and λa is thermal conductivity. The broken line in Figure 8shows the result of calculation hS using Equation (4), and it agrees with the experimental results of the Nlsi = 1 data.
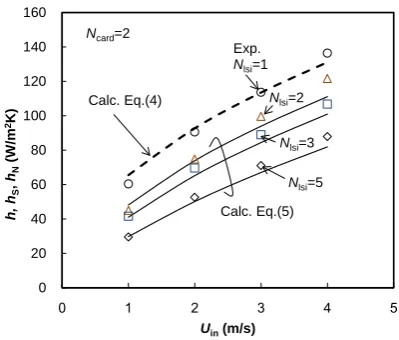
Next, we calculated the heat transfer coefficient hN coupled with the temperature rise in air using αt. The heat
transfer coefficient hN can be calculated with the following equation:
N 1
S , 1
p S
1 1
N
t i i h
A
GC α h
−
−
=
+
∑
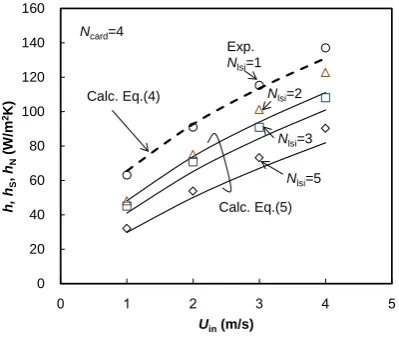
(5)1 and 5 positions on the memory cards at the Ncard = 2 and 4 positions when all memory cards at the Ncard = 1 - 4 positions are heating. The results of the calculation with Equation (5) agree with the experimental results. Therefore, the thermal diffusion layer model of Equation (5) is a precise calculation of heat transfer coefficient of multiple rows of memory cards, despite that it is very simple. Our proposal of the thermal diffusion layer model of Equation (5) is thus very practical.
5. Conclusions
[image:6.595.213.414.320.489.2]We made an experimental apparatus including a memory card array and measured the effect of a rise in the temperature of air on the heat transfer coefficient of memory cards at downstream positions in the air flow. Us-ing these measurements, we proposed a simple calculation model of the heat transfer coefficient of multiple rows of memory cards. The following results were obtained.
Figure 8. Heat transfer coefficient of LSIs Nlsi = 1 - 5
[image:6.595.213.413.523.693.2]on memory card Ncard = 1.
Figure 9. Heat transfer coefficient of LSIs Nlsi = 1 - 5
on memory card Ncard = 2.
0 20 40 60 80 100 120 140 160
0 1 2 3 4 5
h, h S , hN (W /m 2K)
Uin(m/s)
Calc. Eq.(4)
Exp.
Nlsi=1
Calc. Eq.(5)
Nlsi=3
Nlsi=2
Nlsi=5
Ncard=1
0 20 40 60 80 100 120 140 160
0 1 2 3 4 5
h, h S , hN (W /m 2K)
Uin(m/s)
Calc. Eq.(4)
Calc. Eq.(5)
Nlsi=3
Nlsi=2
Nlsi=5
Ncard=2
Exp.
Figure 10. Heat transfer coefficient of LSIs Nlsi = 1 -
[image:7.595.215.414.285.467.2]5 on memory card Ncard = 4.
Figure 11.Overall heat transfer coefficient.
1) The rise in temperature of the downstream LSI resulting from a temperature rise in the air heated by an up-stream heating source can be evaluated with a parameter called the delay of thermal mixing in air, αt. The
para-meter αt decreases downstream and comes close to 1 at a large distance from the heat source X and αt does not
depend on the heating position or flow velocity.
2) The heat transfer coefficient coupled with the rise in temperature of the air through the parameter αt can be
calculated with Equation (5) and the thermal diffusion layer model. The calculation agreed with the experimen-tal results. There results indicate that the thermal diffusion layer model is a simple and precise method of calcu-lating heat transfer coefficient of multiple rows of memory cards.
References
[1] Nakazato, N., Hirasawa, S. and Mato, T. (1998) Natural Convection Cooling in Vertical Finned Plates in a Cabinet for Communication Equipment. IEICE Transactions on Electronics, 3, 421-426.
[2] Toyoda, H. and Kondo, Y. (2013) Effect of Non-Condensable Gas Leakage on Long Term Cooling Performance of Loop Thermosyphon. Journal of Electronics Cooling and Thermal Control, 3, 131-135.
http://dx.doi.org/10.4236/jectc.2013.34014
[3] Yanagida, T. (1988) A Calculation Method for Temperature Distribution of IC Packages on a Printed Wiring Board.
Transactions of JSME, Series B, 54, 1730-1735.
[4] Atarashi, T., Hatada, T. and Daikoku, T. (1994) Forced Air Cooling Radiators for Electronic Equipment. Transactions
of JSME, Series B, 60, 620-626.
0 20 40 60 80 100 120 140 160
0 1 2 3 4 5
h, h S , hN (W /m 2K)
Uin(m/s)
Calc. Eq.(4)
Calc. Eq.(5)
Nlsi=3
Nlsi=2
Nlsi=5
Ncard=4
Exp.
Nlsi=1
0 20 40 60 80 100
0 1 2 3 4 5
ho ver al l (W /m 2K)
Uin(m/s)
Exp. Ncard=2, Nlsi=1
Calc. Eq.(5)
Ncard=2, Nlsi=5
Ncard=4, Nlsi=1
[8] Yoneda, N., Arita, J. and Hosokawa, K. (1999) Thermal Analysis of Memory Module. Proceedings of JSME Thermal
Engineering Conference, 31-32.