The behavior and performance of major
types of futures traders
Wang, Changyun
National University of Singapore
December 2001
Online at
https://mpra.ub.uni-muenchen.de/36426/
P
ERFORMANCE OF
M
AJOR
T
YPES OF
F
UTURES
T
RADERS
CHANGYUN WANG
This article examines the behavior and performance of speculators and hedgers in 15 U.S. futures markets. We find that after controlling for mar-ket risk factors, speculators are contrarians, but respond positively to market sentiment. In contrast, hedgers engage in positive feedback trading and trade against market sentiment. We also find that trades of speculators (hedgers) are positively (negatively) correlated with subsequent abnormal returns; however, it does not appear that speculators possess superior fore-casting power. Therefore, hedging pressure effects likely explain the nega-tive relation between the performance of speculators and hedgers. The positive feedback trading by hedgers together with their negative perform-ance suggests that hedgers have a destabilizing impact on futures prices. © 2003 Wiley Periodicals, Inc. Jrl Fut Mark 23:1–31, 2003
The author thanks an anonymous referee, Chris Gilbert, Ray Chou, and participants at the 12th CBOT Asia Pacific Futures Research Symposium for their helpful comments. Excellent computa-tional assistance from Bangwei Lim is greatly acknowledged.
For correspondence, Changyun Wang, Department of Finance and Accounting, School of Business, National University of Singapore, 10 Kent Ridge Crescent, Singapore 119260; e-mail: [email protected]
Received December 2001; Accepted July 2002
■ Changyun Wang is a professor in the Department of Finance and Accounting in the
School of Business at the National University of Singapore in Singapore.
1See data description section for more details on trader classification in the COT data.
INTRODUCTION
How investors actually behave, what affects their trading decisions, and how traders perform have been questions of great interest to both aca-demics and financial market practitioners. Answers to such questions are central to understanding the impact of trades by different traders on asset prices and to understanding the process of asset price formation. Extant research has predominantly analyzed the behavior and perform-ance of institutional investors in equity markets, in particular, mutual funds. However, little is known about the behavior and performance of futures traders.
This article adds to the literature by providing evidence on the behavior and performance of major types of traders in 15 futures mar-kets using the CFTC’s (Commodity Futures Trading Commission) COT (Commitments of Traders) data. A unique feature of the COT dataset is that it provides a decomposition of futures positions by categorized traders—hedgers and speculators—on the basis of whether a reportable position is taken primarily for hedging purposes as defined by the CFTC.1 The primary focus of this study is on the following two issues.
First, we investigate the relation between net futures positions by type of trader and lag returns, market sentiment, as well as information vari-ables, to understand the determinants of trading decisions. Second, we examine the performance of trades by type of trader for evidence of hedging pressure effects and/or market timing ability possessed by a trader type. A side benefit of analyzing simultaneously the behavior and performance of a trader type is that this allows for the inference of whether a trader type has a destabilizing effect on futures prices. Evidence of feedback trades itself does not imply market destabilization if these trades incorporate fundamental information into prices; howev-er, positive feedback trading together with the negative performance of a trader type suggests that the trader type has a tendency to push prices away from the fundamental value, and thus destabilizes the market (e.g., Lakonishok et al., 1992).
Shiller, 1984). Importantly, different trading motives predict divergent performance across investor types. If an investor trades for hedging rea-sons, asset prices must decrease (increase) to attract speculators to buy (sell) (e.g., Llorente et al., 2001; Merton, 1973, 1987). If an investor who primarily speculates on private information buys (sells) the asset, reflecting the positive (negative) private information about the asset’s future payoff, the subsequent price will rise (fall) (e.g., Llorente et al., 2001; Wang, 1994). When a trader underreacts (overreacts) to news, the resultant asset prices exhibit momentum (reversals) (e.g., Hong & Stein, 1999; Jegadeesh & Titman, 1993; Lakonishok et al., 1992). Although various empirical tests have been performed to study equity investor behavior and performance, the corresponding evidence in futures mar-kets is scant. This study attempts to fill in the gap. An analysis of the behavior and performance of speculators and hedgers is of particular interest because it is widely held that, to transfer nonmarketable risks, hedgers are required to pay a significant premium to speculators for risk bearing services, which is usually termed the “hedging pressure effect.” As a result, the trades of hedgers are necessarily to be negatively corre-lated with subsequent returns, whereas the trades of speculators are in the same direction as future market movements.
Our results indicate that, after controlling for the information vari-ables that have been shown to be priced risk factors in futures markets, hedgers increase (decrease) net positions if the previous month’s futures prices rose (fell), but respond negatively to lag changes in market senti-ment. In contrast, speculators increase (decrease) net positions if the previous month’s prices declined (increased), and respond positively to lag changes in sentiment. Therefore, hedgers tend to engage in positive feedback trading, whereas speculators are contrarians. Analyses of post-feedback trade returns reveal that trades of hedgers are negatively corre-lated with future abnormal returns, namely, hedgers increase (decrease) net positions when the subsequent abnormal return is negative (posi-tive). By contrast, trades of speculators relate positively to future returns. This negative relation between the performance of speculators and hedgers is consistent with two hypotheses: first, hedging pressure effects prevail in futures markets; and second, speculators possess superior tim-ing ability. Our further evidence indicates that the first hypothesis most likely explains our results.
the required option. For example,a synthetic put is created dynamically to ensure hedgers against an asset price falling below a certain level by increasing (decreasing) short futures positions when the market has fallen (risen). Several extant studies have also suggested that dynamic hedging can cause positive feedback trades (e.g.,Gennotte & Leland, 1990; Grossman,1988). The inverse relation between the behavior and performance of speculators and hedgers could have been deduced from an adding-up constraint—a hedger’s selling order most likely coincides with a speculator’s purchase order; however,this does not prevent us from drawing the inference that the distinct abnormal performance of hedgers and speculators reflects hedging pressure effects (e.g., Bessembinder,1992; De Roon et al.,2000; Hirshleifer,1988,1990).
In finance literature,concerns that positive feedback trading has a destabilizing impact on asset prices arise because positive feedback traders can push prices away from fundamentals. However,positive feed-back trading is not necessarily destabilizing if these traders drive asset prices toward the fundamental value. That is,trades by positive feedback traders are in the same direction of subsequent price changes (e.g., Lakonishok et al.,1992). Therefore,a simultaneous analysis of feedback trading and the performance of trades enables us to make an assessment of the impact of trades by type of trader on futures prices. Our result that hedgers engage in positive feedback trading and are associated with neg-ative performance suggests that hedgers have a destabilizing impact on futures prices over an intermediate (monthly) horizon. However,the con-trarian behavior of speculators along with their positive performance does not appear to be consistent with the popular view of destabilizing specu-lation in financial markets (e.g.,Hart & Kreps,1986; Stein,1987).
2It should be noted that this interpretation may be inaccurate. Ederington and Lee (2002) study a
finer dataset in the heating oil futures market and find that while “noncommercials” represent spec-ulators, the “commercials” group likely includes some traders with no known positions in the cash/forward markets. Nevertheless, this interpretation has been widely used in the literature (e.g., Bessembinder, 1992; Chang et al., 1997; De Roon et al., 2000). It is unclear from the COT reports whether the trading motive of nonreportable position holders is hedging or speculation, and there-fore, we exclude these traders from our analysis.
Related studies in futures markets include Chang (1985), Hartzmark (1987, 1991), Leuthold et al. (1994), and Wang (2001). These studies examine whether a trader type possesses forecasting power. Chang (1985) finds that, consistent with the theory of “normal backwardation,” speculators earn significant profits in three agricultural futures markets. Hartzmark (1987, 1991) shows that hedgers tend to earn profits in several futures markets; however, Leuthold et al. (1994) show that speculators possess superior forecasting ability in the frozen pork bellies futures market. More recently, Wang (2001) documents that speculators outperform hedgers in six agricultural futures markets, and finds no evidence of superior forecasting ability possessed by specula-tors. Therefore, the superior performance of speculators is consistent with the hedging pressure theory. However, none of the extant studies has investigated both the abnormal performance and determinants of trading decisions by type of trader in broad futures markets.
The remainder of this article is organized as follows. We first provide a description of our dataset. In the following sections, trading behavior and market-timing ability by type of trader are examined. The final sec-tion presents our conclusions.
DATA AND SAMPLE STATISTICS
Data on Trader Positions
This article analyzes monthly data on futures trader positions in 15 futures markets over the October 1992–March 2000 interval. The trader position data come from the CFTC’s COT reports,and are obtained from Pinnacle Data Corp.,New York. A virtue of the dataset is that it provides a decomposition of positions held by categorized traders on the basis of whether a trader holds a reportable commercial or noncommercial posi-tion as defined by the CFTC. Traders taking commercial posiposi-tions to hedge a specific risk are regarded as hedgers,and those who take non-commercial positions for reasons other than hedging are seen as spec-ulators.2 The positions in the COT reports represent closing positions
merchants,clearing members,and foreign brokers according to a trader’s principal activities. This trader position information has been published in the CFTC’s weekly COT reports on Fridays since October 1992,relat-ing to the clos1992,relat-ing positions on the preced1992,relat-ing Tuesdays. Our sample includes three financials (S&P 500,T-bill,T-bond),four agriculturals (corn,soybeans,wheat,world sugar),four commodities (cocoa,coffee, crude oil,heating oil),and four foreign currencies (British pound, Deutsche mark,Japanese yen,Swiss franc). See the Appendix for more detailed information on these futures contracts. The diversified nature of the sample allows for sufficient cross-sectional differences in the under-lying assets and market characteristics.
Data on Returns, Market Sentiment, and Information Variables
A continuous series of futures returns is created for each market. The return is measured as the percentage change in settlement prices of the contract with the nearest delivery date using a roll-over strategy. For example, a position is taken in the nearest-to-maturity contract until the delivery month in which the position switches to the second-nearest contract. To match the COT data, we construct a monthly return series, which is the holding-period return over a 4-week interval (Tuesday– Tuesday).
Bessembinder and Chan (1992) show that T-bill yield,default premi-um,and equity dividend yield are priced risk factors in futures markets. It is of interest to examine how these priced risk factors influence traders’ trading decisions and how traders perform after controlling for risk. Therefore,we collect data on the 3-month T-bill yield,Moody’s BAA-rated long-term corporate bond yield,AAA-rated corporate bond yield,and S&P 500 index dividend yield over the sample period. Data on futures prices and information variables are obtained from Datastream International.
We focus our analysis on monthly rather than weekly data because it is less likely for traders’ perception of risk to be changed over a short interval. Moreover, the choice of this time interval makes our results comparable to the previous studies on backwardation or hedging pres-sure theories (e.g., Bessembinder, 1992; Chang, 1985).
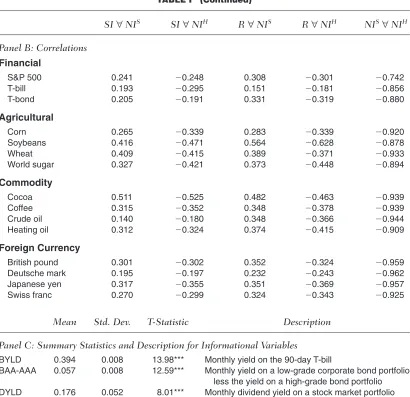
Table I presents summary statistics for the dataset. The results indi-cate that the average monthly return is positive for the S&P 500 index, T-bond,coffee,crude oil,heating oil,and Japanese yen futures,and neg-ative for the other markets; however,none is statistically different from zero except for the S&P 500 index futures. Zero-mean returns can be con-sistent with the absence of risk premiums in futures markets,while they cannot rule out the possibility of the existence of risk premiums that alter-nate signs depending on time varying risks. The mean investor sentiment is of similar magnitude for all markets,while investor sentiment is gener-ally less volatile in the financial futures than in the other markets.
The last two columns of Panel A present statistics for net positions of speculators and hedgers, respectively. Consistent with the conven-tional assumption in futures market studies, hedgers, on average, take on net short positions in the agricultural and commodity markets, whereas speculators’ positions are net long. In contrast, hedgers are net long, and speculators are net short in the financial and currency futures markets with the exception of the T-bill and T-bond futures. Net positions of speculators are generally smaller in magnitude than those of hedgers except with respect to corn futures. This implies that there are other traders in the market to take the remaining positions. Members of this trader type are usually termed “small traders” whose positions do not exceed the CFTC’s reporting threshold.
The correlations between sentiment, changes in net positions by type of trader, and returns are presented in Panel B. The results show that changes in speculator (hedger) positions are positively (negatively) associated with sentiment and returns, and there is a strong negative relation between changes in net positions of speculators and hedgers. The smallest correlation in absolute terms is present in the S&P 500 index futures (⫺0.742), while the largest correlation is in the Deutsche mark futures (⫺0.962). This strong correlation has implications for interpreting our results.
TABLE I
Summary Statistics (1993.1–2000.3)
Returns (%) Sentiment (%) Speculator Hedger
Std. Std. Std. Std.
Mean Dev. Mean Dev. Mean Dev. Mean Dev.
Panel A: Summary Statistics for Returns, Sentiment, and Net Positions
Financial
S&P 500 1.247 3.334 47.110 14.391 ⫺16.618 9.384 17.694 16.029 (2.23)**
T-bill ⫺0.026 0.261 46.515 17.477 0.872 2.317 ⫺3.913 3.951 (⫺1.21)
T-bond 0.081 2.357 43.654 15.754 12.790 30.435 ⫺15.370 44.593 (0.37)
Agricultural
Corn ⫺0.051 5.938 51.568 19.961 24.666 46.508 5.838 54.061 (⫺0.08)
Soybeans ⫺0.130 5.730 54.157 17.763 13.321 24.667 ⫺21.392 33.224 (⫺0.09)
Wheat ⫺0.289 6.146 50.866 18.118 6.233 11.052 ⫺11.979 11.826 (⫺0.38)
World sugar ⫺0.500 7.510 50.825 21.087 13.837 27.504 ⫺25.641 36.392 (⫺0.64)
Commodity
Cocoa ⫺0.322 6.601 48.540 16.670 5.414 11.224 ⫺12.761 14.244 (⫺0.19)
Coffee 0.698 13.029 48.026 20.707 3.804 6.251 ⫺8.300 7.727 (0.54)
Crude oil 0.222 7.435 47.814 20.056 7.553 26.258 ⫺7.961 36.897 (0.51)
Heating oil 0.065 7.720 44.272 22.501 2.673 9.413 ⫺17.376 13.579 (0.32)
Foreign Currency
British pound ⫺0.207 2.514 44.660 20.036 ⫺0.526 13.449 0.884 19.587 (⫺0.24)
Deutsche mark ⫺0.330 2.655 39.629 18.769 ⫺8.026 21.631 15.220 31.752 (⫺1.03)
Japanese yen 0.126 3.688 36.917 18.715 ⫺13.148 21.926 20.795 31.960 (0.42)
Swiss franc ⫺0.251 3.097 38.760 19.343 ⫺5.801 15.348 10.616 22.182 (⫺0.06)
TABLE I (Continued)
SI∀NIS SI∀NIH R∀NIS R∀NIH NIS∀NIH
Panel B: Correlations
Financial
S&P 500 0.241 ⫺0.248 0.308 ⫺0.301 ⫺0.742 T-bill 0.193 ⫺0.295 0.151 ⫺0.181 ⫺0.856 T-bond 0.205 ⫺0.191 0.331 ⫺0.319 ⫺0.880
Agricultural
Corn 0.265 ⫺0.339 0.283 ⫺0.339 ⫺0.920 Soybeans 0.416 ⫺0.471 0.564 ⫺0.628 ⫺0.878 Wheat 0.409 ⫺0.415 0.389 ⫺0.371 ⫺0.933 World sugar 0.327 ⫺0.421 0.373 ⫺0.448 ⫺0.894
Commodity
Cocoa 0.511 ⫺0.525 0.482 ⫺0.463 ⫺0.939 Coffee 0.315 ⫺0.352 0.348 ⫺0.378 ⫺0.939 Crude oil 0.140 ⫺0.180 0.348 ⫺0.366 ⫺0.944 Heating oil 0.312 ⫺0.324 0.374 ⫺0.415 ⫺0.909
Foreign Currency
British pound 0.301 ⫺0.302 0.352 ⫺0.324 ⫺0.959 Deutsche mark 0.195 ⫺0.197 0.232 ⫺0.243 ⫺0.962 Japanese yen 0.317 ⫺0.355 0.351 ⫺0.369 ⫺0.957 Swiss franc 0.270 ⫺0.299 0.324 ⫺0.343 ⫺0.925
Mean Std. Dev. T-Statistic Description
Panel C: Summary Statistics and Description for Informational Variables
BYLD 0.394 0.008 13.98*** Monthly yield on the 90-day T-bill
BAA-AAA 0.057 0.008 12.59*** Monthly yield on a low-grade corporate bond portfolio less the yield on a high-grade bond portfolio DYLD 0.176 0.052 8.01*** Monthly dividend yield on a stock market portfolio
Note. The return is measured as the percentage change in settlement prices of a futures contract over a 4-week interval. Investor sentiment is proxied by the Consensus index, in percent. Net positions are defined as the long positions less the short positions of a trader type on the basis of the CFTC’s COT reports, in units of 1,000 contracts. BYLD is the monthly yield on the 3-month Treasury bills. BAA-AAA is the monthly yield on the Moody’s BAA-rated bonds less the yield on AAA-rated bonds. DYLD is the monthly dividend yield on the S&P 500 index. SI᭙NIS(H)denotes the correlation between
senti-ment index and net positions of speculators (hedgers). R᭙NIS(H)denotes the correlation between returns and changes in
net positions of speculators (hedgers). N IS
᭙N IHis the correlation between changes in net positions of speculators and
hedgers. The numbers in parentheses are t-statistics relevant to the hypothesis that the relevant parameter is zero.
BUY OR SELL BEHAVIOR BY TYPE OF TRADER
Determinants of Trading Decisions
3In this study, a month represents a 4-week interval (Tuesday–Tuesday). This ensures that all
obser-vations are on Tuesday, matching the COT data.
4The Treasury bill yield is nonstationary,and thus,the change in Treasury bill yield is used in this study.
Nofsinger and Sias (1999),and Grinblatt and Keloharju (2000) show that investors most likely condition their trades on past returns,exhibiting negative/positive feedback trading behavior. Shiller (1984) and De Long et al. (1990) posit that the influences of fad and fashion are likely to impact traders’ investment decisions. In the finance literature,certain common information variables,including T-bill yield,equity dividend yield,and default premium,have been shown to have forecasting power in futures markets (e.g.,Bessembinder & Chan,1992; Bjornson & Carter,1997). These information variables likely have an effect on traders’ decisions. Therefore,in this study we are interested in how lag investor sentiment,returns,and common information variables influence trading decisions by type of trader.
Empirical Tests
We test the determinants of trading decisions by type of trader by esti-mating the following equation for each market:
(1)
where represents the change in net positions of trader type i in month t⫹1,3 and i denotes speculators and hedgers. A net position is
defined as the long position less the short position of a trader type, in units of 1,000 contracts. SIt denotes the change in the Consensus index in month t. Rtis the futures return in month t, in percent. ⌽tis a set of
common information variables available to all investors in month t, including: (i) the monthly yield on 3-month T-bills, representing the short-term discount rate or expected inflation;4 (ii) the monthly yield on
Moody’s BAA-rated long-term corporate bonds less the yield on AAA-rated corporate bonds, representing a premium of default risk; and (iii) the monthly dividend yield on the S&P 500 index, which tends to be higher during periods of slow economic growth or recessions (e.g., Fama & French, 1989), and is regarded as a signal for risk premium.
Results
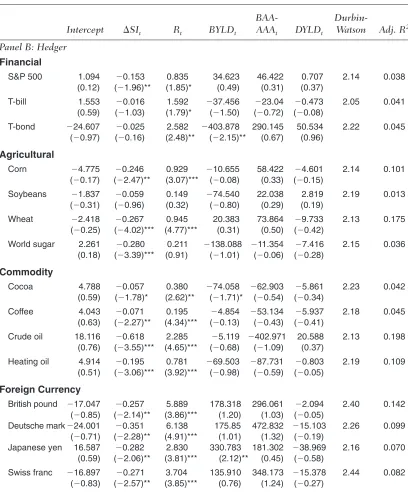
The results of estimating Equation (1) are reported in Table II. There are 97 monthly observations for each regression. Panel A presents the regres-sion results for speculators. The coefficient estimate for lag changes in
¢NIti⫹1
¢NIti⫹1⫽ ai
TABLE II
Changes in Net Positions, and Lag Changes in Sentiment, Returns, as Well as Information Variables
BAA-
Durbin-Intercept ⌬SIt Rt BYLDt AAAt DYLDt Watson Adj. R2
Panel A: Speculator
Financial
S&P 500 ⫺3.233 0.023 ⫺0.359 ⫺13.63 ⫺51.613 4.098 2.12 0.031 (⫺0.41) (0.54) (⫺1.93)* (⫺0.42) (⫺0.33) (0.29)
T-bill ⫺0.599 0.014 ⫺1.413 17.466 17.469 ⫺0.520 2.20 0.029 (⫺0.30) (1.09) (⫺2.14)** (0.92) (0.93) (⫺0.19)
T-bond 29.868 0.215 ⫺1.607 84.791 ⫺526.452 ⫺3.039 2.15 0.025 (1.45) (1.16) (⫺1.71)* (0.53) (⫺1.76)* (⫺0.11)
Agricultural
Corn 4.277 0.489 ⫺0.705 2.809 ⫺71.941 1.656 2.05 0.078 (0.35) (4.18)*** (⫺2.46)** (0.03) (⫺0.42) (0.07)
Soybeans 2.786 0.055 ⫺0.126 73.376 ⫺38.847 ⫺2.935 1.92 0.019 (0.54) (0.99) (⫺1.17) (0.79) (⫺0.54) (⫺0.22)
Wheat 1.605 0.219 ⫺0.699 ⫺24.452 ⫺54.397 7.730 2.13 0.154 (0.19) (3.81)*** (⫺4.31)*** (⫺0.46) (⫺0.43) (0.39)
World sugar ⫺2.195 0.222 ⫺0.063 76.544 19.655 4.851 2.14 0.054 (⫺0.25) (3.66)*** (⫺0.39) (0.82) (0.13) (0.24)
Commodity
Cocoa ⫺4.055 0.057 ⫺0.279 56.221 41.899 7.956 2.10 0.041 (⫺0.57) (1.77)* (⫺2.28)** (1.57) (0.42) (0.56)
Coffee ⫺3.449 0.064 ⫺0.162 17.622 46.546 4.761 2.16 0.045 (⫺0.56) (2.16)** (⫺3.86)*** (0.39) (0.38) (0.34)
Crude oil ⫺10.779 0.439 ⫺1.498 2.928 253.189 ⫺16.937 2.12 0.166 (⫺0.64) (3.40)*** (⫺3.99)*** (0.03) (0.95) (⫺0.43)
Heating oil ⫺1.809 0.189 ⫺0.556 ⫺9.898 ⫺52.488 ⫺6.605 2.09 0.149 (⫺0.28) (4.04)*** (⫺4.20)*** (⫺0.24) (⫺0.53) (⫺0.36)
Foreign Currency
British pound 12.046 0.196 ⫺3.956 ⫺125.886 ⫺209.512 1.156 2.29 0.134 (0.84) (2.35)** (⫺3.73)*** (⫺1.18) (⫺0.99) (0.08)
Deutsche mark 15.929 0.238 ⫺4.074 ⫺141.139 ⫺317.010 11.253 2.24 0.084 (0.66) (2.22)** (⫺4.38)*** (⫺1.14) (⫺1.24) (0.21)
Japanese yen ⫺9.073 0.204 ⫺1.701 ⫺191.941 87.701 24.711 2.14 0.050 (⫺0.49) (2.24)** (⫺3.37)*** (⫺1.91)* (0.31) (0.53)
Swiss franc 11.285 0.202 ⫺2.465 ⫺110.319 ⫺238.945 11.878 2.13 0.081 (0.88) (2.97)*** (⫺3.75)*** (⫺0.86) (⫺1.26) (0.29)
TABLE II (Continued)
BAA-
Durbin-Intercept ⌬SIt Rt BYLDt AAAt DYLDt Watson Adj. R2
Panel B: Hedger
Financial
S&P 500 1.094 ⫺0.153 0.835 34.623 46.422 0.707 2.14 0.038 (0.12) (⫺1.96)** (1.85)* (0.49) (0.31) (0.37)
T-bill 1.553 ⫺0.016 1.592 ⫺37.456 ⫺23.04 ⫺0.473 2.05 0.041 (0.59) (⫺1.03) (1.79)* (⫺1.50) (⫺0.72) (⫺0.08)
T-bond ⫺24.607 ⫺0.025 2.582 ⫺403.878 290.145 50.534 2.22 0.045 (⫺0.97) (⫺0.16) (2.48)** (⫺2.15)** (0.67) (0.96)
Agricultural
Corn ⫺4.775 ⫺0.246 0.929 ⫺10.655 58.422 ⫺4.601 2.14 0.101 (⫺0.17) (⫺2.47)** (3.07)*** (⫺0.08) (0.33) (⫺0.15)
Soybeans ⫺1.837 ⫺0.059 0.149 ⫺74.540 22.038 2.819 2.19 0.013 (⫺0.31) (⫺0.96) (0.32) (⫺0.80) (0.29) (0.19)
Wheat ⫺2.418 ⫺0.267 0.945 20.383 73.864 ⫺9.733 2.13 0.175 (⫺0.25) (⫺4.02)*** (4.77)*** (0.31) (0.50) (⫺0.42)
World sugar 2.261 ⫺0.280 0.211 ⫺138.088 ⫺11.354 ⫺7.416 2.15 0.036 (0.18) (⫺3.39)*** (0.91) (⫺1.01) (⫺0.06) (⫺0.28)
Commodity
Cocoa 4.788 ⫺0.057 0.380 ⫺74.058 ⫺62.903 ⫺5.861 2.23 0.042 (0.59) (⫺1.78)* (2.62)** (⫺1.71)* (⫺0.54) (⫺0.34)
Coffee 4.043 ⫺0.071 0.195 ⫺4.854 ⫺53.134 ⫺5.937 2.18 0.045 (0.63) (⫺2.27)** (4.34)*** (⫺0.13) (⫺0.43) (⫺0.41)
Crude oil 18.116 ⫺0.618 2.285 ⫺5.119 ⫺402.971 20.588 2.13 0.198 (0.76) (⫺3.55)*** (4.65)*** (⫺0.68) (⫺1.09) (0.37)
Heating oil 4.914 ⫺0.195 0.781 ⫺69.503 ⫺87.731 ⫺0.803 2.19 0.109 (0.51) (⫺3.06)*** (3.92)*** (⫺0.98) (⫺0.59) (⫺0.05)
Foreign Currency
British pound ⫺17.047 ⫺0.257 5.889 178.318 296.061 ⫺2.094 2.40 0.142 (⫺0.85) (⫺2.14)** (3.86)*** (1.20) (1.03) (⫺0.05)
Deutsche mark⫺24.001 ⫺0.351 6.138 175.85 472.832 ⫺15.103 2.26 0.099 (⫺0.71) (⫺2.28)** (4.91)*** (1.01) (1.32) (⫺0.19)
Japanese yen 16.587 ⫺0.282 2.830 330.783 181.302 ⫺38.969 2.16 0.070 (0.59) (⫺2.06)** (3.81)*** (2.12)** (0.45) (⫺0.58)
Swiss franc ⫺16.897 ⫺0.271 3.704 135.910 348.173 ⫺15.378 2.44 0.082 (⫺0.83) (⫺2.57)** (3.85)*** (0.76) (1.24) (⫺0.27)
5For example, Bodie and Rosansky (1980) showed that substantial benefits were available to
investors by combining portfolios of commodities and stocks, because of their negative correlation arising from opposite inflation sensitivities.
sentiment is positive and significant for all except the financial and soybean futures markets (insignificant,however),whereas the coefficient for lag returns is negative and significant. This suggests that,after con-trolling for risk factors,speculators increase net positions when the mar-ket has turned bullish,but decrease net positions if futures prices appre-ciated over the previous month,and vice versa. Thus,speculators respond positively to market sentiment and exhibit contrarian behavior. Take the corn futures as an example: if prices appreciated by 1 percentage point over the previous month,speculators cut back net positions by 705 con-tracts; however,they increase net positions by 489 contracts if the Consensus index rose by 1 percentage point.
It appears that the information variables do not significantly influ-ence the trading decisions of speculators. The coefficient estimates for information variables are statistically significant only in two cases: changes in T-bill yield for the Japanese yen futures and default premium for the T-bond futures. Overall, the coefficient estimates for changes in T-bill yield and default premium are more likely to be negative than pos-itive. This result tends to be consistent with the rationale that expected inflation and default premium are associated with negative expected pre-miums, and therefore, speculators cut back net positions (e.g., Bessembinder & Chan, 1992; Bjornson & Carter, 1997). The positive coefficients for changes in T-bill yield for interest rate and some physical commodity futures suggest that these assets provide a natural hedge to the types of risk.5 Moreover, the effect of information variables on the
trading decisions of speculators is larger in magnitude in currency futures than in the other markets; however, dividend yield appears to have no discernable effects on traders’ strategies in these markets.
6Lynch (2001) provides evidence on the impact of return predictability on investors’ multiperiod
equity portfolio choices. He shows that return predictability of information variables can tilt equity investors’ portfolios away from high book-market and small-size stocks. Thus, hedging demands pro-vide an explanation for the size and book-market effects.
7See Hull (2000, pp. 331–334) for a detailed description of this type of hedging strategy.
month; however, if the sentiment index rose by 1 percentage point, they cut back net positions by 246 contracts.
Although significant only in a few cases, the coefficient estimates for information variables for hedgers have opposite signs to those for speculators. This result tends to be in line with the “hedging demand” argument of Merton (1973). Because the available investment opportu-nities change as the information variables vary, Merton shows that investors may hedge these changes by investing in a way that gives them higher wealth precisely when investment opportunities are unattractive, i.e., when expected returns are low. Therefore, hedgers adjust their posi-tions as a way of hedging against movements in expected returns, as con-trasted with the behavior of speculators.6
Positive feedback trading by hedgers is not inconsistent with common hedging practices,for example,creating options synthetically. Such a strat-egy involves taking a varying position in the futures or the underlying asset so that the delta of the position remains equal to that of the required option. For example,a synthetic put that insures hedgers against the asset value dropping below a certain level is dynamically created by taking a short futures position,in conjunction with a bond position. Moreover,this strategy requires hedgers to increase (decrease) short positions when the market has fallen (risen).7A number of extant studies have also suggested that dynamic hedging can cause positive feedback trades (e.g.,Gennotte & Leland,1990; Grossman,1988; Jacobs,1998). The inverse relation between the behavior of speculators and hedgers could have been deduced from an adding-up constraint—a hedger’s selling most likely coincides with a speculator’s buying. The futures markets literature uniformly pre-sumes that futures markets are designed to facilitate the transfer of risk to those most able and willing to bear it. Therefore,the negative feedback trades of speculators are likely to be induced by trades of hedgers,which can also be seen from the fact that the magnitude of coefficient estimates for returns is larger for hedgers than for speculators,and there is a strong negative correlation between positions taken by these two major types of traders (see Panel B of Table I).
Robustness
speculators likely adjust positions over shorter horizons in response to short-term information, while hedgers who are concerned about funda-mental information tend to hold positions for longer horizons. For robustness, we repeat the analysis using the data for 2-week and 6-week intervals. For both horizons, the estimated coefficients for changes in sentiment and returns are generally consistent with the results reported in Table II.
MARKET TIMING TESTS
Changes in Net Positions and Subsequent Futures Returns
In this section, we investigate traders’ market-timing ability by examining how changes in net positions by type of trader covary with future market movements. We examine traders’ timing ability for two reasons. First, sim-ilar to investor behavior studies in equity markets (e.g., Bange, 2000; Grinblatt & Kelharju, 2000; Nofsinger & Sias, 1999), we evaluate the average performance of various futures traders. This issue has also long been of interest to futures market researchers (e.g., Chang, 1985; Hartmark, 1991). Different from the methodology used in Hartmark (1991), this study focuses on the return to positions held by a trader rather than the return realized by the trader. After accounting for market risk factors, evidence that a speculator increases (decreases) net positions before the market rises (falls) is consistent with risk premiums to the trader for bearing nonmarketable risks and/or superior forecasting ability possessed by the trader. Second, post-feedback trade returns facilitate the inference of whether a trader type has a destabilizing impact on prices. For example, if hedgers engage in positive feedback trading, and changes in hedgers’ positions relate negatively to future returns, positive feedback trades of hedgers tend to be destabilizing (e.g., Lakonishok et al., 1992).
To test market-timing ability by type of trader, we follow a method-ology similar to that of Graham and Harvey (1996), and estimate the following model:
(2)
where⌽tis the set of information variables,which are designed to separate
market-timing ability based on public information from the market-timing ability that is superior to public information. Thus,the coefficient estimate for changes in net positions can be interpreted as abnormal performance. If the estimated coefficient on changes in net positions is on average greater than zero,the trader type increases (decreases) net positions before the abnormal return is positive (negative).
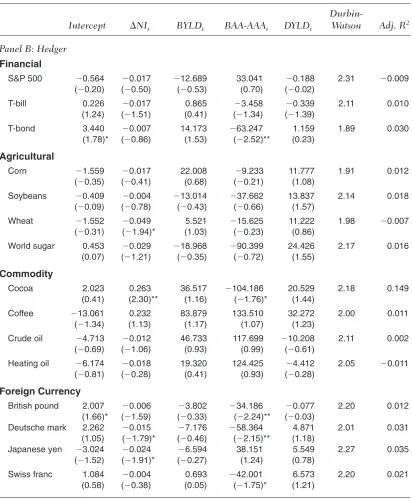
Table III reports the results of estimating Equation (2). Panel A of Table II shows the results for speculators. The estimated coefficient on net positions is positive for all except the cocoa and coffee futures (insignificant for the latter market);8 however, it is insignificant except for the T-bill, corn, world sugar, and Japanese yen futures. The coeffi-cient estimates for information variables are insignificant except for the default premium in a few markets. In sum, our findings suggest that an increase in speculators’ net positions is more likely to be associated with a positive subsequent return than a negative return, and vice versa.
The results reported in Panel B of Table III show that the coefficient estimate associated with changes in hedgers’ net positions is generally negative, with the exception of the cocoa and coffee futures, although significant only for the wheat, Deutsche mark, and Japanese yen futures markets. Therefore, contrary to the result for speculators, hedgers judge incorrectly the direction of future market movements, on average.
We should be cautious when interpreting the results of market-timing tests in futures markets. The fact that hedgers consistently get the direction of market movements wrong likely reflects hedging pres-sure effects, meaning that hedgers who transfer nonmarketable risks are required to pay a risk premium. Evidence from several extant studies is supportive of the existence of hedging pressure effects (e.g., Bessembinder, 1992; De Roon et al., 2000). Therefore, the positive abnormal performance of speculators may suggest that speculators earn a risk premium by assuming nonmarketable risks, and does not necessar-ily imply that these traders are associated with superior information (see a detailed discussion in the analysis that follows).
In conjunction with the evidence of positive feedback trading,the negative performance of hedgers suggests that hedgers have a tendency to move prices away from the fundamental value,and thus have a destabiliz-ing influence on futures prices over the intermediate (monthly) horizon. However,the hypothesis that speculation is destabilizing can be rejected by the contrarian behavior of speculators and the associated positive abnormal performance. This result is particularly striking,because the popular view is that speculation destabilizes the market (e.g.,Hart & Kreps,1986; Stein,1987). Due to this concern,speculators in U.S.
8There have been considerable inflows of money from hedge and managed futures funds into
TABLE III
Changes in Net Positions by Type of Trader and Subsequent Returns
Durbin-Intercept ⌬NIt BYLDt BAA-AAAt DYLDt Watson Adj. R2
Panel A: Speculator
Financial
S&P 500 ⫺0.786 0.051 ⫺13.211 36.298 0.069 2.26 ⫺0.012 (⫺0.24) (1.33) (⫺0.53) (0.82) (0.05)
T-bill 0.216 0.024 0.853 ⫺3.265 ⫺0.329 2.11 0.023 (1.21) (1.99)** (0.41) (⫺1.32) (⫺0.33)
T-bond 3.443 0.013 15.305 ⫺63.667 1.259 1.84 0.043 (1.81)* (1.09) (1.07) (⫺2.55)** (0.25)
Agricultural
Corn ⫺1.755 0.029 24.885 ⫺5.034 11.791 1.86 0.031 (⫺0.38) (2.12)** (0.77) (⫺0.11) (0.99)
Soybeans ⫺0.451 0.001 ⫺14.536 ⫺36.410 13.237 2.11 0.015 (⫺0.08) (0.18) (⫺0.43) (⫺0.59) (1.12)
Wheat ⫺1.815 0.051 7.289 ⫺11.480 11.237 2.00 0.009 (⫺0.36) (0.76) (0.19) (⫺0.17) (0.89)
World sugar 0.302 0.029 ⫺16.986 ⫺89.505 24.418 2.12 0.013 (0.43) (1.84)* (⫺0.38) (⫺1.32) (1.46)
Commodity
Cocoa 2.172 ⫺0.304 38.049 ⫺110.756 21.279 2.18 0.104 (0.44) (⫺2.45)** (1.01) (⫺1.81)* (1.56)
Coffee ⫺13.027 ⫺0.254 85.877 132.339 32.281 2.01 0.019 (⫺1.34) (⫺1.16) (0.98) (1.01) (1.23)
Crude oil ⫺4.858 0.001 49.230 120.718 ⫺10.216 2.07 0.005 (⫺0.71) (0.80) (0.99) (0.99) (⫺0.61)
Heating oil ⫺6.133 0.015 18.318 123.486 ⫺4.463 2.07 ⫺0.011 (⫺0.80) (0.18) (0.39) (0.93) (⫺0.28)
Foreign Currency
British pound 2.006 0.006 ⫺2.892 ⫺34.161 ⫺0.084 2.20 0.021 (1.66)* (1.02) (⫺0.22) (⫺1.88)* (⫺0.28)
Deutsche mark 2.240 0.013 ⫺7.370 ⫺32.958 4.889 2.03 0.027 (1.03) (1.34) (⫺0.48) (⫺2.13)** (0.89)
Japanese yen ⫺3.022 0.040 0.131 42.069 6.179 2.02 0.048 (⫺1.56) (2.18)** (0.32) (1.03) (0.83)
Swiss franc 2.383 0.016 4.337 ⫺63.083 6.565 2.03 0.028 (1.03) (0.87) (0.24) (⫺2.04)** (1.19)
TABLE III (Continued)
Durbin-Intercept ⌬NIt BYLDt BAA-AAAt DYLDt Watson Adj. R2
Panel B: Hedger
Financial
S&P 500 ⫺0.564 ⫺0.017 ⫺12.689 33.041 ⫺0.188 2.31 ⫺0.009 (⫺0.20) (⫺0.50) (⫺0.53) (0.70) (⫺0.02)
T-bill 0.226 ⫺0.017 0.865 ⫺3.458 ⫺0.339 2.11 0.010 (1.24) (⫺1.51) (0.41) (⫺1.34) (⫺1.39)
T-bond 3.440 ⫺0.007 14.173 ⫺63.247 1.159 1.89 0.030 (1.78)* (⫺0.86) (1.53) (⫺2.52)** (0.23)
Agricultural
Corn ⫺1.559 ⫺0.017 22.008 ⫺9.233 11.777 1.91 0.012 (⫺0.35) (⫺0.41) (0.68) (⫺0.21) (1.08)
Soybeans ⫺0.409 ⫺0.004 ⫺13.014 ⫺37.662 13.837 2.14 0.018 (⫺0.09) (⫺0.78) (⫺0.43) (⫺0.66) (1.57)
Wheat ⫺1.552 ⫺0.049 5.521 ⫺15.625 11.222 1.98 ⫺0.007 (⫺0.31) (⫺1.94)* (1.03) (⫺0.23) (0.86)
World sugar 0.453 ⫺0.029 ⫺18.968 ⫺90.399 24.426 2.17 0.016 (0.07) (⫺1.21) (⫺0.35) (⫺0.72) (1.55)
Commodity
Cocoa 2.023 0.263 36.517 ⫺104.186 20.529 2.18 0.149 (0.41) (2.30)** (1.16) (⫺1.76)* (1.44)
Coffee ⫺13.061 0.232 83.879 133.510 32.272 2.00 0.011 (⫺1.34) (1.13) (1.17) (1.07) (1.23)
Crude oil ⫺4.713 ⫺0.012 46.733 117.699 ⫺10.208 2.11 0.002 (⫺0.69) (⫺1.06) (0.93) (0.99) (⫺0.61)
Heating oil ⫺6.174 ⫺0.018 19.320 124.425 ⫺4.412 2.05 ⫺0.011 (⫺0.81) (⫺0.28) (0.41) (0.93) (⫺0.28)
Foreign Currency
British pound 2.007 ⫺0.006 ⫺3.802 ⫺34.186 ⫺0.077 2.20 0.012 (1.66)* (⫺1.59) (⫺0.33) (⫺2.24)** (⫺0.03)
Deutsche mark 2.262 ⫺0.015 ⫺7.176 ⫺58.364 4.871 2.01 0.031 (1.05) (⫺1.79)* (⫺0.46) (⫺2.15)** (1.18)
Japanese yen ⫺3.024 ⫺0.024 ⫺6.594 38.151 5.549 2.27 0.035 (⫺1.52) (⫺1.91)* (⫺0.27) (1.24) (0.78)
Swiss franc 1.084 ⫺0.004 0.693 ⫺42.001 6.573 2.20 0.021 (0.58) (⫺0.38) (0.05) (⫺1.75)* (1.21)
futures markets face more regulatory restrictions,and are subject to higher transaction costs compared to hedgers.
The Level of Net Positions by Type of Trader and Subsequent Returns
Traders may hold a substantially large position if they expect that the futures price is trending downward or upward. To test for this possibility, we also examine the relation between the level of net positions by type of trader and returns in the subsequent month. The empirical model is of the following form:
(3)
The major difference between Equation (3) and Equation (2) is that Equation (3) uses the level of net positions, while changes in net positions are used in Equation (2). Table IV reports the regression results of estimating Equation (3). To conserve space, only the coefficient asso-ciated with net positions is reported. Consistent with the results in Table III, the coefficient estimate associated with net positions of specu-lators is positive, whereas that for hedgers’ net positions is negative, with a few exceptions, although parameter estimates are only significantly different from zero for some agricultural and currency futures markets. The adjusted R2s of regressions are also small. This suggests that a
trading rule conditional on net trader positions may not be reliable. Nevertheless, broadly consistent with the previous findings, speculators have a tendency to hold a net long rather than short position before the market rises, whereas the opposite is true for hedgers.
Trading Rule Profitability
If the relation between trader positions and subsequent returns for a trad-er type shows a systematic patttrad-ern,investors could profit from tradtrad-er posi-tion informaposi-tion. Our previous results indicate that hedgers likely judge incorrectly the direction of market movements,and the reverse is true for speculators. Therefore,we would expect that a strategy conditional on large changes in net positions of speculators and hedgers is profitable. To test for this conjecture,we examine the profitability of the following trad-ing rule: long (short) one unit of futures and hold it for 1 month if changes in net positions in the market are large. A large change in net positions is
TABLE IV
The Level of Net Positions by Type of Trader and Subsequent Returns
Speculator Hedger
Slope Coefficient Adj. R2 Slope Coefficient Adj. R2
Financial
S&P 500 0.010 ⫺0.011 ⫺0.031 0.013 (0.22) (⫺1.01)
T-bill 0.004 ⫺0.010 ⫺0.005 ⫺0.009 (0.22) (⫺0.63)
T-bond 0.007 0.024 ⫺0.002 0.019
(0.78) (⫺0.33)
Agricultural
Corn 0.028 0.016 ⫺0.024 0.023
(1.78)* (⫺1.78)*
Soybeans 0.021 ⫺0.011 ⫺0.013 0.019 (1.85)* (⫺1.75)*
Wheat 0.047 ⫺0.024 ⫺0.034 0.021
(1.73)* (⫺1.68)*
World sugar 0.008 ⫺0.006 ⫺0.037 0.003 (0.12) (⫺0.19)
Commodity
Cocoa ⫺0.125 0.062 0.105 0.065
(⫺1.45) (1.74)*
Coffee ⫺0.158 ⫺0.008 0.080 0.012
(⫺0.65) (0.56)
Crude oil 0.024 0.015 ⫺0.028 0.013 (0.74) (⫺1.13)
Heating oil 0.020 ⫺0.014 ⫺0.007 ⫺0.013 (0.32) (⫺0.19)
Foreign Currency
British pound 0.013 0.038 ⫺0.024 0.041 (1.71)* (⫺2.07)**
Deutsche mark 0.017 0.018 ⫺0.005 0.025 (1.73)* (⫺0.56)
Japanese yen 0.018 0.019 ⫺0.014 0.031 (1.88)* (⫺1.75)*
Swiss franc 0.027 0.028 ⫺0.021 0.039 (1.95)* (⫺1.50)
defined as one standard deviation away from the average change in net positions for a trader type over a 3-year moving window prior to the cur-rent month.9 We compute mean abnormal returns in the subsequent month based on large changes in net positions. Also computed is the mean abnormal return for a strategy of simultaneously longing a unit of futures after a large increase in net positions and shorting a unit of futures after a large decrease in net positions.
The abnormal return for each market is computed by adjusting monthly raw returns for risk. Suppose that returns are generated by the following factor model:
(4)
where ⌽t⫺1is the set of information variables that have been shown to be
priced risk factors in futures markets. d0 represents the zero-beta return, which is supposed to be zero due to zero investment in futures markets. Equation (4) is estimated for each market by (rolling) regressing time series returns using data for 36 months (3 years) prior to the month con-taining month t. For example, in January 1993, djtis estimated using the data on returns and information variables over the interval from January 1990 to December 1992.10The estimated abnormal return on each
mar-ket, rt, is calculated as
(5)
Results on the trading rule profitability are reported in Table V. A (B) denotes a trading strategy that follows a large increase (decrease) in net positions of a trader type. AMB represents a strategy of simultane-ously longing a unit of futures after a large increase in positions and shorting a unit of futures after a large decrease in positions, and there-fore, the mean return for AMB provides a comprehensive measure of trading rule profitability. Consistent with the previous results, the mean return for AMB is positive for speculators for all but the cocoa and coffee futures. Take the corn futures as an example: the average monthly abnormal return for a strategy that buys after a large increase in net posi-tions and sells after a large decrease in net posiposi-tions is 2.38% (annual-ized 28.56%). In contrast, the mean return for AMB is negative for
rt⫽Rt ⫺ ©dj£jt⫺1
Rt⫽d0 ⫹ ©dj£jt⫺1 ⫹ et
9We compute the standard deviation over a 3-year moving window to make the trading rule tradable.
Our results are not substantially changed if a 5-year moving window is used.
10We also use a 5-year moving window for the rolling regressions. Our results remain largely
TABLE V
Trading Rule Profitability
Speculator Hedger
A B AMB A B AMB
Financial
S&P 500 0.178 0.009 0.188 ⫺0.404 0.096 ⫺0.501 (0.33) (0.03) (0.13) (⫺0.44) (0.18) (⫺0.36) T-bill 0.001 ⫺0.078 0.080 ⫺0.126 0.068 ⫺0.192 (0.08) (⫺0.54) (0.61) (⫺1.04) (1.01) (⫺1.45) T-bond 0.939 ⫺0.039 0.952 0.098 0.188 ⫺0.086 (0.11) (⫺1.77)* (1.13) (0.47) (0.18) (⫺0.11)
Agricultural
Corn 0.916 ⫺1.465 2.380 ⫺1.085 0.856 ⫺1.933 (0.95) (⫺1.53) (1.98)** (⫺1.45) (0.66) (⫺1.78)* Soybeans ⫺0.161 ⫺2.433 2.287 ⫺2.269 ⫺0.356 ⫺1.915
(⫺0.31) (⫺1.99)** (1.89)* (⫺1.85)* (⫺1.33) (⫺1.77)*
Wheat 1.016 ⫺0.107 1.124 ⫺0.004 1.172 ⫺1.175 (1.90)* (⫺0.04) (1.94)* (⫺0.05) (1.83)* (⫺1.71)* World sugar 1.140 ⫺0.617 1.757 1.542 ⫺0.120 ⫺1.663
(1.79)* (⫺0.36) (1.88)* (1.81)* (⫺0.05) (⫺1.84)*
Commodity
Cocoa ⫺5.107 1.890 ⫺6.980 2.372 ⫺5.370 10.702 (⫺2.87)*** (1.98)** (⫺3.19)*** (2.12)** (⫺3.41)*** (3.97)*** Coffee 0.085 2.815 ⫺2.636 3.092 ⫺0.997 4.088
(0.03) (0.91) (⫺0.46) (1.41) (⫺0.13) (0.80) Crude oil 1.361 ⫺1.281 2.641 ⫺2.182 0.795 ⫺2.975 (1.89)* (⫺1.03) (2.29)** (⫺0.98) (0.54) (⫺1.66)* Heating oil 1.244 1.110 0.135 ⫺1.008 ⫺0.912 ⫺0.041
(0.55) (0.38) (0.09) (⫺0.31) (⫺0.48) (⫺0.10)
Foreign Currency
British pound 0.234 ⫺0.133 0.367 ⫺0.147 0.166 ⫺0.313 (0.50) (⫺0.31) (1.19) (⫺0.93) (0.30) (⫺0.64)
Deutsche mark 1.361 ⫺0.161 1.503 ⫺0.234 0.987 ⫺1.211 (1.88)* (⫺0.48) (1.99)** (⫺0.51) (1.40) (⫺1.81)* Japanese yen 1.773 ⫺1.111 2.883 ⫺0.718 1.406 ⫺2.124
(1.72)* (⫺2.24)** (2.75)*** (⫺1.21) (1.94)* (⫺2.19)**
Swiss franc ⫺0.327 ⫺1.338 1.012 ⫺0.955 0.214 ⫺1.169 (⫺0.18) (⫺1.90)* (0.98) (⫺1.60) (0.33) (⫺1.73)*
hedgers except for the cocoa and coffee futures. Note that the mean returns for A, B, and AMB are insignificant for financial futures, and smaller in magnitude than for the other markets, suggesting that the hedging pressure effect is less likely to prevail in financial futures mar-kets (e.g., Bessembinder, 1992).
The mean abnormal return for AMB for hedgers roughly captures the hedging pressure effect, whereas that for speculators represents risk premiums earned and/or superior timing ability possessed by these traders. To gain a sense of possible superior timing ability of speculators, it is useful to compare the magnitude of mean return for AMB for spec-ulators and hedgers. A larger return for AMB for specspec-ulators relative to that for hedgers is indicative of superior timing ability possessed by spec-ulators. For eight futures markets that show a significant return for AMB (excluding the cocoa futures that has an unexpected sign), the mean return for AMB for speculators is larger in magnitude than that for hedgers in five markets, that is, the corn, soybean, sugar, Deutsche mark, and Japanese yen futures. However, our further tests (not reported) indi-cate that the magnitude of mean return for AMB for speculators is not significantly different from that for hedgers except for the Deutsche mark and Japanese yen futures. Therefore, it does not appear that spec-ulators possess superior timing ability with a few exceptions, but they generally outperform hedgers. Consistent with the findings in Wang (2001), our results suggest that the superior performance of speculators primarily results from hedging pressure effects. Several extant studies also examine the performance of major types of futures traders, but the evidence is inconclusive. For example, Chang (1985) and Leuthold et al. (1994) show that speculators are better informed. In contrast, Hartzmark (1987, 1991) finds that hedgers make money, but speculators do not.
Further Tests
Table II shows that speculators are contrarians, while hedgers exhibit positive feedback trading behavior. Moreover, Tables III–V show that the trades of speculators are more likely to be in the same direction as mar-ket movements than those of hedgers. Therefore, it is of interest to examine whether monthly future returns exhibit mean reversion, which likely makes negative feedback trades of speculators profitable. To test this conjecture, we regress abnormal returns in the current month on those in the previous month, i.e.,
(6)
A negative k in Equation (6) implies that futures prices are mean reverting over the monthly interval. Table VI reports the results of esti-mating Equation (6). The results indicate that the coefficient estimate for lag returns is negative for the S&P 500 index, agricultural, and com-modity futures, and positive for the other markets. However, none of the coefficient estimates is significant. Therefore, it does not appear that mean reversion offers an explanation for the superior performance of speculators in these futures markets.
INTRA-PERIOD TRADING BEHAVIOR BY TYPE OF TRADER
Futures prices are more volatile compared to equity prices, and futures traders except those hedging long-term commitments typically hold posi-tions for shorter horizons. Therefore, it may be interesting to look at intra-period trading behavior by type of trader. We examine intra-period trading behavior by focusing on the contemporaneous relation between changes in net positions by type of trader and returns during the same month after controlling for lag information variables, i.e.,
(7)
where Rtis the return in month t, and idenotes speculators and hedgers. The results of estimating Equation (7) are reported in Table VII. To conserve space,only the coefficients for changes in net positions are reported. Surprisingly,the results show that the slope coefficient estimate for changes in net positions is significantly positive (negative) for specula-tors (hedgers) in all these markets,and the adjustedR2s of regressions are
Rt⫽gi0 ⫹ gi1¢NIit⫹ ©gi2j£jt⫺1 ⫹hit
TABLE VI
The Relation Between Current Returns and Returns in the Previous Month
Intercept rt⫺1 Durbin-Waston Adjusted R2
Financial
S&P 500 ⫺0.036 ⫺0.044 1.98 0.017 (⫺1.38) (⫺0.39)
T-bill 0.013 0.065 1.96 0.004
(0.46) (0.68)
T-bond 0.014 0.010 1.99 0.008
(0.13) (0.91)
Agricultural
Corn 0.002 ⫺0.125 2.01 0.010
(0.02) (⫺1.09)
Soybeans ⫺0.019 ⫺0.066 2.01 0.008 (⫺0.03) (⫺0.78)
Wheat 0.077 ⫺0.056 1.98 ⫺0.003
(0.31) (⫺0.53)
World sugar 0.027 ⫺0.013 1.99 0.004 (0.03) (⫺0.11)
Commodity
Cocoa ⫺0.027 ⫺0.112 2.05 0.048
(⫺0.42) (⫺1.21)
Coffee ⫺0.066 ⫺0.045 2.00 0.002
(⫺0.51) (⫺0.32)
Crude oil 0.189 ⫺0.054 1.93 ⫺0.008 (0.23) (⫺0.34)
Heating oil 0.038 ⫺0.051 2.00 ⫺0.009 (0.46) (⫺0.37)
Foreign Currency
British pound ⫺0.056 0.194 2.05 0.035 (⫺0.26) (1.19)
Deutsche mark ⫺0.336 0.045 1.94 ⫺0.001 (⫺1.23) (0.48)
Japanese yen 0.127 0.114 1.99 0.011 (0.34) (0.91)
Swiss franc ⫺0.264 0.039 2.00 ⫺0.008 (⫺0.82) (0.40)
TABLE VII
Changes in Net Positions by Type of Trader and Returns in the Same Month
Speculator Hedger
Coefficient Adj. R2 Coefficient Adj. R2
Financial
S&P 500 0.177 0.171 ⫺0.160 0.263 (4.41)*** (⫺5.53)***
T-bill 0.043 0.135 ⫺0.033 0.136
(4.30)*** (⫺4.84)***
T-bond 0.054 0.246 ⫺0.041 0.252
(6.34)*** (⫺6.45)***
Agricultural
Corn 0.126 0.288 ⫺0.116 0.295
(5.39)*** (⫺5.98)***
Soybeans 0.316 0.578 ⫺0.281 0.628
(9.01)*** (⫺10.24)***
Wheat 0.380 0.315 ⫺0.322 0.342
(7.31)*** (7.65)***
World sugar 0.207 0.294 ⫺0.168 0.337 (7.29)*** (⫺7.28)***
Commodity
Cocoa 0.578 0.415 ⫺0.481 0.403
(7.91)*** (⫺7.87)***
Coffee 1.094 0.293 ⫺1.088 0.336
(8.06)*** (⫺8.63)***
Crude oil 0.220 0.397 ⫺0.154 0.381 (10.49)*** (⫺10.03)***
Heating oil 0.564 0.425 ⫺0.404 0.449 (8.41)*** (⫺9.61)***
Foreign Currency
British pound 0.085 0.467 ⫺0.066 0.556 (9.73)*** (⫺9.47)***
Deutsche mark 0.070 0.436 ⫺0.051 0.471 (7.95)*** (⫺8.10)***
Japanese yen 0.119 0.276 ⫺0.083 0.391 (7.34)*** (⫺9.73)***
Swiss franc 0.122 0.366 ⫺0.088 0.548 (8.32)*** (⫺9.45)***
Note. This table reports the results of estimating Equation (7). To conserve space, only the coefficients asso-ciated with changes in net positions and the R2s of regressions are reported. Test statistics for individual
reasonably large. This result is consistent with the signs of contemporane-ous correlations for the two types of traders reported in Table I.
Given the extant evidence,hedgers do not appear to adjust their posi-tions frequently in the short run. This is not difficult to understand because hedgers are typically concerned about the value of median- or long-term risk exposures. Therefore,the results in Table VII are likely to result from speculator herding and the possible impact of herding. Herding means that a group of investors trade in the same direction over a period of time. Several extant studies document evidence that some insti-tutional investors (mutual funds,pension funds) herd,and their herding impacts stock prices (e.g.,Grinblatt et al.,1995; Lakonishok et al.,1992). Managed futures funds and commodity pools are the major types of spec-ulators in futures markets.11Several studies show that managed futures
trading is purported to be guided by similar feedback trading systems (e.g., Brorsen & Irwin,1987; Elton et al.,1987; Irwin & Yoshimaru,1999). Therefore,speculators tend to herd,and their herding moves prices over a short time interval,which induces the negative relation between changes in hedger positions and returns in the same month.
CONCLUSIONS
This article examines some determinants of trading decisions and the performance of the two major types of futures traders—speculators and hedgers—in 15 futures markets. The evidence indicates that, after accounting for market risk factors, speculators have a tendency to follow market sentiment, and increase (decrease) net futures positions when the market has risen (fallen). By contrast, hedgers trade against market sentiment, and engage in positive feedback trading. The positive feed-back trading of hedgers is not inconsistent with certain dynamic hedging strategies, and the contrarian behavior of speculators is likely to be induced by the trades of hedgers.
We also find that speculators generally outperform hedgers. A trading strategy following large changes in speculator positions and/or contrary to large changes in hedger positions is significantly profitable in most agricultural, commodity, and currency futures markets. However, the superior performance seems to result from hedging pressure effects rather than superior timing ability possessed by speculators. The preva-lence of hedging pressure effects in U.S. futures markets is consistent
11Managed futures refer to futures funds and pools that combine investors’ money to speculate in
with the literature (e.g., Bessembinder, 1992; De Roon et al., 2000). Analyses of intramonth trading behavior, however, reveal that specula-tors buy (sell) when the returns in the same month are higher (lower), whereas the opposite is true for hedgers. This suggests that speculators tend to herd, and their herding likely impacts futures prices.
A simultaneous analysis of the behavior and performance by type of trader allows us to infer whether trades of a trader type destabilize the market. This issue has been of great interest to academics and financial regulators. The contrarian behavior of speculators together with their positive performance does not appear to be consistent with the common view of destabilizing speculation (e.g., Hart & Kreps, 1986; Stein, 1987). However, the evidence of the positive feedback trading of hedgers together with their negative performance suggests that hedgers have a destabilizing influence over an intermediate (monthly) horizon. These findings have implications for academics attempting to understand the impact of trades by traders, and for futures market regulators concerned with market stability.
APPENDIX
Exchange Information, Delivery Months, and Reporting Level (as of the End of 1999) for All Futures Contracts
Reporting Level Future Contract Exchange Delivery Months (Contracts)
Financial
S&P 500 Chicago Mercantile Exchange 3,6,9,12 600 T-bill (90 days) Chicago Mercantile Exchange 3,6,9,12 150 T-bond (15–30 years) Chicago Board of Trade 3,6,9,12 500
Agricultural
Corn Chicago Board of Trade 3,5,7,9,12 750,000 (bushels) Soybeans Chicago Board of Trade 1,3,5,7,8,9,11 500,000 (bushels) Wheat Chicago Board of Trade 3,5,7,9,12 500,000 (bushels) World sugar Coffee, Sugar and Cocoa Exchange 3,5,7,9,12 300
Commodity
Cocoa Coffee, Sugar and Cocoa Exchange 3,5,7,9,12 100 Coffee Coffee, Sugar and Cocoa Exchange 3,5,7,9,12 50 Crude oil New York Mercantile Exchange All 300 Heating oil New York Mercantile Exchange All 250
Foreign Currency
BIBLIOGRAPHY
Admati, A., & Pfleiderer, P. (1988). A theory of intraday patterns: Volume and price variability. Review of Financial Studies, 1, 3–40.
Bange, M. M. (2000). Do the portfolio of small investors reflect positive feed-back trading? Journal of Financial and Quantitative Analysis, 35, 239–255. Bessembinder, H. (1992). Systematic risk, hedging pressure, and risk premiums
in futures markets. Review of Financial Studies, 5, 637–667.
Bessembinder, H., & Chan, K. (1992). Time-varying risk premia and fore-castable returns in futures markets. Journal of Financial Economics, 32, 169–193.
Bjornson, B., & Carter, C. A. (1997). New evidence on agricultural commodity return performance under time-varying risk. American Journal of Agricultural Economics, 79, 918–930.
Bodie, Z., & Rosansky, V. J. (1980). Risk and return in commodity futures. Financial Analysts Journal, 36, 27–39.
Brorsen, B. W., & Irwin, S. H. (1987). Futures funds and price volatility. Review of Futures Market, 61, 19–135.
Chang, E. C. (1985). Returns to speculators and the theory of normal backwar-dation. Journal of Finance, 40, 193–208.
Chang, E. C., Pinegar, J. M., & Schachter, B. (1997). Interday variations in vol-ume, variance and participation of large speculators. Journal of Banking and Finance, 21, 797–810.
De Long, B., Shleifer, A., Summers, L. H., & Waldmann, R. (1990). Noise trader risk in financial markets. Journal of Political Economy, 98, 703–738. De Roon, F., Nijman, T. E., & Veld, C. (2000). Hedging pressure effects in
futures markets. Journal of Finance, 55, 1437–1456.
Ederington, L., & Lee, J. H. (2002). Who trades futures and how: Evidence from the heating oil futures markets. Journal of Business, 75, 353–373. Elton, E. J., Gruber, M. J., & Rentzler, J. C. (1987). Professionally managed,
publicly traded commodity funds. Journal of Business, 60, 175–199. Fama, E., & French F. (1989). Business conditions and expected returns on
stocks and bonds. Journal of Financial Economics, 25, 23–49.
Gennotte, G., & Leland, H. (1990). Market liquidity, hedging, and crashes. American Economic Review, 80, 999–1021.
Gilbert, C. L. (1994). Commodity fund activity and the world cocoa market. London: London Commodity Exchange.
Graham, J. R., & Harvey, C. R. (1996). Market timing ability and volatility implied in investment newsletters’ asset allocation recommendations. Journal of Financial Economics, 42, 397–421.
Grinblatt, M., & Keloharju, M. (2000). The investment behavior and perform-ance of various investor types. Journal of Financial Economics, 55, 43–67. Grinblatt, M., Titman, S., & Wermers, R. (1995). Momentum investment strategies, portfolio performance, and herding: A study of mutual fund behavior. American Economic Review, 85, 1088–1105.
Hart, O., & Kreps, D. (1986). Price destabilizing speculation. Journal of Political Economy, 94, 927–952.
Hartzmark, M. L. (1987). Returns to individual traders of futures: Aggregate results. Journal of Political Economy, 95, 1292–1306.
Hartzmark, M. L. (1991). Luck versus forecast ability: Determinants of trader performance in futures markets. Journal of Business, 64, 49–74.
Hirshleifer, D. (1988). Residual risk, trading costs, and commodity futures risk premia. Review of Financial Studies, 1, 173–193.
Hirshleifer, D. (1990). Hedging pressure and futures price movements in a general equilibrium model. Econometrica, 58, 411–428.
Hong, H., & Stein, J. C. (1999). A unified theory of underreaction, momentum trading, and overreaction in asset markets. Journal of Finance, 54, 2143–2184.
Hull, J. C. (2000). Options, futures, and other derivatives, 4th ed. Englewood Cliffs, NJ: Prentice-Hall.
Irwin, S. H., & Yoshimaru, S. (1999). Managed futures, positive feedback trad-ing, and futures price volatility. Journal of Futures Markets, 19, 759–776. Jacobs, B. I. (1998). Option pricing theory and its unintended consequences.
Journal of Investing, 7, 12–14.
Jegadeesh, N., & Titman, S. (1993). Returns to buying winners and selling losers: Implications for stock market efficiency. Journal of Finance, 48, 65–91.
Kyle, A. S. (1985). Continuous auctions and insider trading. Econometirca, 53, 1315–1335.
Lakonishok, J., Shleifer, A., & Vishny, R. W. (1992). The impact of institutional trading on stock prices. Journal of Financial Economics, 32, 23–43. Leuthold, R. M., Garcia, P., & Lu. R. (1994). The returns and forecasting
abili-ty of large traders in the frozen pork bellies futures market. Journal of Business, 67, 459–473.
Llorente, G., Michaely, R., Saar, G., & Wang, J. (in press). Dynamic volume-return relation of individual stocks. Journal of Finance, in press.
Lynch, A. W. (in press). Portfolio choices and equity characteristics: Characterizing the hedging demands induced return predictability. Journal of Financial Economics, in press.
Merton, R. (1973). An intertemporal capital asset pricing model. Econometrica, 41, 867–887.
Merton, R. (1987). A simple model of capital market equilibrium with incom-plete information. Journal of Finance, 42, 483–451.
Mitchell, D. O., & Gilbert, C. (1997). Do hedge funds and commodity funds affect commodity prices? DECnote, World Bank.
Nofsinger, J. R., & Sias, R. W. (1999). Herding and feedback trading by institu-tional and individual investor. Journal of Finance, 54, 2263–2295.
Odean, T. (1998). Are investors reluctant to realize their losses? Journal of Finance, 53, 1775–1798.
Shiller, R. (1984). Stock prices and social dynamics. Brookings Papers on Economic Activity, 2, 457–510.
Spiegel, M., & Subrahmanyam, A. (1992). Informed speculation and hedging in a non-competitive securities market. Review of Financial Studies, 5, 307–329.
Stein, J. C. (1987). Informational externalities and welfare-reducing specula-tion. Journal of Political Economy, 95, 1123–1145.
Wang, C. (2001). Investor sentiment and return predictability in agricultural futures markets. Journal of Futures Markets, 21, 929–952.
Wang, J. (1994). A model of competitive stock trading volume. Journal of Political Economy, 102, 127–168.