Analyse usage of process performance models to
predict customer satisfaction
J. Venkatesh, PhD.
Associate Professor,
School of Management
Studies
Anna University of
Technology Coimbatore
Jothipuram Post,
Coimbatore – 641 047,
Tamilnadu, India.
Priyesh Cherurveettil
Ph.D Part Time Research
Scholar, School of
Management Studies, Anna
University of Technology
Coimbatore,
Jothipuram Post,
Coimbatore – 641 047,
Tamilnadu, India.
Thenmozhi. S
Assistant Professor
Department of Computer
Applications
Gnanamani College of
Technology,
AK Sumuthiram, Namakkal
District. Tamilnadu, India.
Balasubramanie. P, PhD.
Professor
Department of Computer
Science & Engineering
Kongu Engineering College
Perundurai, Erode - 638 052.
Tamilnadu, India
ABSTRACT
The key parameter to differentiate the vendor capability in an IT industry is the value add that the customer experiences. To achieve this, it needs to be understood, what are the key parameters that drive this and what needs to be done to improve it. Process performance models help to understand customer satisfaction, it is a quantitative research, the associated process and probable parameters help in improving customer satisfaction. This process is established using a case study. The importance of process performance models in not clearly understood by the project team and exposure to lack of understanding of associated sub process is clearly articulated. Based on these gaps, the intent to identify the right sub process and models is addressed through a project plan.
Keywords
process, performance, model, customer, satisfaction
1.
INTRODUCTION
TO
MEASUREMENT
Software Engineering Institute‟s Capability Maturity Model Integrated (CMMI) standard [6] has five levels. Out of the five levels in CMMI, Levels 4 & 5 reflects the high maturity of the organization. The concept of a process performance model exists as the base of high maturity. The focus on metrics is covered in Level 2 & 3 itself. High maturity is evaluated by the organizations quantitative management appetite. Organizations should have a strong definition for metrics across the organization, the ability to capture the metrics and analysis the metrics is the base even before getting into high maturity. [14] Metrics Handbook is the source for all metrics related information in the organization. Metrics definition, source, frequency, analysis method all are listed in this handbook. Different users within the organization use the data for different analysis. Senior Management would mainly be interested in metrics around service level agreements and customer satisfaction [4]. At the project level, metric goals focus is typically around variance for effort and schedule. Defect leakage is also a metric tracked at project level. In the current context, with the growing focus on customer satisfaction, metrics plan addresses the details around this metric, the definition, the collecting mechanism and the analysis mechanism. The case study demonstrates the understanding and associated challenges while predicting customer satisfaction [12]
.
2.
MANAGEMENT
BY
METRICS
Process Performance Model (PPM) helps to pro-actively predict the outcomes and take preventive actions [5]. Management by metrics focuses on making decisions using right project data. It is extended further to predict the probable outcomes using statistical methodologies [8]. PPM uses process and product measurements to estimate the progress towards achieving project objectives. Several process measurements that give early indications of customer satisfaction are considered [2]. PPM to predict customer satisfaction is discussed. PPMs are used to estimate or predict the value of a process performance measure from the values of other process, product, and service measurements.
PPM can model the variation of factor and help us understand the predicted range or the variation of its outcomes. PPM can predict interim outcomes and in this case, a proactive measure of customer satisfaction is achieved instead of a very reactive one [10]. Mid-course correction can be made to achieve higher customer satisfaction i.e. project success. Interestingly, PPMs enable “What-if” analysis for project planning, dynamic re-planning and problem resolution during project execution. “what-if” exercises can be run, holding one or more values constant. We can see the effect of trade-offs between schedule, effort, defects, staff and functionality. A Predictive ability of these measures, with accuracy levels, effects of tailoring and improvements, help the organization achieve project success
.
3.
CUSTOMER
SATISFACTION
MODEL
DESIGN
The Customer satisfaction model design steps are as mentioned below
1. The business objective of retaining existing customers was set as process performance objective for which the PPM was developed.
2. Customer Satisfaction Score (CSS) was selected as the (Y) for the goal. The assumption made was that the customers with high customer satisfaction score (5.5 and above in a scale of 1-7) would like to continue to avail the services of the organization.
(SV), Effort Variance (EV) and defects leaked (DL) based on brain storming session with managers. The assumption made was that these factors are used by project managers for project monitoring.
4. Data from the projects for the identified X‟s and Y‟s were collected. Based on the above observation, data points were collected from projects for X's and Y's. Development projects data in the last 6 months within an account were used as the criteria to select the projects in scope for data collection.
5. Process performance baselines values for the X‟s and Y‟s were checked. Fifteen data points were selected and correlation for the X's and Y's from the organization process performance baselines were checked.
6.
Regression equation for the defined X's and Y's were determined.
4.
CUSTOMER
SATISFACTION
DATA
ANALYSIS
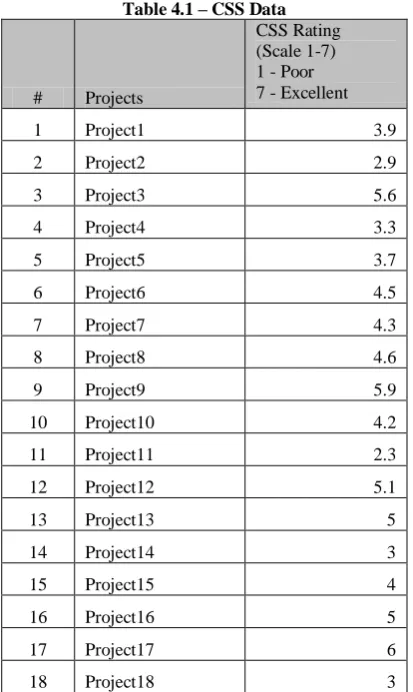
Customer satisfaction scores for the last six months for 25 projects within an account were pulled and analyzed. These projects have not used any prediction model. As a process, the customer satisfaction questionnaire is triggered to the respective clients once is six months. Data is then collated for respective account and projects and shared with the account managers. The data considered for analysis is shown in Table 4.1
Table 4.1 – CSS Data
# Projects
CSS Rating (Scale 1-7) 1 - Poor 7 - Excellent
1 Project1 3.9
2 Project2 2.9
3 Project3 5.6
4 Project4 3.3
5 Project5 3.7
6 Project6 4.5
7 Project7 4.3
8 Project8 4.6
9 Project9 5.9
10 Project10 4.2
11 Project11 2.3
12 Project12 5.1
13 Project13 5
14 Project14 3
15 Project15 4
16 Project16 5
17 Project17 6
18 Project18 3
19 Project19 4.4
20 Project20 3.9
21 Project21 5.4
22 Project22 3
23 Project23 3.2
24 Project24 3.9
25 Project25 4
[image:2.595.323.529.70.188.2]Based on the 25 data points collected on Customer Satisfaction Scores, the basic statistics were arrived as shown in Figure 4.2
Figure 4.1 – Measure of central tendency and dispersion
[image:2.595.307.560.237.345.2]Figure 4.2 – Skewness and Kurtosis
Figure 4.3 – Chebyshev’s Observation
[image:2.595.69.276.416.762.2]Measure of central tendency is mean, median and mode. Refer to Figure 4.1. Mean of a set of observations is their average. Mean of the CSS is 4.1. This means that if another sample of similar projects is taken, the CSS would be around 4.1. Mode of the data is the value that occurs most frequently and for the given data in this analysis, it is 3.9. Median is the point below which lie half the data, it is the 50th percentile and for the given data this is 4. Refer to Figure 4.3. Based on Chebyshev's theorem, within 1.5 standard deviation from the mean, prediction is 55.5%, whereas based on empirical rule prediction is 86.64%. But this data shows that 88% lie within 1.5 standard deviations from the mean. This implies that the data is fairly symmetrical.
Following steps were undertaken to understand the correlation of proposed process variables with customer satisfaction scores
.
the process model, Effort Variance, Schedule Variance and Defects Leaked
2. Comprehend process variables: The operational definition for the above process variables as defined in the metrics repository of the organization is mentioned below. These metrics are captured on a weekly basis in the QMS metrics tool
Effort Variance (EV) =
(Actual Effort – Estimated Effort) * 100 / Estimated Effort
Schedule Variance (SV) =
(Actual End Date – Planned End Date) * 100 / Planned End Date
Defects Leaked (DL) = Number of defects leaked from system testing to user acceptance testing
3. Identify projects for analysis: Projects which had recently completed CSS survey were targeted. Current CSS value and data for effort variance, schedule variance and defects leaked were collated from organization repository.
4. Ensure consistency: The assumption on the data collated was that operation definition for these three process variables exists, consistent understanding on these definitions and consistent measurement system are in place.
[image:3.595.60.291.441.674.2]5. Collect data:
Table 4.2 – Project data on process variables
The data gathered from 15 projects is shown below in Table 4.2. CSS is the actual Customer Satisfaction Score received by the respective project teams. EV represents effort variance in percentage. SV represents schedule variance is percentage. Defects leaked represents defects leaked from system testing to user acceptance testing in whole numbers.
6. Analyze data: As seen in Table 4.2 above, the projects with low CSS scores had high and un-favorable effort variance, schedule variance and defects leaked. For example, Project 7 had CSS score of 3, its effort variance was 48%, schedule variance was 36% and defects leaked were 14. Similarly, Project 9 had a CSS of 3.3 for an effort variance of 32%, schedule variance of 26% and defects leaked were 18. For Project 12 for a CSS rating of 5.4, effort variance was around 4%, schedule variance around 6% and defects leaked was 1. Based on the data it appears that the CSS score are high when the variance in terms of effort, schedule and defects are low. Regression analysis needs to be performed to validate our understanding and to understand the correlation of these process variables with the customer satisfaction score.
7. Perform Regression Analysis: Multiple regression analysis was performed using the above data and the correlation matrix is as mentioned below.
Figure 4.4 – Correlation Matrix
Correlation matrix clearly shows the influence each of the variables has with CSS. The direction is negative which indicates that the variable has a negative influence with the outcome. Based on the above table the following inference are made
Effort variance has a negative correlation with CSS score, which means that as effort variance increases it would impact the CSS scores negatively.
Schedule variance has a negative correlation with CSS score, which means that as schedule variance increases it would impact the CSS scores negatively.
Defects leaked has a negative correlation with CSS score, which means that as effort variance increases it would impact the CSS scores negatively.Y X1 X2 X3
Project CSS EV SV DL
1 2.9 45 38 12
2 3.7 26 12 6
3 4.6 8 2 2
4 5.0 5 10 2
5 4.0 36 26 4
6 4.4 26 22 8
7 3.0 48 36 14
8 5.6 0 4 9
9 3.3 32 26 18
10 4.5 8 12 10
11 3.9 24 13 14
12 5.4 4 6 1
13 3.2 22 12 14
14 3.1 36 10 13
15 3.3 25 12 15
EV SV DL
EV 1.0000
SV 0.8409 1.0000
DL 0.5449 0.4112 1.0000
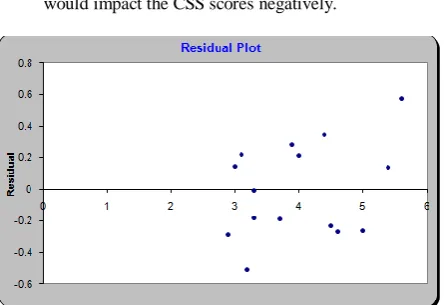
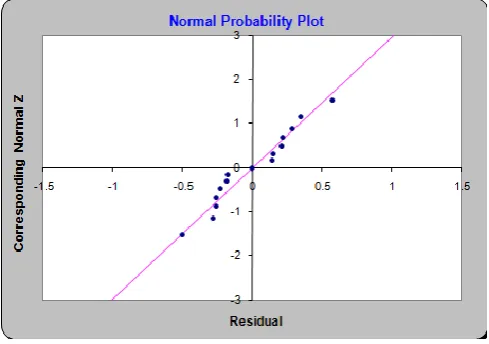
[image:3.595.321.544.573.725.2]Figure 4.5 – Residual Plot
Mirror pattern is not found in Figure 4.5 Residual Plot and hence no heteroscedasticity is found. The normal probability plot is approximately linear. This would indicate that the normality assumption for the errors has not been violated.
Looking at the p value, since it is 0.0001 which is < 0.05, null hypothesis is not valid, which means the variables selected have an impact to CSS.
5.
CUSTOMER
SATISFACTION
X
FACTORS
-
CONSTRAINTS
After the above analysis, project team involved the subject matter expert from the quality team to ensure the approach is correct. What came out of the discussion was surprising. While the brain storming session helped to identify the parameters that affect Y according to the project team, the x factors listed may not be the direct x factors. The pre-work was important to understand that these variables have a direct impact to the Customer Satisfaction model and would serve as an evidence to come up with a project plan to develop the customer satisfaction process model [11]. One important healthy ingredient for x factor contributing to the final Y is that the sub process selected for statistical management must not be a composite of sub process. For example, effort variation % is a composite sub process of actual and planned effort. This is the same with schedule and defects leaked. In fact these could be interim y‟s. A project goal Y can have many interim y‟s. Effort variation could be a small y, similarly schedule and defects leaked. For each of the interim y‟s, the possible x factors need to be listed down. For example, effort variation could have the following x factors, technical experience, system testing defect detection efficiency. The identification of influencing x factors should ensure they are controllable. The x factors should be connected directly to the sub process. At-least one should be statistically monitored. The x factors should not be a composite of sub process. It is also important to understand the factors should consider combination of people, process and technology.
6.
CUSTOMER
SATISFACTION
PPM
–
PLAN
AHEAD
The predictive process performance model to be built is dependent on the right selection of sub process. Team should get the core subject matter experts to discuss and identify the right factors. The plan to be developed should consider the key elements of project plan [1].
1. Project scope to create customer satisfaction process model need to be defined. It is important to identify the type of project, development projects, enhancement projects or maintenance projects. Pilot phase need to be planned. Based on the pilot phase findings, the project scope can be redefined.
2. Key assumptions and constraints need to be listed down. Few of them are listed. Identified resources are available and their backs up resources also are identified. Identified resources are aware of their roles and responsibilities. Identified delivery and quality representatives who can review the data as per the timeline specified. If they are not able to do so, backup‟s signoff would be sought. Access to existing data on identified process variables is available to the team for analysis. Identified team members already posses the knowledge on Process Performance Models. Detailed training plan will be drawn out for training existing and new members on the process model.
3. The requirements for the model should be clearly articulated. Re-validate the appropriate process variables that influence the customer satisfaction score to predict customer satisfaction. The selection and usage of the process variable for prediction should be such that the predicted value nearly matches the actual value. Corrective actions should be planned based on the predicted values as appropriate.
4. Bottom up estimation need to be performed. Identify the type of resources required and their involvement. For example, PPM subject matter expert for 10 hrs a week. Project Associate full time for 2 months and so on. Identify the stakeholders. The project sponsor and owner should review and approve the estimates [3].
5. Clearly document the quality objectives and prepare the quality plan. For example, roll out pilot version of revised customer satisfaction model by 2nd week of August 2012. Review criteria to be defined. For verification and validation, clear mention that the Business Delivery Head will review and provide approval on the new process model for roll out.
6.
Project risks should be clearly listed. For example, there is a risk of schedule slippage if skilled resources are not available for this project. As mitigation, Commitment to be sought from Chief Quality Officer and Delivery Head on resources identified.
7.
Identify the key metrics for collection in the project and prepare the measurement plan. Organization Metric Subject Matter Expert would be consulted and appropriate changes will be incorporated. Team is also expected to come up with a detailed measurement plan which highlights the operation definition, measures, computation, and frequency, method of collection, analysis frequency, reporting method and distribution list. Few metrics are listed below.
CSS Prediction Accuracy - Operation Definition and frequency to be defined during the kick off meeting.
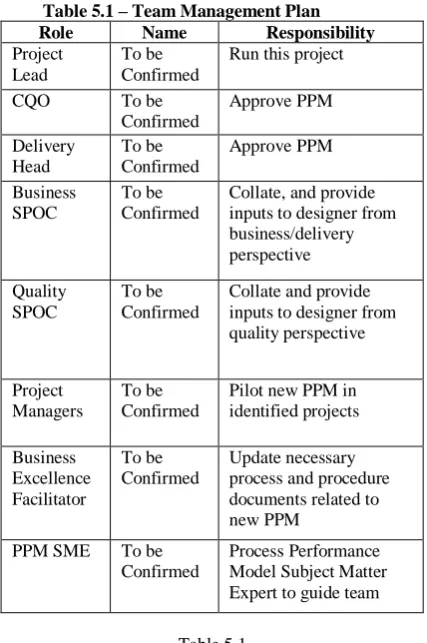
Table 5.1 – Team Management Plan
Role Name Responsibility
Project Lead
To be Confirmed
Run this project
CQO To be Confirmed
Approve PPM
Delivery Head
To be Confirmed
Approve PPM
Business SPOC
To be Confirmed
Collate, and provide inputs to designer from business/delivery perspective
Quality SPOC
To be Confirmed
Collate and provide inputs to designer from quality perspective
Project Managers
To be Confirmed
Pilot new PPM in identified projects
Business Excellence Facilitator
To be Confirmed
Update necessary process and procedure documents related to new PPM
PPM SME To be Confirmed
Process Performance Model Subject Matter Expert to guide team
Table 5.1
9. Identify the repository to maintain the artifacts, could be the quality management site itself and prepare the configuration management plan. A separate link can be created to maintain artifacts.Identify the administrator. The project lead for this project can act as a backup for the administrator. It is also important to clearly identify the sub folders where the artifacts can be stored. All team members would be given read/write access to input and work folders. Output folder which would contain the baseline versions would have restricted access.
10. Prepare the communication management plan. Sample plan is as shown below in Table 5.2
Table 5.2 – Communication Management Plan
Deliverable Project Status Report
Frequency Every Monday during project life cycle
Responsible Project Lead
Audience Project Team
Method of Communication Weekly Team Meeting
Minutes of Meeting Project Lead
11. Identify the key stakeholders for the project and list their roles and responsibilities. Few of the roles that can
be part of stakeholder management plan are as mentioned below.
Project Managers - Managers are the practitioners who could provide real time inputs on customers expectations and project performance.
Delivery Leader - Delivery Leader provides holistic input from the vertical and organization perspective on the pain points and highlights the focus areas.
Quality team - They provide subject matter expertise on process performance model, measurement and quantitative management.
12. The overall process to be used for the model development need to be identified. Project Management is the discipline of planning, organizing and managing resources to bring about successful completion of specific project goals and objectives. The phases to be considered are project initiation, planning, execution, monitoring and closure.
Project Initiation. This phase of the project determines the nature and scope of the project. This is a critical phase for the project to be successful as the business environment, organizational objective are defined here. The objective of customer satisfaction model need to be clearly articulated. Project charter is prepared as a deliverable for this phase.
Project Planning. Detailed scope, identifying the risks, assumptions, constraints, list of stakeholders, communication network, quality objectives, the resource plan, detailed schedule, and budget are laid down. Project plan is the deliverables for this phase.
Project Execution. Execution phase involves co-coordinating resources as well as integrating the activities to complete the defined tasks in accordance with the project management plan. Deliverables are outputs as defined in the project management plan.
Project Monitoring and Control. This phase consists of those processes performed to monitor project execution so that potential problems can be identified in a timely manner and corrective action can be taken, where applicable, to control the execution of the project. This involves measuring ongoing project activities, monitoring project variables, identifying root causes for variations and identifying corrective actions.
Project Closure. This phase of the project includes the formal acceptance of the project and the ending thereof. All activities across all functional groups are finalized and project is formally closed. Capturing the lessons learnt, administrative activities like archiving are part of this phase. A notification on the final closure of the project is sent to all the stakeholders.
Initiation is planned for 3 weeks. On approval of plan by senior management, project planning phase is kicked off. Project planning includes detailed project plan with all plan components as highlighted in the earlier sections. Project planning is planned for 3 weeks. Project Execution would cover the design of the new model, development of the model and testing. It is planned for 3 weeks. This includes planning for review and rework. Project Monitoring and Control phase is when the pilot project is tracked. Duration planned is for 8 weeks. Project Closure is planned for 3 weeks. During this phase the feedback, data points, best practices and lessons learnt are documented. Dependencies amongst the key activities are as highlighted below.
14. Value Addition. The basic assumption for the process model was that the process variables listed were not probably the right ones and some new variables were suggested. But the next question that arises is whether these new variables are adequate. The fundamental context of this project is pro-actively managing customers so that existing business is retained and expanding the current scope of work can be looked at. Do they just capture the basic hygiene factors or do they help in really going that extra mile? To deliver on quality, on time, on budget, without escalations can be looked at as very basic expectations when the project is awarded to a vendor. So apart from delivering them to the expectations, what could be done differently? The answers should help to define the objectives clearly.
Few factors that can be considered as process variables are further refrained after brainstorming. The finalized operational definition and measurement system are value additions proposed as part of execution of the project, potential additional work that was lost to other competing vendors, potential additional work that can targeted and pro-active aspects that could be targeted to win those, how many times the client has renewed the contracted with the vendor.
The above mentioned factors are vital differentiators to convert customer satisfaction to customer delight and loyalty. Unless these are measured and tracked improvements are not possible.
7.
CONCLUSION
The context of the organization is important in building predictive process models. The standard parameters like not meeting the schedule or cost, so the customer is not happy, is not adequate [16]. IT organizations focus on value additions to the customer is growing day by day. Organizations strive to take corrective actions, but the predictive behavior has been very subjective [15]. Attempts are made to build a predictive model. But the case study revealed that the basic parameters might not be the direct factors, it has to be further drilled down to identify the phase in which this matters. The number of escalations, number of pending action items, pro-active reviews closed on time, number of new wins within the account and many more factors could influence. In spite of the advantages in these predictive models, only a small section of the manager community is actually aware of its existence. The understanding of right influencing factors and the sub process is the key. If the right factors are not selected, then the model remains a theory.
Awareness workshops can be planned and social forums can be effectively utilized to share the knowledge. The statistical thinking should be invoked in the manager community. This is a mind-set change that needs to be handled well in the organization. When the team is comfortable and understands the value that the project can derive from these predictive models, pro-active management will no longer be a theory in organizations
.
8.
REFERENCES
[1] Harold Kerzner, 2004, „Advanced Project Management: Best Practices on Implementation‟, John Wiley & Sons ©, 2nd ed
[2] William A. Florac, Anita D. Carleton, 1999, „Measuring the Software Process, Statistical Process Control for Software Process Improvement‟. Addison-Wesley Professional, 1999
[3] Richard D. Stutzke, 2005, „Estimating Software-Intensive Systems: Projects, Products, and Processes,‟ Addison-Wesley.
[4] Dr.J.Venkatesh & Priyesh Cherurveettil, „Improving User Experience by using Agile Methodologies‟, International Journal's Research Journal of Science & IT Management, ISSN 2251-1563, Vol 1, No 7 (2012)
[5] Robert W. Stoddard, 2007, „CMMI Process Performance Models and Reliability‟, Carnegie Mellon University‟, IEEE Reliability Society Annual Technology Report.
[6] CMMI® Product Development Team, CMMI for Development, Version 1.2, CMMI-DEV, V1.2. Carnegie Mellon University, Pittsburgh, PA.
[7] Raymond J. Madachy and Barry W. Boehm, 2005, „Software Process Modeling with System Dynamics‟ JohnWiley & Sons.
[8] Umesh Kumar Mishra, K. Harihara sudhan, Shalu Gupta. „Establishing Process Performance Baselines and Models for Statistical Control of Software Projects‟, Proceedings of ASCNT-2011, CDAC, Noida, India
[9] Stephen H. Kan, 2002, „Metrics and Models in Software Quality Engineering‟, 2nd
ed.
[10] Dr.J.Venkatesh & Priyesh Cherurveettil, „Using Application Performance models to achieve improved customer satisfaction‟, International Journal of Research in Management & Technology (IJRMT), ISSN: 2249-9563 Vol. 2 No.2, April 2012
[11] Bill Self, Greg Roche and Nigel Hill, 2002, „Customer Satisfaction Measurement for ISO 9000: 2000‟
[12] Michael Johnson and Anders Gustafsson, 2000, „Improving Customer Satisfaction, Loyalty and Profit‟
[13] Dr.J.Venkatesh & Priyesh Cherurveettil, „Fixed Bid Pricing expectations in Agile Models‟, International Journal of Recent trends in Engineering and Sciences, ISSN 2277-3258, Vol 2, Issue 2
[14] Margaret K. Kulpa and Kent A. Johnson, 2008, „Interpreting the CMMI: A Process Improvement Approach‟, 2nd ed.
[15] Dr.J.Venkatesh & Priyesh Cherurveettil, „Institutionalization of Process Performance Models in IT organization‟, International Journal of Emerging Technology and Advanced Engineering, ISSN 2250-2459, Volume 2, Issue 4, April 2012