Image Processing and Particle Analysis for Road
Traffic Detection
Aditya Kamath
Manipal Institute of TechnologyManipal, India
Abhijeet Khanna
Manipal Institute of TechnologyManipal, India
ABSTRACT
This article presents a system developed using graphic programming on LabVIEW using image processing and particle analysis so as to indicate increase in vehicular density on particularly traffic-prone roads and hence alert necessary officials of the same instantly. This system primarily focusses on the vehicular density and sets specific thresholds in accordance with the time of the day to give almost accurate results. It also displays an application of computer vision for traffic flow management and road traffic analysis. The method mentioned provides the functionality of alert during times of road clogging and will hence; ensure immediate rectification of the same.
General Terms
Particle Analysis, LabVIEW, Graphical Programming, Image Processing Applications
Keywords
Computer Vision, Traffic Analysis, Image Processing, Particle Analysis, Visual Programming.
1.
INTRODUCTION
In metropolitan cities, especially in overpopulated countries like India, control and regulation of traffic is a very crucial detail to ensure safety for commuters. A recent boom in vehicular numbers just elevates this problem. It is imperative that appropriate measures be taken to curb this problem or at least develop a system to be precise enough to reduce it to a great extent, while decreasing human effort at the same time. The approach in this article focusses on methods of image processing and computer vision using pre-defined modules of pattern analysis and image filtering with a user-friendly interface for data calibration. This real-time system is based on stationary video cameras connected to computers/processing devices.
The objective of this document is to provide solution to the aforementioned problem of excessive road traffic using National Instruments’ visual programming language, LabVIEW. Usage of graphical programming enables easy debugging, easy calibration and hence ensures greater accuracy.
Several other systems involving the same idea have been implemented [1][2] but this system aims at reducing computational costs with respect to simplicity in the algorithm used and the increasing of efficiency due to additional debugging capabilities.
2.
OVERVIEW
This section covers the details regarding preparation of the system, the algorithms and calculations used and a description of the development environment.
2.1
Overview of LabVIEW and graphical
programming
LabVIEW, short for Laboratory Virtual Instrumentation Engineering Workbench is a visual programming software developed by National Instruments. LabVIEW is used usually for data acquisition, instrument control and industrial instrumentation. For additional functionality, LabVIEW has various modules like, Vision and Motion, Robotics, Data Acquisition which can be used instead of standard modular programming for an easier approach to the end result of a project. Graphical programming is a kind of programming method incorporated in LabVIEW. This includes usage of modules for particular functions. Such a method of programming increases the capability of debugging to a great extent and allows easy programming.
2.2
Image Processing methods used
This system involves usage of various pre-defined image processing modules and algorithms to get a more advanced image from road traffic camera footage.
Following are the methods used:
2.1.1 Color plane extraction
An RGB image (of three color planes – red, green and blue) is converted into an 8-bit grayscale image by extracting the information of a single color plane and discarding all the other elements of the original image. The final image after this method is made of three parameters – hue, saturation and luminance (HSL). Leaving just the luminance plane, a final grayscale output is extracted.
2.1.2 Image reversal
This is a particular toll in the grayscale image tab which operates on 8-bit grayscale images only. This method involves inverting the intensity of gray in the images. Grayscale involves an image of varied intensities. 255 for white and 0 for black. The intensity value at every point is subtracted from 255 to get the inverted intensity.
2.1.3 Gray morphology
This tool performs the basic grayscale morphological operations:
d. Close e. Proper open f. Proper close
[image:2.595.332.523.72.211.2]This idea uses the process of Proper Open Gray morphological filter. As mentioned in a lecture by Gleb V. Tcheslavski [3], the opening and closing of images can have a simple geometric interpretation. Assuming the image as a function f(x,y) is viewed as a three-dimensional surface, the opening of the function f(x,y) by a structuring element b(x,y) can be stated as the pushing of the structural element from below, against the undersurface of f(x,y).
Figure 1: Description of Open and Close operations on images
On opening, the intensity of all bright particles in the image is decreased, depending upon the sizes of the particles in comparison with the structural element. This method was chosen with the basic intention that the total image is a bit brighter considering this image, unlike the erosion operation has negligible effects on the dark regions of the image.
2.1.4 Grayscale thresholding
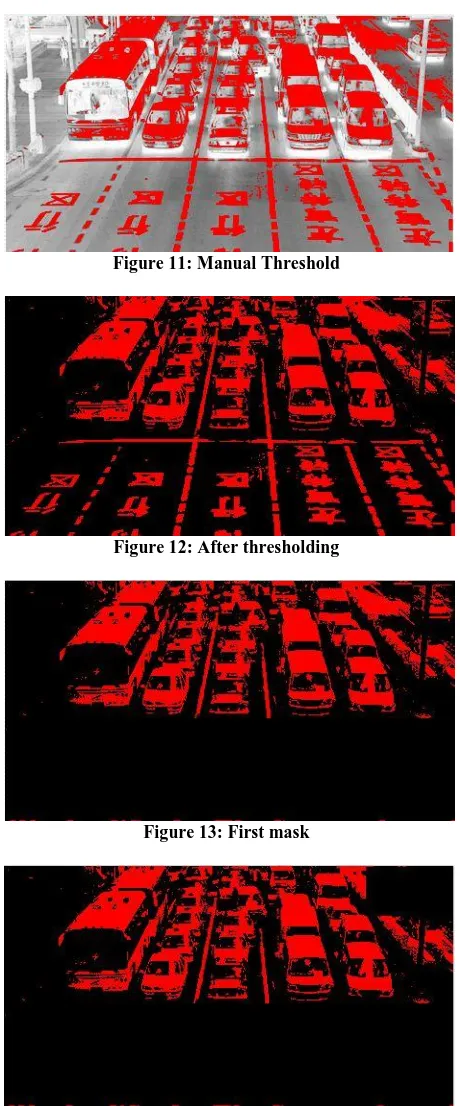
This method involves conversion of a grayscale image to a binary image with respect to a threshold value manually chosen using a scroll-bar on the tool in LabVIEW. The threshold is in essence an intensity value. All pixels with intensities above this value is maintained as one color and all intensities below the value are set as the other color (Black or Red, according to manual controls on LabVIEW. This is further changed to Black and White for processes later).
2.1.5 Image masking and arithmetic
operations
[image:2.595.58.283.214.383.2]These toolboxes consist of arithmetic and logical operations to be performed on the captured images. To provide additional accuracy to the program, images of the empty road are captured and appropriate logical expressions are created to remove the parts of the road observed by the camera during the times of traffic. This leaves only the images of the vehicles in the final output. Now, regions that are not required are masked, i.e. those parts are removed from the image. The final output displays only the vehicles on the road.
Figure 2: Filtering procedure
2.3
Hardware Review
Although this system can be incorporated using feed from the cameras installed on the roads/junctions, special equipment from National Instruments will be helpful at locations where high amounts of processing is required. The NI Smart Cam 17xx series is a range of cameras by National Instruments which have inbuilt processers that process data and output only necessary information.
2.4
System Overview
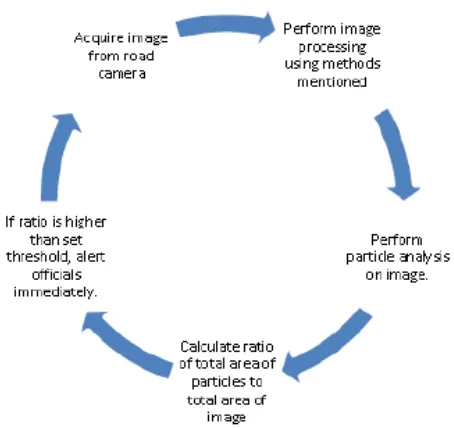
Figure 3: Basic System Algorithm
Once the system described in Figure 1 is designed on LabVIEW, it is incorporated on-site. The description is showed in detail in Figure 2.
Thresholding (manual or automatic) Masking
[image:2.595.316.543.378.592.2]Figure 4: On-site system description
3.
DESIGN AND METHODOLOGY
3.1 Design process
Image processing on LabVIEW involves a Vision Assistant module, a tool which can be used to incorporate morphological filters, logical operations and other methods mentioned with sufficient ease. The installation of this system is done in the control room and the initial calibration is done on both empty roads and ones with vehicles.
An image of the empty road is captured in different times of the day, masked and is compared with the masked image of the same road with traffic using the exclusive OR (XOR) operation. The end result is an image showing objects not present in one of the images only, i.e. vehicles, in this instance.
Calibrations are performed on this final image. The images of the calibration process performed during prototyping are shown in Section 4 (Figure 3 to Figure 8).
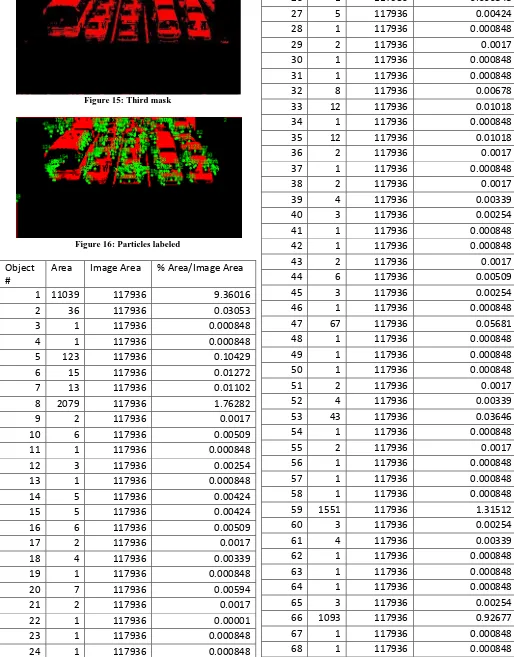
This calibration process is followed by the calculation of the area of the total part of the image in red. This is compared with the total area of image and is then compared with a set threshold. If the amount of red is more, a signal indicating high road traffic is initiated. All of this is done using the Particle Analysis tool. This tool generates an automated report regarding the particles in the image. The parameters can be chosen. An example of such a generated report is shown in Section 4 (Figure 9)
3.2 Errors and rectifications
A huge hurdle faced during the development of this system was the change in threshold values in different intensities of light. One rectification method thought of was using inbuilt LabVIEW modules to increase light intensity in the received video stream in inverse proportion to the time of the day or the intensity of light at the time. As the implementation of this was quite difficult and created errors in debugging, a simpler system was thought of – the usage of a highly sensitive light intensity detector. A small prototype was made using the Arduino development board and the Arduino IDE to detect analog values given by a Light Dependent Resistor (LDR) and change in threshold values accordingly. The same system could be implemented in this case.
The sensor could detect light intensity at times and can measure pre-defined threshold and ratio values from an already calibrated Look Up Table (LUT) which can be
defined in LabVIEW. This could give more accurate values and data at all times of the day.
3.3 Improvement, current and future works
This segment describes future implementations of this system and modifications for modular use in different cases.
3.3.1 Inclusion of microphones
This idea requires the usage of microphones to detect anomalies in physical noise levels. This system then can be integrated with the aforementioned system to get more accurate results. This is in accordance with the fact that there might be incidents like accidents which might not cause clogging of the roads.
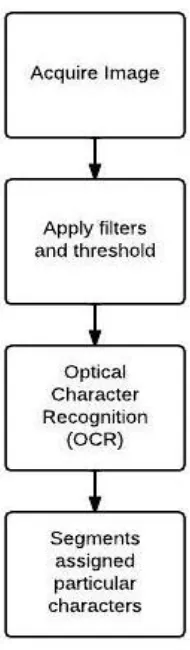
3.3.2 Automatic number plate recognition
Several ideas of the usage of number plate recognition for using image processing have been developed. Ideas by Kim et al [4] or Hansen et al [5] have been implemented successfully but none of these ideas have implemented LabVIEW. Building on one of the LabVIEW implementations by Kuldeepak, Kaushik and Vashishath [6], this development includes the usage of the LabVIEW toolkit of Optical Character Recognition (OCR) to detect and recognize alphanumeric details on number plates of vehicles. Errors in this idea include different placements of number plates and this could possibly be standardized for rectification. A basic algorithm is mentioned in the flowchart below.
[image:3.595.380.475.399.724.2]3.3.3 Efficient traffic light control
This could be controlled in relation with the thresholding and particle analysis to control traffic lights during times of road clogging. Road/Junction traffic could be controlled by giving more preference to the roads with more density of vehicles. Although several systems [7] have been developed on the same idea, the same can be implemented as an addition to the system described in this paper.
3.3.4 Prevention of traffic signal violation
Implementation of this idea needs the usage of cameras to detect motion/discrepancies in stream after thresholding in the area in front of the traffic signals. If any values are detected in the region with motion in a particular direction, the cameras for number plate recognition is initiated.3.3.5 Implementation of machine learning for
automatic thresholding
This idea involves usage of machine learning algorithms to train the system so as for it to learn to change threshold values automatically according to light intensity.
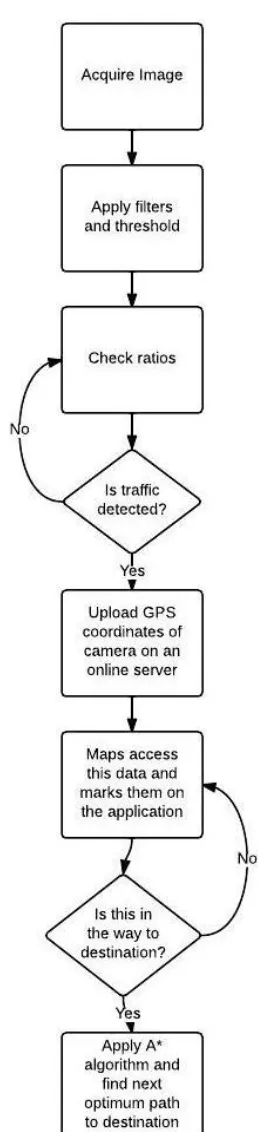
[image:4.595.362.491.68.634.2]3.3.6 Transmission of road traffic data to user
Owing to the major usage of smart-phones in the current world, this solution requires the development of applications in major mobile operating systems. A basic algorithm for the process of the application is mentioned in the flowchart below.4.
FIGURES/TABLES
Figure 7: Original Image
Figure 8: Extracting HSL luminance plane
[image:5.595.54.285.61.639.2]Figure 9: Image reversal using LUTs
[image:5.595.315.545.65.618.2]Figure 10: Proper open gray morphological filter
Figure 11: Manual Threshold
Figure 12: After thresholding
Figure 13: First mask
Figure 15: Third mask
Figure 16: Particles labeled
Object
#
Area
Image Area
% Area/Image Area
1 11039
117936
9.36016
2
36
117936
0.03053
3
1
117936
0.000848
4
1
117936
0.000848
5
123
117936
0.10429
6
15
117936
0.01272
7
13
117936
0.01102
8
2079
117936
1.76282
9
2
117936
0.0017
10
6
117936
0.00509
11
1
117936
0.000848
12
3
117936
0.00254
13
1
117936
0.000848
14
5
117936
0.00424
15
5
117936
0.00424
16
6
117936
0.00509
17
2
117936
0.0017
18
4
117936
0.00339
19
1
117936
0.000848
20
7
117936
0.00594
21
2
117936
0.0017
22
1
117936
0.00001
23
1
117936
0.000848
24
1
117936
0.000848
25
1
117936
0.000848
26
1
117936
0.000848
27
5
117936
0.00424
28
1
117936
0.000848
29
2
117936
0.0017
30
1
117936
0.000848
31
1
117936
0.000848
32
8
117936
0.00678
33
12
117936
0.01018
34
1
117936
0.000848
35
12
117936
0.01018
36
2
117936
0.0017
37
1
117936
0.000848
38
2
117936
0.0017
39
4
117936
0.00339
40
3
117936
0.00254
41
1
117936
0.000848
42
1
117936
0.000848
43
2
117936
0.0017
44
6
117936
0.00509
45
3
117936
0.00254
46
1
117936
0.000848
47
67
117936
0.05681
48
1
117936
0.000848
49
1
117936
0.000848
50
1
117936
0.000848
51
2
117936
0.0017
52
4
117936
0.00339
53
43
117936
0.03646
54
1
117936
0.000848
55
2
117936
0.0017
56
1
117936
0.000848
57
1
117936
0.000848
58
1
117936
0.000848
59
1551
117936
1.31512
60
3
117936
0.00254
61
4
117936
0.00339
62
1
117936
0.000848
63
1
117936
0.000848
64
1
117936
0.000848
65
3
117936
0.00254
66
1093
117936
0.92677
67
1
117936
0.000848
[image:6.595.39.553.97.754.2]69
1
117936
0.000848
70
3
117936
0.00254
71
2
117936
0.0017
72
1
117936
0.000848
73
4
117936
0.00339
74
5
117936
0.00424
75
4
117936
0.00339
76
3
117936
0.00254
77
1
117936
0.000848
78
2
117936
0.0017
79
2
117936
0.0017
80
1
117936
0.000848
81
8
117936
0.00678
Total
16247
117936
13.775304
[image:7.595.38.296.77.374.2]Percentage
=16247/117936*100
13.77611586
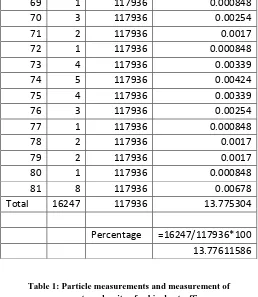
Table 1: Particle measurements and measurement of percentage density of vehicular traffic
Graph 1: Particle measurements and measurement of percentage density of vehicular traffic
5.
CONCLUSION
In conclusion, this system could be implemented in the present day scenario regarding road traffic detection and control while reducing manual video stream monitoring time (reduction of human effort). In addition, this system is fairly simple to incorporate and calibrate and as all codes can be converted into executable files, no extra software
requirements are required with the currently used systems.
6.
REFERENCES
[1] V. Kastrinaki, M. Zervakis and K. Kalaitzakis, “A Survey of Video Processing Techniques for Traffic Applications”, Image and Vision Computing, vol. 21, pp 359-381, Apr 1, 2003.
[2] E. Atkociunas, R. Blake, A Juozapavicius and M. Kazimianec, “Image Processing in Road Traffic Analysis”, Nonlinear Analysis: Modelling and Control, 2005, vol. 10, no. 4, pp 315-332
[3] Morphological Image Processing: Gray Scale Morphology, Gleb V. Tcheslavski. http://ee.lamar.edu/gleb/dip/index.htm
[4] Kim, K. K., Kim, K. I., Kim, J.B., and Kim, H. J., "Learning based approach for license plate recognition", Proceedings of IEEE Processing Society Workshop on Neural Networks for Signal Processing, vol. 2, pp: 614- 623, 2000.
[5] Cowell, J., and Hussain, F., "Extracting features from Arabic characters",Proceedings of the IASTED International Conference on COMPUTER GRAPHICS AND IMAGING, Honolulu, Hawaii, USA, pp. 201-206, 2001
[6] Kuldeepak, Monika Kaushik, Munish Vashishath, License Plate Recognition System based on Image Processing Using LabVIEW. International Journal of Electronics Communication and Computer Technology (IJECCT), Vol 2, Issue 4, July 2012
[7] Pallavi Choudekar, Sayanti Banerjee and M. K. Muju, “Real Time Traffic Light Control Using Image Processing” Indian Journal of Computer Science and Engineering (IJCSE), vol. 2, no. 1, ISSN: 0976-5166.
0 5 10 15
0 20 40 60 80 100