Munich Personal RePEc Archive
Crop and Milk Production Structure of
Smallholders in Ethiopia
Mariam, Yohannes and Coffin, Garth
12 April 1993
Crop and Milk Production Structure of Smallholders in Ethiopia
Yohannes Kebede (also known Yohannes Mariam) 1/, Garth Coffin2/ 1/
Washington Utilities and Transportation Commission, Olympia, WA, 2/ Formerly Associate Professor and Associate Dean, Faculty of Agricultural and Environmental Sciences, McGill
University
Abstract
Radical changes took place with respect to several agricultural policies in Ethiopia in 1990-91. Different agricultural technologies were being delivered by several international agencies. Shifts in government policies and technological intervention would induce changes in the production structure of peasants that make-up 85% of the country's population.
To examine changes in crop and livestock production, statistical analysis of production structure is carried out for major crops grown and milk produced by farmers who have adopted cross-bred cows (test) and those who have not adopted (Control) in the Selale and Ada districts in Ethiopia. Analysis of changes in production structure indicate that the increases in production were greater among test compared with control farmers in both study sites.
Physical factors such as land, labour, oxen and seeding rate exert positive and significant impacts on the amount of crop produced. However, the impact of non-physical resources such as indigenous production knowledge is not only greater than most physical resources or inputs but also indicates that it is location-specific. That is, the impact of production knowledge is larger on the amount of grain produced by farmers living in regions with greater comparative advantage for grain production (Ada).
Physical factors such as grazing area and concentrates and number of cows exert significant impacts on the amount of milk produced in the region with greater potential for livestock production (Selale). Differences in the resource base, enterprise-specific experience and the availability of preconditions (infrastructure) influence the impact of inputs on the level of outputs. Livestock production knowledge exert greater influence on the amount of milk produced per cow in the Selale than in the Ada region.
The impact of most farm inputs is greater when farmers adopt fertilizer and pesticides (Ada) or fertilizer and cross-bred cows (Selale). Thus, package approach to technological intervention may not necessarily contribute to sustainable increases in food production. Instead, introduction of selective mixes of production technologies compatible with comparative
Crop and Milk Production Structure of Smallholders in Ethiopia
Introduction
Agriculture is an important economic sector of most nations. It's role in employment,
generation of foreign exchange, supply of food and feed is critical to developing countries. It is now widely believed that, while extremely unbalanced investment strategies is not plausible, significant emphasis should be given to agricultural development (Kebede, 1993). The problem, however, is to examine alternatives that are acceptable to farmers, do not require significant changes in social, cultural, economic, technical and environmental configuration of pre-existing farming system(s). Analysis of the structures of production is expected to provide evidence on specific components of crop and livestock production on which intervention strategies should focus.
those which are over-utilized.
Agricultural production involves the use of indigenous and imported inputs. Crop
varieties and livestock breeds which exhibit characteristics similar to local cultivars or breeds are options which have been introduced in peasant agriculture since the 1960s. These intervention strategies facilitate the transition from local methods of production and do not require significant shifts in resource allocation, production knowledge and established customs associated with production of crops and livestock. However, evaluation of the impact of these innovations was conducted for specific areas in southeastern provinces of Ethiopia (Waktola, 1980).
Adoption of different combination of technologies produce different amount of output. This study hypothesizes that production augmenting technologies exert significant impact on the level of output compared to traditional inputs (e.g., labour and land). Moreover, it is
hypothesized that selective mixes of production technologies will have greater impact on the level of output compared to the use of single traditional input or new technology. Evidence on these and related issues may help to formulate "appropriate" agricultural policies and research programs in crop and livestock production that may enable the attainment of food
self-sufficiency.
The Study Sites
Selale is representative of the high altitude zone (more than 2000 metres above sea level) of the country. The major crops grown in Selale include oats, teff, barley, wheat, horse beans and field peas. The average farm size is 3.1 hectares, 30 percent of which is used as permanent pasture or grazing land with the rest cultivated. The average livestock holding is 3.5 cows, 1.8 oxen, 0.55 bulls, 1.8 young animals and 2.96 calves (FINNIDA, 1989). Farmers have extensive experience in livestock production than the Ada region.
Ada is characterized by mild weather and represents the country's large middle-altitude cropping zone (1500 to 2000 metres above sea level). The major crops grown include teff, wheat, barley, horse beans, chickpeas and field peas. The average farm size is 2.6 hectares. There is virtually no fallow land. The average livestock holding is 1.28 cows, 1.98 oxen, 0.50 bulls, 0.53 young animals and 0.84 calves (Gryseels and Anderson, 1983). Compared with the Selale region, Ada farmers specialize more in crop production in which they have extensive experience.
A summary of selected socioeconomic characteristics of farmers in both study sites is presented in Table 1. The statistical analysis of this profile suggests that the two regions exhibit statistically significant differences with respect to the: I)number of household members who are independent, ii)number of years of schooling, iii) number of years of farming experience as an independent farmer, iv) number of livestock owned, vi) average income received from the sale of grain, livestock and fuel wood, vii) crop and grazing area, viii) amount of milk produced per household and ix) amount of grain produced (Table 1).1
Table 1: Selected Characteristics of Selale and Ada Farmers
Selale Ada
N Average N Average F-Value Prob>F1/ No. of Household Members who are: Dependent 173 4.47 41 4.29 0.412 0.469
Independent 207 1.75 48 1.5 4.52 0.03*
Education of Household Head (yrs) 55 2.5 23 3.6 5.671 0.001* Experience (years): Dependent 176 11.24 50 13.44 0.044 0.83
Independent 176 24.58 50 27.88 4.173 0.04** Income (Ethiopian birr) from Sale of: Grain 203 230.27 49 828.6 65.46 0.006*
Livestock &
Livestock Products 194 451.4 22 203.11 1.09 0.058**
Fuel wood 169 343.58 31 63.97 13.84 0.004*
Expenses (Ethiopian birr) for Purchase of food 214 268.2 50 228.14 2.366 0.125
Clothing 205 114.49 39 106.09 0.309 0.579 Milk production (in liters) per
Month: Local cows 193 56.9 35 42.6 6.79 0.05**
Cross-bred cows 66 320.35 14 186.29 5.76 0.011*
Area under (hectares) Crop 217 2.5 52 2.3 19.56 0.001*
Grazing 208 0.8 37 0.2 26.29 0.006*
Livestock Number 165 10.89 16 5.18 0.69 0.016*
Crop Production ('00kg) 217 14.88 52 21.41 2.98 0.05**
1/ * and ** refer significance at 1 and 5 percent respectively; the F-values test differences in the average values of socioeconomic characteristics between Selale and Ada farmers.
Ada farmers had more years of schooling and more years of farming experience. They gain most of their income from the sale of grain while Selale farmers rely mostly on sales of livestock and livestock products. The productivity of livestock (milk/cow) is higher among Selale farmers while Ada farmers produce greater crop yields per hectare.
Design of the Study
Several crop production technologies are introduced in the study sites since the 1960's. However, introduction of cross-bred cows took place not only recently but also implemented by different agencies with relatively different approaches to technological introduction.
Furthermore, this research was conducted to provide information on the socioeconomic feasibility of cross-bred cows. Therefore, it was felt appropriate to compare farmers who have adopted cross-bred cows (test) and those who did not (Control). These farmers may have adopted any combination of crop-production augmenting technologies.
Design of the Study
Several crop production technologies are introduced in the study sites since the 1960's. However, introduction of cross-bred cows took place not only recently but also implemented by different agencies with relatively different approaches to technological introduction.
Furthermore, this research was conducted to provide information on the socioeconomic feasibility of cross-bred cows. Therefore, it was felt appropriate to compare farmers who have adopted cross-bred cows (test) and those who did not (Control). These farmers may have adopted any combination of crop-production augmenting technologies.
Households which received cross-bred cows and were selected for this study in the Ada and Selale areas numbered 26 and 89 respectively.2 A confidence level of 95%, coefficient of variation of crop and milk yields of 96 percent and precision level of ± 20% resulted in a sample size of 89 farmers for the Selale region. For the Ada region, however, time and financial
resources limit the number of test farmers to only 26. Comparison of average values of
socioeconomic variables derived from a district-wide survey by the Ministry of Agriculture and average values of similar socioeconomic characteristics calculated from test farmers showed that the two data set are approximately the same. Therefore, the smallness of the sample size for the Ada region will not bias the foregoing analysis.
After determining the sample size, the need to use farmers who joined various programs as test groups necessitated the use of systematic selection of the control group.3 A method was designed such that all test farmers were compared with farmers who exhibit similar
socioeconomic characteristics (control farmers) but were different in ownership of cows (for details see Kebede,1993).
The control farmers were to have a comparable number of oxen, cows, sheep/goat, family size, age (farming experience), education, annual farm income and farm size (crop and grazing) with the test farmers. Moreover, the two groups had to exhibit similar ethnic, climatic and geographical characteristics. To accomplish this task, a three-step procedure was followed. Firstly, a group of farmers involving political leaders and elders in each peasant association were asked questions such as, "With whom do you think farmer "A" compares with respect to income, livestock holdings, living standard, etc., except that he does not own cross-bred cows?".4
Secondly, each test farmer was asked questions such as, "To whom do you think you are comparable with respect to income, livestock holding, family size, etc., except that you own cross-bred cows and the other farmer does not?". This method of identify a control farmer is difficult and socially controversial.5 Nevertheless, it would provide a clue to identifying control
3. The programs in question were those operated by the International Livestock Centre for Africa (ILCA), FINNIDA (Finnish International development Agency) and MOA (Ministry of Agriculture, Ethiopia).
4. A peasant association is a geopolitically delimited association of peasants covering an area of about 400 hectares. Political leaders are farmers who, through democratic election processes, were elected to take administrative positions within a peasant association.
farmers.
Thirdly, 150 farmers who did not receive cross bred cows were interviewed with respect to the above socioeconomic characteristics. The results were compared with background
socioeconomic data obtained from test farmers. Combination of the above three steps enabled identification of control farmers that were used in the present study.
The research involved interview, observation and participatory methods. Data collected from interviews include socio-economic characteristics such as schooling, production
knowledge, area, crops planted, number of livestock owned, milk yield, technologies adopted, and so on (Kebede, 1993).
Empirical Model specification
Various specification of relating inputs to outputs are used in empirical research. Inputs used in the production process cause variations in outputs. The response of outputs to the amount of inputs used can be represented by different kinds of mathematical or statistical models. There are controversies regarding the choices of functional forms in production function analysis (Chambers, 1988; Peterson and Hayami, 1977).
The present study uses parametric production function. Because of simplicity,
computational convenience and ease of interpretation, the modified Cobb-Douglas production function is selected as a functional form to evaluate the impact of inputs on the level of production realized by households (Jamison and Lau, 1982; Ward and Zahalka, 1983). The model is specified as follows:
N
K βi ( αo + παj Zj + U )
Y = πβ0 Xi exp j=1 ... (1) I=1
The multiplicative function in (1) can be written in log-linear form as follows: Log Y = δo + Σβi Log (Xi) + Σαj Zj + U ………... (2)
Where Y is output, X's are continuous inputs, Z's are dummy (0-1) variables, δo is the intercept, β and α are unknown parameters. Equation (2) is estimated by the ordinary least squares (OLS) technique for the control and test groups separately using cross-sectional data.
The Cobb-Douglas production functions are estimated for six crops commonly cultivated in Selale and Ada areas.6 The inputs include traditional (e.g. land and labour) and new
technologies. Adoption of a single or mixes of production technologies are anticipated to have a differential impact on the production structure (crops grown, inputs used and milk produced) of smallholders (Eisemon and Nyamete, 1988). To estimate the impact of traditional and new technologies on the amount of production, data are collected on production inputs and outputs produced. To minimize biases from aggregation, estimation is carried out for six major crops on a per plot basis. These include Eragrostis Abysinica (teff), wheat, barley, horse beans, field peas and oats. Moreover, cereal (which includes teff, barley, wheat and oats) make up the bulk of household's daily food intake. Thus, an aggregate function is estimated for cereals. The dependent variable is total output per plot for each crop. The inputs include area (in square
6
meter), seed (in kilogram), pesticides (kg), fertilizer (kg), labour (in mandays), oxen (in oxen days), plot characteristics recorded as (0-1) variable, black soil (0-1 variables), years of farming experience, number of days of visit by extension agent, technologies adopted, production knowledge and years of schooling.
There is no hard and fast rule to measure or quantify production knowledge. Problem solving tests are constructed to measure agricultural knowledge and skills related to current production technologies and practices. Answers obtained from problem solving tests are scored to compare variations in knowledge of farmers within and between regions (Kebede, 1993).
Empirical Results
Prior to performing production function analysis for each crop and by study groups, tests for structural changes or differences in crop and milk response functions are carried out (Kebede, 1993; Peterson and Hayami, 1977). Tests for differences in the structure of production are
performed to compare: I) regions, ii) all test and control farmers, and iii) test and control farmers in the Selale and Ada regions. The results are presented in Table 2.
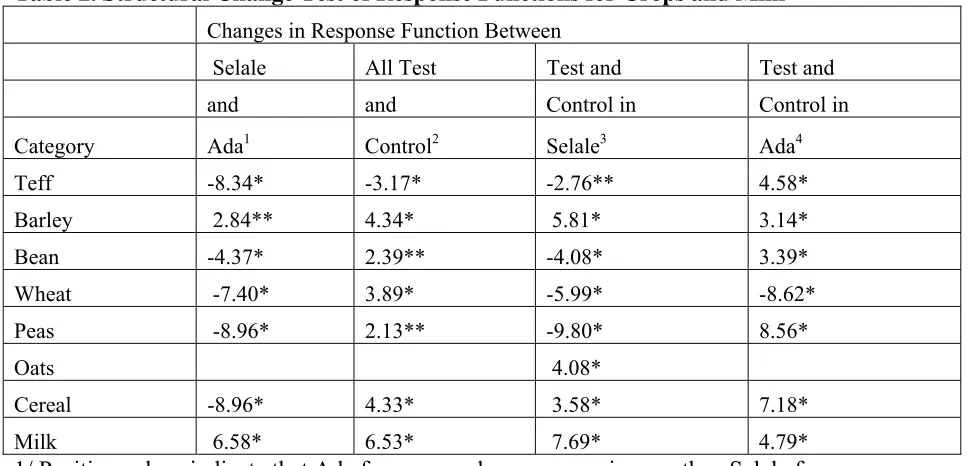
The results show that production of barley and milk by Selale producers is larger and statistically different from that of Ada farmers. Test farmers of Selale show positive and statistically different production structure for barley, cereal and milk compared to control farmers in the same region. Test farmers of the Ada region exhibit a positive shift in the
Table 2. Structural Change Test of Response Functions for Crops and Milk
Changes in Response Function Between
Selale All Test Test and Test and
and and Control in Control in
Category Ada1 Control2 Selale3 Ada4
Teff -8.34* -3.17* -2.76** 4.58*
Barley 2.84** 4.34* 5.81* 3.14*
Bean -4.37* 2.39** -4.08* 3.39*
Wheat -7.40* 3.89* -5.99* -8.62*
Peas -8.96* 2.13** -9.80* 8.56*
Oats 4.08*
Cereal -8.96* 4.33* 3.58* 7.18*
Milk 6.58* 6.53* 7.69* 4.79*
1/ Positive values indicate that Ada farmers produce more grain crop than Selale farmers. 2/ Positive values indicate that test farmers produce more than control farmers.
3/ and 4/ Respectively indicate that test farmers produce more than control farmers when the estimated values are positive.
production of milk (Selale) relative to control groups for both regions.
Production of most crops and milk by test farmers has shown a positive shift compared to control farmers. Furthermore, the response functions for crops exhibit positive shifts among Ada producers while that of milk production among Selale producers. These results suggest that there are differences in the impacts of inputs on outputs and that the structure of crops and milk
production across regions are different. Therefore, analysis of production decisions should proceed by region and farmer group.
Analysis of Crop Production By Region
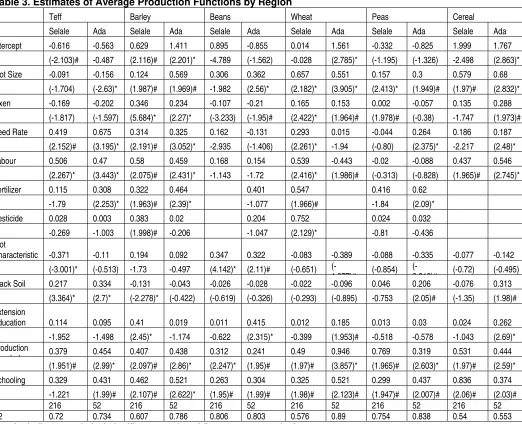
The results of statistical analysis of factors of production on the level of outputs by region are presented in Table 3. 8 Plot size exerts a positive and significant effect on most crops except on the production of teff (Table 3). Its effect on teff is negative. Teff requires larger number of oxen inputs to prepare the seed bed, and large amount of labour inputs to weed
several times, harvest and thresh on time. Yield of teff, however, do not increase proportionately with increases in plot size. Consequently, plot size may be negatively associated with the
production of teff.
The number of oxen inputs exert negative and significant impact on teff and beans cultivated in both areas. With increases in oxen input, plots become soft, and will be exposed to soil and water erosion, resulting in losses of nutrients. Therefore, higher oxen input may be associated with a decline in teff yield. Furthermore, soft seed bed causes bean plants to be weak, easily fall and rot as a result of wind drift. Oxen inputs, however, are positively and significantly associated with
8
the production of wheat, barley and cereal. The seeding rate shows a positive and significant
Table 3. Estimates of Average Production Functions by Region
Teff Barley Beans Wheat Peas Cereal
Selale Ada Selale Ada Selale Ada Selale Ada Selale Ada Selale Ada
Intercept -0.616 -0.563 0.629 1.411 0.895 -0.855 0.014 1.561 -0.332 -0.825 1.999 1.767
(-2.103)# -0.487 (2.116)# (2.201)* -4.789 (-1.562) -0.028 (2.785)* (-1.195) (-1.326) -2.498 (2.863)*
Plot Size -0.091 -0.156 0.124 0.569 0.306 0.362 0.657 0.551 0.157 0.3 0.579 0.68
(-1.704) (-2.63)* (1.987)# (1.969)# -1.982 (2.56)* (2.182)* (3.905)* (2.413)* (1.949)# (1.97)# (2.832)*
Oxen -0.169 -0.202 0.346 0.234 -0.107 -0.21 0.165 0.153 0.002 -0.057 0.135 0.288
(-1.817) (-1.597) (5.684)* (2.27)* (-3.233) (-1.95)# (2.422)* (1.964)# (1.978)# (-0.38) -1.747 (1.973)#
Seed Rate 0.419 0.675 0.314 0.325 0.162 -0.131 0.293 0.015 -0.044 0.264 0.186 0.187
(2.152)# (3.195)* (2.191)# (3.052)* -2.935 (-1.406) (2.261)* -1.94 (-0.80) (2.375)* -2.217 (2.48)*
Labour 0.506 0.47 0.58 0.459 0.168 0.154 0.539 -0.443 -0.02 -0.088 0.437 0.546
(2.267)* (3.443)* (2.075)# (2.431)* -1.143 -1.72 (2.416)* (1.986)# (-0.313) (-0.828) (1.965)# (2.745)*
Fertilizer 0.115 0.308 0.322 0.464 0.401 0.547 0.416 0.62
-1.79 (2.253)* (1.963)# (2.39)* -1.077 (1.966)# -1.84 (2.09)*
Pesticide 0.028 0.003 0.383 0.02 0.204 0.752 0.024 0.032
-0.269 -1.003 (1.998)# -0.206 -1.047 (2.129)* -0.81 -0.436
Plot
Characteristic -0.371 -0.11 0.194 0.092 0.347 0.322 -0.083 -0.389 -0.088 -0.335 -0.077 -0.142
(-3.001)* (-0.513) -1.73 -0.497 (4.142)* (2.11)# (-0.651)
(-1 977)# (-0.854)
(-2 01(-2)# (-0.72) (-0.495)
Black Soil 0.217 0.334 -0.131 -0.043 -0.026 -0.028 -0.022 -0.096 0.046 0.206 -0.076 0.313
(3.364)* (2.7)* (-2.278)* (-0.422) (-0.619) (-0.326) (-0.293) (-0.895) -0.753 (2.05)# (-1.35) (1.98)# Extension
Education 0.114 0.095 0.41 0.019 0.011 0.415 0.012 0.185 0.013 0.03 0.024 0.262
-1.952 -1.498 (2.45)* -1.174 -0.622 (2.315)* -0.399 (1.953)# -0.518 -0.578 -1.043 (2.69)*
Production
k l d 0.379 0.454 0.407 0.438 0.312 0.241 0.49 0.946 0.769 0.319 0.531 0.444
(1.951)# (2.99)* (2.097)# (2.86)* (2.247)* (1.95)# (1.97)# (3.857)* (1.965)# (2.603)* (1.97)# (2.59)* Schooling 0.329 0.431 0.462 0.521 0.263 0.304 0.325 0.521 0.299 0.437 0.836 0.374
-1.221 (1.99)# (2.107)# (2.622)* (1.95)# (1.99)# (1.98)# (2.123)# (1.947)# (2.007)# (2.06)# (2.03)#
N 216 52 216 52 216 52 216 52 216 52 216 52
R2 0.72 0.734 0.607 0.786 0.806 0.803 0.576 0.89 0.754 0.838 0.54 0.553
influence on most crops. Similar patterns of effects and degree of significance are observed for the labour input except on peas production which is susceptible to trampling.
The effects of pesticides and fertilizer are consistent across crops. In general, their effects are statistically significant only on barley and wheat grown in the Selale and Ada regions
respectively. Plot characteristics exerts a negative and significant effects on most crops except on barley and beans.
Barley is a crop that can be grown both in the short and main(long) rainy seasons. It requires a relatively short growing period. It is a crop which poor households use to fill deficits in their food consumption requirements through out the year. For better results, households manure this crop more than they do other crops. Beans are also helpful to supply green beans when households food stocks decline. In many cases, these crops are planted on plots closer to the farmstead. The plots on which they are planted are better situated, fertile and located on plains. Thus, plot characteristics can exert positive effects on these crops.
Black soil is treated as a separate variable because its effect on crop yield differ between Selale and Ada regions. Its effect is constrained by a water-logging condition in the Ada region and by soil erosion in the Selale region. It exerts a positive and significant effect only on teff and peas cultivated by Ada farmers. The reason for this pattern of effect is that these crops grow well on residual moisture of waterlogged plots.
Intra-Region Analysis of Crop Production
Statistical results regarding the influence of inputs on the level of production of test and control farmers in each study site are presented in Appendix 1. The effect of plot size on the level of production of most crops is statistically significant and positive. Oxen and labour input show similar influence on production of most crops. Seeding rate affect peas grown in both areas negatively but are not statistically significant.
Fertilizer exerts a positive and significant effect on crops cultivated by Ada farmers as do pesticides on crops cultivated by Selale farmers. Fertilizer has been used in the Ada area for several years compared to the Selale region. In the Selale area, on the other hand, not only did its usage start recently, but most of the plots are steep and expose fertilizer granules to soil erosion. Moreover, crops in the Selale region are damaged by rodents. Application of pesticides mixed with grain has reduced the effect of rodents, thus has increased yields of crops in the Selale area.
In the Ada region, however, competition arise between cheap labour migrating from crop deficit regions and the increasingly expensive and less effective herbicides. Households in the Ada region have to make a choice between hiring labour and purchase of herbicides to reduce the effects of weed infestations. It is not easy to get access to knapsack sprayers to apply herbicides or pesticides. Furthermore, herbicides or pesticides have side effects on the health of farmers. Labour from Ada region is expensive compared to that of migrant workers.8 Migrant
8
labourers come from a radius of 500 kilometers, and are mainly from regions that are grain deficit or do not specialize in grain production. Thus, Ada farmers may tend to hire labour for weeding rather than purchases of pesticides or herbicides. These factors may have contributed either negatively or insignificantly to the effect of pesticides on crop production in the Ada region.
Out of six group discussions held with farmers of Ada region, half of them have considered hiring labour, while the rest purchases of pesticides or herbicides. Thus, the results from group discussions are not conclusive. It is, however, possible to infer that households compare costs of repeated application of herbicides with that of hand weeding using hired labour.
Black soil has the effect of reducing barley, beans, peas and cereal production in the Selale area while its influence on other crops is positive and significant. Black soil retains moisture. Plots planted with barley and beans tend to be fertile. Fertile and high moisture
retaining plots cause barley plants to be weak, fall and rot as a result of wind drift. Peas requires relatively unfertile and coarse seed bed. Thus, black soil may cause excessive growth and less yield of peas.
Production knowledge exert a positive and significant effect on all crops. Schooling exerts similar effect but the magnitude of its impact is relatively smaller compared to production knowledge.
production knowledge. It is, therefore, not surprising that the effects of schooling and extension education are negative or insignificant (Eisemon and Nyamete, 1988).
The results from Table 4 also indicate that most physical variables (e.g., plot size) exert relatively similar effects on production of crops of test and control farmers. However, skill related variables (e.g., indigenous knowledge and schooling) exert larger and significant impact on production realized by test compared to control farmers.
The statistical results presented in Tables 3 and Appendix 1 indicate that crop area (plot size) and production knowledge consistently exert positive impacts on the level of production in both regions. Comparisons of all test with all control farmers by crop type indicate that most variables exert significant and positive effect on most crops cultivated by test farmers (Kebede, 1993).
Analysis of Milk Production Function
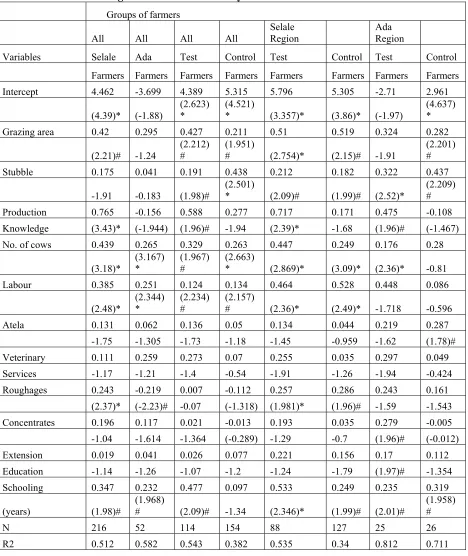
The results of statistical analysis of inputs that influence the amount of milk produced by each region, and by test and control farmers are presented in Table 4. Physical inputs such as grazing area exerts positive and significant impact on milk production of Selale farmers. The number of cows, labour, and schooling influence the level of milk production of both Selale and Ada regions. Atela, veterinary services and extension education positively influence the level of milk production of all group of farmers. However the influence of these inputs is not statistically significant. Skill related variables, production knowledge and schooling, positively and
Table 4. Estimates of Average Production Function by Test and Control Farmers1/
Groups of farmers
All All All All Selale
Region Ada
Region
Variables Selale Ada Test Control Test Control Test Control
Farmers Farmers Farmers Farmers Farmers Farmers Farmers Farmers Intercept 4.462 -3.699 4.389 5.315 5.796 5.305 -2.71 2.961
(4.39)* (-1.88)
(2.623) *
(4.521)
* (3.357)* (3.86)* (-1.97) (4.637) *
Grazing area 0.42 0.295 0.427 0.211 0.51 0.519 0.324 0.282
(2.21)# -1.24
(2.212) #
(1.951)
# (2.754)* (2.15)# -1.91 (2.201) #
Stubble 0.175 0.041 0.191 0.438 0.212 0.182 0.322 0.437
-1.91 -0.183 (1.98)#
(2.501)
* (2.09)# (1.99)# (2.52)* (2.209) #
Production 0.765 -0.156 0.588 0.277 0.717 0.171 0.475 -0.108 Knowledge (3.43)* (-1.944) (1.96)# -1.94 (2.39)* -1.68 (1.96)# (-1.467) No. of cows 0.439 0.265 0.329 0.263 0.447 0.249 0.176 0.28
(3.18)* (3.167) * (1.967) # (2.663)
* (2.869)* (3.09)* (2.36)* -0.81 Labour 0.385 0.251 0.124 0.134 0.464 0.528 0.448 0.086
(2.48)* (2.344) * (2.234) # (2.157)
# (2.36)* (2.49)* -1.718 -0.596 Atela 0.131 0.062 0.136 0.05 0.134 0.044 0.219 0.287
-1.75 -1.305 -1.73 -1.18 -1.45 -0.959 -1.62 (1.78)# Veterinary 0.111 0.259 0.273 0.07 0.255 0.035 0.297 0.049 Services -1.17 -1.21 -1.4 -0.54 -1.91 -1.26 -1.94 -0.424 Roughages 0.243 -0.219 0.007 -0.112 0.257 0.286 0.243 0.161
(2.37)* (-2.23)# -0.07 (-1.318) (1.981)* (1.96)# -1.59 -1.543 Concentrates 0.196 0.117 0.021 -0.013 0.193 0.035 0.279 -0.005
-1.04 -1.614 -1.364 (-0.289) -1.29 -0.7 (1.96)# (-0.012) Extension 0.019 0.041 0.026 0.077 0.221 0.156 0.17 0.112 Education -1.14 -1.26 -1.07 -1.2 -1.24 -1.79 (1.97)# -1.354 Schooling 0.347 0.232 0.477 0.097 0.533 0.249 0.235 0.319
(years) (1.98)# (1.968)
# (2.09)# -1.34 (2.346)* (1.99)# (2.01)# (1.958) #
N 216 52 114 154 88 127 25 26
finding from Table 4 is that skill related variables exert larger impact on the level of milk production of test farmers compared to control farmers in both study regions.
Agricultural Production and Adoption of Selective Mixes of Technologies
This study hypothesizes that inputs will have greater impacts on the level of production of producers who have adopted selective mixes innovations compared to those who have adopted none. Study farmers are grouped by the number of production technologies adopted. These groups are those who have used: i) fertilizer and pesticides, ii) fertilizer and improved seed, iii) improved seed and pesticides, iv) fertilizer and cross-bred cows, v) fertilizer, pesticides and cross-bred cows, vi) improved seed, fertilizer and pesticides and vii) none (control). The results of statistical analysis of the effects of these combinations of crop technologies on the amount of cereal produced are presented in Table 5.
Agricultural Production and Adoption of Selective Mixes of Technologies
22
Table 5: Estimates of the Impact of Inputs for Different Mixes of Crop Technologies
Fer+pest Fert.+seed Seed+pest
Fert.+see d Control (crop) Fert.+cow s Pest.+Fer + Control (milk)
Intercept 1.236 2.001 -1.014 -1.389 5.546 -2.406 2.811 3.117
(2.154)# (2.221)# (-1.09) (-1.453) -4.521 (-3.324)# -3.421 (2.971)*
Plot size 0.245 0.341 0.531 0.176 0.211 0.575 0.371 0.429
(2.984)* (2.771)* (2.98)* (1.962)# (1.97)# (2.773)* (2.001)# (2.07)#
Oxen/cows 0.541 0.245 0.221 0.191 0.438 0.413 0.512 0.472
(2.967)* (2.104)# (1.948)# (1.96)# -1.601 (2.287)* (1.974)# (2.101)#
Seed rate 0.265 0.256 -0.119
(2.03)# (2.741)* (-1.884)
Labour 0.401 0.404 0.312 0.108 0.423 0.477 0.303 0.413
(2.94)* (2.19)# (1.967)# (1.968)# -2.003 -1.95 -1.89 (2.103)#
Fertilizer 0.215 0.277 0.278
(3.21)* (2.96)* (2.117)#
Pesticides 0.421 -0.177 0.448
(2.778)* (-2.116)# (2.797)*
Plot -0.142 -0.211 -0.448 -0.273 -0.163
charact. (-1.665) (-1.97)# (-2.45)* (-2.98)* (-1.91)
Black soil 0.181 0.114 0.122 -0.107 -0.315
-1.711 -1.102 -1.93 (-1.09) (-1.219)
Extension 0.191 -0.217 0.178 0.119 -0.207 0.113 0.317 0.115
education -1.819 (-1.196) (1.994)# (1.97)# (-1.791) -1.411 (1.982)# (-1.329)
Production 0.828 0.633 0.561 0.515 0.466 0.978 0.606 0.433
knowledge (2.357)* (3.17)* (2.29)# (3.09)* (1.98)# (3.082)* (2.05)# (2.001)#
Schooling 0.21 0.451 0.324 0.417 0.297 0.335 0.214 0.341
(2.00)# (1.996)# (2.168)# (2.701)* (1.97)# (2.234)* (2.096)# (1.991)#
Stubble 0.433 0.351 0.149
(1.99)# -1.87 -1.945
Atela 0.234 0.383 0.414
-1.183 (1.996)# (1.97)#
Veterinary 0.433 0.287 0.221
-1.01 -1.98 -1.759
Concentrates 0.169 0.377 0.229
(2.65)* (2.11)# -1.59
Roughages 0.212 0.435 0.339
(1.958)# -1.99 -1.66
N 88 43 41 23 49 35 56 35
R2 0.87 0.71 0.93 0.81 0.78 0.86 0.81 0.78
cereal produced are presented in Table 5.
The results indicate that: I) inputs such as plot size, oxen, production knowledge and schooling positively and significantly influence production of cereals under all combination of crop technologies, ii) physical inputs and knowledge exert large and significant positive impacts on production when farmers use a combination of fertilizer and pesticides, and fertilizer and cows technologies, iii) technical inputs such as plot characteristics negatively influence production, iv) several variables seem to have significant and large impacts on the amount of production when the production structure of households is examined using this type of grouping than by test and control farmers.
Conclusion
Examination of the impacts of inputs on the level of outputs of Selale and Ada farmers suggest that physical factors such as land, labour, oxen and seed rate exert positive and
significant impact on the amount of crop output obtained. Management related variables such as schooling and crop production knowledge exert positive and significant effect on production of most crops. The impact of crop production knowledge is not only larger than most variables but also indicates that it is locale-specific. That is, its influence is larger on the amount of cereal produced by Ada compared to Selale farmers. The effect of extension education on most crops is not significant. This may suggest that either the contents of or delivery mechanisms of extension education are not directed toward finding ways of increasing production of crops and livestock in the highlands of Ethiopia.
production knowledge and schooling exert consistently significant effect on milk production. However, the effect of livestock production knowledge on the amount of milk production is higher in the Selale than in the Ada region.
Physical inputs and knowledge exert large and significant positive impacts on crop production when farmers adopt combinations of fertilizer and pesticides, and on milk production when farmers adopt fertilizer and cross-bred cows followed by those farmers who have adopted fertilizer, pesticides and cows. This implies that, given locally available resources, producers make strategic selection of technologies that not only guarantee subsistence food requirement but also increase production with more certainty.
References
Chambers, R.G. 1988. Applied Production Analysis: A Dual Approach. Cambridge: Cambridge University Press.
Constable, M., 1983. Ethiopian Highland Reclamation Study:Summary, Ministry of Agriculture/FAO, Addis Ababa, Ethiopia.
Eisemon, T.O., and A. Nyamete. 1988. Schooling and Agricultural Productivity in Western Kenya. J. of East African Research and Development, 18:44-66.
FINNIDA/Ministry of Agriculture. 1989. Base Line Survey: Selale Dairy Development Pilot Project.Unpublished Report.
Getahun, A. 1978. Agricultural Systems in Ethiopia. Agricultural Systems. 3:281-293.
Getahun, A. 1980. Agro-Climates and Agricultural Systems in Ethiopia. Agricultural Systems. 5:39-50.
Jamison, D.T. and L.Lau. 1982. Farmer Education and Farmer Efficiency. Baltimore: The John Hopkins University Press.
Kebede, Y. 1993. The Micro-Economics of Household Decision Making: The Case of Adoption of Technologies in Ethiopia. Unpublished Ph.D. Dissertation, Departments of
Agricultural Economics and Anthropology, McGill University.
Peterson, W. and Y. Hayami, 1977. Technical Change in Agriculture, In L.R. Martin (ed) A Survey of Agricultural Economics Literature, Minneapolis: University of Minnesota Press, Vol. II, 1977, pp.497-540.
Waktola, A. 1980. Assessment of the diffusion and adoption of agricultural technologies in Chilalo, Ethiopia. Eth. J. Agri. Sci. 2:51-68.
Appendix 1. Estimates of Average Production Function for Test and Control Farmers
Teff Barley Beans
Selale Ada Selale Ada Selale Ada
Test Control Test Control Test Control Test Control Test Control Test Control Intercept 1.13 -0.412 -1.47 -3.017 0.857 -0.503 2.504 -0.69 1.185 0.813 0.045 1.32
(2.512)* (-1.001) (-0.923) (-1.508) (2.056)# (-1.143) -1.79 (-0.713) (2.218)# (3.127)* -0.031 (3.08)* Plot Size -0.127 -0.082 0.159 0.286 0.059 0.016 0.015 0.147 0.313 0.303 0.295 0.48 (-3.133)* (-2.4)* -1.42 (1.991)# (1.525) -0.475 -0.201 -1.674 (2.94)* (1.989)# (3.843)* (2.92)*
Oxen 0.143 0.161 0.377 0.273 0.381 0.348 0.344 0.258 0.134 0.09 0.258 0.284
-1.287 (2.111)# (2.175)# (1.983)# (3.956)* (4.23)* -1.563 (2.109)# (2.695)* (1.971)# (1.989)# (1.97)# Seed rate 0.4 0.407 0.345 0.368 0.387 0.286 0.54 0.201 0.09 0.213 0.192 0.17
(2.261)* (3.109)* (3.029)* (2.117)# (2.433)* (2.05)# (2.141)# (1.37) (1.773) 2.883)* (1.995)# (1.98)#
Labour 0.526 0.593 0.266 0.533 0.313 0.435 1.104 0.844 1.0039 0.426 0.46 0.471
(2.077)# (2.383)* (3.688)* (2.863)* (1.963)# (2.16)# (2.023)# (2.309)* (2.14)# (2.549)* (2.219)# (2.76)*
Fertilizer 0.03 0.117 0.496 0.412 0.014 0.035 0.454 0.787
-1.144 -0.448 (2.131)# (2.692)* (0.374) (0.744) (2.827)* (2.388)*
Pesticides 0.236 0.206 0.248 0.056 0.425 0.126 0.085 -0.009
(1.986)# (1.984)# (1.945)# -1.339 (2.246)* (1.98)# -0.588 (-0.035)
Plot -0.214 -0.391 -0.1 0.134 0.275 0.124 0.265 0.032 0.423 0.278 0.482 0.417 charact. (-1.98)# (-2.184)# (-1.973)# (1.986)# (1.989)# -0.74 -2.727* (0.189) -3.322* (2.412)* (1.497) (3.43)* Black soil 0.111 0.238 0.601 0.306 -0.129 -0.116 0.029 0.138 -0.059 -0.025 0.274 0.068
-1.069 (2.647)* (3.659)* (-1.568) (-1.517) (-1.405) (0.124) (0.723) (-0.88) (-0.422) -2.419# (1.004) Extension 0.196 -0.011 0.484 0.331 0.136 -0.008 0.002 0.312 0.035 -0.007 0.399 0.268 education (2.14)# (-0.343) -1.234 -1.35 -0.908 (-0.256) -0.017 -0.677 -1.158 (-0.401) -1.259 -1.91 Production 0.459 0.367 0.92 0.775 0.83 0.547 0.739 0.582 0.42 0.503 0.825 0.908 knowled (2.49)* (2.676)* (2.617)* (1.985)# (1.997)# (2.07)# (1.949)# (1.956)# (2.243)* (1.947)# (1.951)# (1.97)# Schooling 0.129 0.429 0.091 0.148 0.524 0.422 0.103 0.244 0.316 0.201 0.327 0.212
(1.99)# (2.021)# (1.957)# (1.947)# (2.017)# (2.31)* -1.279 (1.981)# (2.001)# (1.959)# (2.013)# (1.95)#
N 88 127 25 26 88 127 25 26 88 127 25 26
Wheat Peas Cereal
Selale Ada Selale Ada Selale Ada
Test Control Test Control Test Control Test Control Test Control Test Control Intercept 0.351 0.698 3.583 1.208 0.157 0.889 1.925 -0.03) -1.463 0.441 0.88 1.528 -0.472 -1.061 (3.401)* -0.709 -0.377 (3.02)* (2.195)# (-0.057) (- (2.114)# -1.534 (2.11)# Plot size 0.127 0.17 0.041 0.308 0.161 0.13 0.055 0.364 0.661 0.655 0.971 0.366 -3.487 (3.607)* -0.808 -3.522* (4.342)* (3.88)* -0.852 (2.656)* (3.407)* (2.59)* (1.982)# (2.02)# Oxen 0.031 0.279 0.368 0.938 -0.008 0.172 0.254 -0.183 0.049 0.228 0.288 0.358
-0.175 (1.958)# (2.159)# -1.594 (-0.089) (2.02)# -1.207 (-1.508) -0.321 (2.63)* (2.331)* (1.98)# Seed Rate 0.186 0.051 0.17 0.51 -0.041 -0.043 -0.258 -0.629 0.239 0.117 0.56 0.379
-1.97 -0.492 -1.098 -1.26 (-0.618) (-0.654) (-2.812)* (- (2.23)* -1.688 (2.475)* (1.96)# Labour 0.115 0.025 0.357 0.81 -0.026 -0.034 -0.341 -0.293 0.01 0.228 0.734 0.207
-0.792 -0.21 (2.17)# -1.632 (-0.286) (-0.511) (-1.985)# (-2.23)* -0.084 (2.278)* (2.142)# -0.674
Fertilizer 0.024 -0.008 0.441 0.311 0.041 0.001 0.221 0.233
-0.482 (-0.197) (2.155)# (2.13)# (2.90)* -0.072 (2.134)# (1.957)# Pesticides 0.05 0.154 0.157 0.144 0.058 0.016 0.067 -0.453 -0.49 (1.982)# -1.651 (2.21)# -1.324 (2.038)# -0.647 (-1.493) Plot Char- -0.268 -0.115 -0.118 -0.398 0.059 -0.131 -0.493 -0.041 -0.026 -0.098 0.365 0.537 acterstics (-1.501) (-0.669) (-0.483) (-1.354) -0.447 (-1.09) (-2.199)# (-0.332) (-0.237) (-1.444) -1.118 (2.02)# Black Soil 0.057 0.008 0.34 0.127 -0.011 -0.014 0.067 0.277 -0.045 (-0.05) 0.271 0.631
-0.458 -0.079 (2.461)* -0.578 (-0.131) (-0.207 -0.387 (4.05)* (-0.233) (-0.362) -0.431 (1.953)# Extension 0.147 0.072 0.371 0.053 0.161 0.141 0.112 -0.062 0.105 -0.021 0.269 0.142 Education -1.891 -1.044 -1.872 -0.539 -1.65 -1.636 -1.93 (-1.823) (2.35)* (-0.799) (2.367)* -1.17 Production 0.573 0.747 0.975 0.825 0.636 0.245 0.467 0.407 0.896 0.861 0.949 0.896 Knowledge -3.325* 0.945)# (4.711)* -0.949* (2.858)* (1.96)# (1.988)# (1.954)# (2.896)* (2.767)* (2.993)* (3.39)* Schooling 0.113 0.079 0.388 0.271 0.466 0.469 0.244 0.457 0.501 0.281 0.389 0.259 -1.322 (1.972)# (2.341)* -2.176# (2.187)# (1.97)# (1.955)# (2.004)# (2.676)* (1.947)# (2.143)# (1.95)#
N 127 89 25 26 127 88 25 26 126 87 25 26
R2 0.653 0.944 0.927 0.844 0.835 0.833 0.973 0.587 0.574 0.602 0.736 0