A Novel Adaptive Compression Technique for Dealing
with Corrupt Bands and High Levels of Band
Correlations in Hyperspectral Images Based on Binary
Hybrid GA-PSO for Big Data Compression
S. Kargozar Nahavandy
University of Tehran, Iran.
P. Ghamisi
University of Iceland, Reykjavik, Iceland
L. Kumar
Ecosystem Management, Universi-ty of New England, Australia
M. S. Couceiro
Inst. of Syst. and Robotics Ingeniarius, Lda. 3030-290 Coimbra, Portugal
ABSTRACT
Hyperspectral sensors generate useful information about cli-mate and the earth’s surface in numerous contiguous narrow spectral bands, being widely used in resource management, agriculture, environmental monitoring, among others. The compression of hyperspectral data helps in long-term storage and transmission systems. This paper introduces a new adap-tive compression method for hyperspectral data. The method is based on separating the bands with different specifications by the histogram analysis and Binary Hybrid Genetic Algo-rithm-Particle Swarm Optimization (BHGAPSO). The new proposed method improves the compression ratio of the best-known JPEG standards, saves storage space, and speeds up the transmission system. The proposed method is applied on two different test cases, and the results are evaluated and compared with a few powerful compression techniques, such as lossless JPEG and JPEG2000. The results confirm that the proposed method is accurate, simple and fast, which can be useful for big data (i.e, a high volume of data) processing.
General Terms
Algorithms.
Keywords
Remote sensing, Hyperspectral images, Image compression, Transformation, Binary Hybrid GA-PSO.
1. INTRODUCTION
Hyperspectral images have been widely used in numerous applications, such as resource management, agriculture, envi-ronmental monitoring, mineral exploration, and climate ob-servation. This type of sensors can generate more than one terabyte data in one day. Because of these enormous data volumes, the use of a robust data compression technique has become very important for archiving and transferring purpos-es [1]. Due to the importance of generating highly accurate information about the atmosphere, clouds, and surface param-eters provided by the hyperspectral sensors, lossy compression techniques are not acceptable in this case [2]. The economics of transmission and mass-storage of the large volumes of data accumulated by these sensors demonstrate that efficient com-pression is very important in this technology [3]. There are a few well-known methods for lossless compression, such as JPEG standards. These methods are generated for use on all kinds of images. In addition, there are some methods that are specifically designed for hyperspectral data. As hyperspectral
data are composed of different bands that could have different specifications, applying a single method for all the bands without considering their specifications may not be an effi-cient means of compression.
In this study, a new adaptive compression method is intro-duced for hyperspectral data, which is composed of three dif-ferent approaches. To this context, first, the corrupted bands are separated from the other bands and coded in a very effi-cient manner. Furthermore, the other bands are optimized by Binary Hybrid GA-PSO (BHGAPSO) and split into two groups based on their correlation. Then, each group is com-pressed with a new compression method. The proposed loss-less method is based on Enhanced Differential Pulse Code Modulation Transformation (EDT) and suitable Huffman encoding. With respect to the experiments, the adaptive meth-od leads to higher compression ratios than other investigated methods.
This paper is organized as follows. In Section 2, a few optimi-zation algorithms are described. In Section 3, the proposed method, its structure, and specifications are presented. Section 4 is devoted to the experimental results and Section 5 presents the concluding remarks and possible future works.
2. CURRENT OPTIMIZATION
TECH-NIQUES
2.1 Particle Swarm Optimization (PSO)
(1)
where c1 and c2 are acceleration constants and r1 and r2 are random values in the range of 0 and 1. The parameter W is regarded as the inertia weight. The parameter shows the position of each particle in the d-dimensional search space. The best previous position of each particle is represented by
and called as particle best position. is the best
posi-tion of all particles, being denoted as global best particle. The i-th particle position is updated by:
= (2)
Kennedy and Eberhart [8] applied the sigmoid transformation on the velocity component to develop binary discrete PSO to control the range of velocity between 0 and 1.
(3)
For updating the position of each particle:
(4)
2.2 Genetic Algorithm (GA)
Genetic algorithm (GA) is an evolutionary optimization method based on the genetic process of biological organisms [7]. In comparison to other techniques, GA can emphasize much stronger on global, as opposed to local search and opti-mization [8]. Furthermore, GA is able to find an optimal solu-tion without having to explore the whole (often vast) search space. GA starts optimization with several solutions. Each of these solutions is called chromosome or individual, consisting of several genes which can have different values. These genes carry the attributes of each individual, representing the fitness value of the chromosome. A set of the chromosomes consti-tute a population, in which the most fitted ones are selected for generation. For the generation phase, the two most fitted chromosomes are selected and their chromosomes are bined to make a new offspring (or solution). The act of com-bination is done by crossover, followed by a mutation mecha-nism applied on each child individually [7]. As the PSO algo-rithm, this cycle is iteratively repeated until a termination criterion is met [9].
2.3 Hybrid GA-PSO (HGAPSO)
The hybrid algorithm combines the standard velocity and updates rules of PSOs with the ideas of selection, crossover and mutation from GAs. In [22] and [23], Ghamisi et al. pro-posed the HGAPSO for supervised feature selection and seg-mentation. In this work, the concept of HGAPSO is further developed in order to handle unsupervised feature selection and, finally, data compression.
The PSO algorithm presents several drawbacks, from which one may highlight its premature convergence. The underlying principle behind this problem is that particles converge to a single point between the global and the local best positions. This point is not guaranteed to be optimal [18]. Additionally, the fast rate of information flow between particles results in similar particles with a loss in diversity, thus increasing the possibility of being trapped in local optima.
Another drawback is that stochastic approaches have problem-dependent performance. This dependency is related with the set of parameters of the algorithm. A different parameter set-tings for a stochastic search algorithm results in high perform-ance variperform-ances [5]. Moreover, each problem may have an
“optimal” set of parameters. As an example, increasing the inertia weight will increase particles’ speed, resulting in more exploration (global search) and less exploitation (local search), and vice-versa. Hence, finding the best value for a given parameter is not an easy task and may differ from one problem to another [11].
Despite these drawbacks, the PSO algorithm is conceptually simple and can be implemented in a few lines of code. As previously stated, the PSO also have memory, whereas in a GA, if an individual is not selected, the information contained by that individual is lost. However, without a selection opera-tor, PSOs may waste resources on poor individuals. A swarm interaction enhances the search for an optimal solution, whereas GAs have trouble finding an exact solution and are best at reaching a global region [12]. Hybrid GA models are often used to overcome this problem. The authors in [19], it is said that the correct combination of both models has the po-tential to achieve better results faster and to work well across a wide range of problems. Both Angeline [13] and Eberhart [12] have suggested that a hybrid combination between GA and PSO could produce a very effective search strategy The Hybrid GA-PSO is made for optimization of problems in continuous and multidimensional search spaces [13]. To per-form the feature selection, the Hybrid GA-PSO needs to be extended in order to deal with binary data.
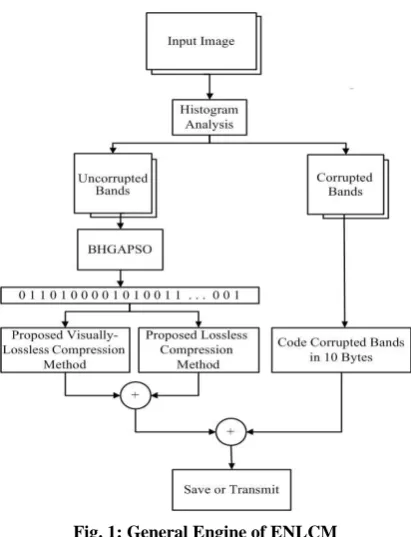
3. EXTENDED NEW LOSSLESS
COM-PRESSION METHOD (ENLCM)
Fig. 1: General Engine of ENLCM
1) Compression of Corrupted Bands: The first step of the proposed method is the histogram evaluation, where the histo-gram of each band is analysed to determine whether it is cor-rupted or not. In this method, any band that has only one value for its histogram is a corrupted band. In brief, an uncorrupted band has different intensity values, while a corrupted band has only one value, which is usually 0 or 255. In this paper, only the bands with one value are compressed by this coding scheme. When the histogram is evaluated and the corrupted bands are determined, the coding step begins. In the coding step, 10 bytes are assigned for the corrupted bands, where specific codes are assigned for the starting and finishing 2 bytes. These code words separate them from the other bands and help in the reconstruction phase. The third byte indicates the number of corrupted band, the fourth byte is used to show the intensity value of the band, and the other bytes are aligned for the unpredictable headers. Figure 2 illustrates these bytes.
Fig. 2: Contents of 10 assigned bytes for corrupted bands
2) Compression of Uncorrupted Bands: As can be seen in Figure 1, at first, a group of bands with the lowest correlations with each other is selected. In this paper, in order to find the bands with the lowest correlation, Hybrid GA-PSO was used. The basic Hybrid GA-PSO algorithm is made for optimization of problems in continuous, multidimensional search spaces [23]. To perform the feature selection and select the uncorre-lated bands among the rest, the conception of the Hybrid GA-PSO is needed to be extended in order to deal with binary data [22].
3.1 Binary Hybrid GA-PSO (BHGAPSO)
In this paper, we develop a new binary hybrid GA-PSO (BHGAPSO) method, which was first proposed in [22]. This optimization approach is effective for the optimization of hyperspectral bands by considering the data specification. As shown in [5], although the performance of this optimization
[image:3.595.316.543.98.306.2]approach is similar to the GA algorithm, it is able to achieve the same result in a lower number of iterations.
Fig 3: General engine of the BHGAPSO
Figure 3 shows the block diagram of the BHGAPSO. The total number of variables in each velocity and position com-ponent is equal to the total number of uncorrupted bands. Each position variable can be 0 or 1, which shows the pres-ence or abspres-ence of the specific band, respectively. The veloc-ity is interpreted as a probabilveloc-ity to change a bit from 0 to 1, or from 1 to 0, when updating particles’ position. These indi-viduals may be regarded as chromosomes in terms of GA, or as particles in terms of PSO. Afterwards, new individuals are created by enhancement, crossover and mutation operations. For clarity, the flow of these operations is illustrated in Figure 3 and described as follows:
Enhancement: In each generation, after the fitness values of all the individuals in the same population are calculated, the top-half best-performing ones are marked and identified as elites. Instead of reproducing the elites directly to the next generation as elite GAs do, we first enhance the elites using the Binary PSO (BPSO) algorithm. By using these enhanced elites as parents, the generated offsprings will usually achieve better performance than those bred by original elites. The elite group is regarded as a swarm and, as such, equations (1)-(4) are applied to the elites. In each iteration, the range of velocity is regulated in the range of 0 and 1 by sigmoid function and compared with the random chromosome between 0 and 1 and the position in the binary format is updated. By performing PSO on the elites, we increase the search ability of the algo-rithm. Half of the population in the next generation is occu-pied by the enhanced individuals, the remainder by crossover operation.
Mutation: In BHGAPSO, mutation occurs in conjunction with the crossover operation. Here, uniform mutation is adopted, i.e., the mutated gene is drawn randomly, uniformly from the corresponding search interval. In this paper, a constant muta-tion-probability equal to 0.1 was considered [21].
After running the BHGAPSO, a solution with the best fitness function value is selected as the best particle. The output of this step is the fittest individual in the binary format. The length of this individual is equal to the total number of bands. Each gene is illustrated with the presence of the specific band. After decoding this solution, a group of bands with fewer correlations is determined. This group is compressed with our lossless compression method. The remaining bands are coded by the following proposed compression methods.
3.2 Lossless Algorithm
In this paper, for optimization of hyperspectral bands, correla-tion coefficient was selected as an index for calculating corre-lation values ( ) of the bands. The correlation coefficient is an index which can measure how much two variables change together. The range of the correlation coefficient is between -1 to 1. If the absolute value of the correlation coeffi-cient is around 0, it shows two bands have less correlation with each other and contain more variable information. The correlation coefficient is calculated as follow:
(5)
i≠ j
(6)
where and are the i-th and j-th variables in the k-th particle. is the total times that correlation is calculated for each particle in each iteration. and are the standard deviations of the j-th and i-th variables, respectively.
The uncorrupted bands are optimized by BHGAPSO and a group of bands with the lowest correlation is found. This group of bands is compressed by the proposed lossless algo-rithm (or NLCM), which comprises the EDT and the opti-mized Huffman encoder, and works as follows:
[image:4.595.321.536.74.120.2]1) EDT: This method was introduced in [24], which is an efficient transformation due to its high capability in terms of redundancy reduction and energy compaction. In addition, it depicts an improved prediction performance when compared with the previous predictive schemes, such as DPCM. As it can be seen in Figure 4, for transforming an image by EDT, the input image intensities are manipulated first. The new intensi-ties are predicted by one of the prediction equations shown in Figure 5. After predicting the new image intensities, the pre-dicted image is retrieved through manipulation once again, in which the prediction error can be easily calculated by subtract-ing the main image from the predicted image.
Fig. 4: Block diagram of EDT [17]
Fig. 5: Neighboring Pixels and Prediction Equations [5]
This paper considers the entropy analysis to evaluate the EDT transformation. The entropy value is a measure for the possibil-ity of compression by encoding. Entropy indicates the required bit per pixel amount. In fact, the entropy shows how much an image may be compressed in bits per pixel. For example, when one says that the entropy of an 8-bit image is 6.3, it means that the required bits per pixel amount is 6.3 for that image. There-fore, such range of compression is possible for that image. Also, according to Shannon’s first theorem [10], it is possible to reach an entropy value using an encoder. The entropy value ( ) of any given image is calculated as follows:
(7)
where r is the intensity value, is the number of intensity val-ues used to present the image, and is the probability of in-tensities. For an image with a 8-bit depth, would be equal to 256 and would be in the range of 0-255. The histogram of the given image can be used to calculate the intensities’ probabili-ties [10]. A lower entropy value indicates that more compres-sion is possible. Transformation increases energy compaction and, as a result, the probability of each intensity or source symbols increases, which leads to less redundancy and less entropy.
2) Optimized Huffman Encoding: Huffman codes the image intensities based on their probability and converts them as a bit-stream. Therefore, the Huffman dictionary, which includes intensity codes, needs to be saved as an overhead. After calcu-lating the prediction error, all the values remain in the range of -2k +1 and 2k -1. For example, for a grayscale image with an 8-bit depth, this interval remains between -255 and 255. There-fore, Huffman encoding may need a dictionary that could cover this interval. However, the transformed image by EDT has only even values. To have an optimized entropy encoder, the proposed method uses only even values of the aforementioned interval for the Huffman dictionary. As a result, a smaller dic-tionary is achieved and less header is needed.
3) Reconstruction: The reconstruction phase consists of Huff-man decoding and inverse transform of our transformation method. The inverse of the transformation is obtained by calcu-lating the main values from the inverse of prediction equation. To achieve this goal and to have a complete reconstruction, the first row and the first column of the main image need to be saved and then, reconstruct each pixel from neighbours. In-verse transformation for pixel X of Figure 5 (i.e, (I,j)) is calcu-lated as follow:
(8)
where k is the equation number from Figure 5. I(i, j)modn is the reminder which was saved as the overhead. T(j, j) is the predicted image.
3.3 Visually-Lossless Algorithm
[image:4.595.55.289.647.727.2]picked, a lot of information may be lost and the predicted image does not have an acceptable quality and, as a result, the reconstructed image will not have a good quality, respectively. Therefore, it depends on the importance of the required qual-ity for picking a divisor. The transformation depends on the needed quality and the environment in which the image is compressed, which is a functionality of the new method. For hyperspectral image compression, lossless or visually-lossless transformation is preferred. Signal to noise ratio (SNR) can be used for near lossless or visually lossless compression to see if the reconstructed image is acceptable or not. SNR of at least 5 is required to be able to distinguish image features at 100% certainty [14]. However, the lossless scheme does not need this kind of evaluation, and the compression efficiency is the only relevant factor [5]. Equation (9) is used for calculating the SNR [15]. To calculate the signal to noise ratio in decibels (dB), equation (10) is considered. An SNR is calculated be-tween the original image and the reconstructed image to evaluate how similar these are.
(9)
(10)
4. EXPERIMENTAL RESULTS
In this work, two widely used hyperspectral data sets have been taken into account. The first test case was a hyperspec-tral image with 242 bands. Each band consists of 256×3128 pixels and was captured by Hyperion, i.e., one of the hyper-spectral sensors that is carried on the Earth Observer (EO-1) satellite in a 705-km sun-synchronous orbit at a 98.7-degree inclination, providing a resolution of the surface properties in hundreds of spectral bands in the range of 0.4–2.35 µm at 30×30 m spatial resolution [6]. Figure 6 shows the 44th band of the first test case.
[image:5.595.327.527.173.470.2]The second test case was captured by the Hyperspectral Digi-tal Imagery Collection Experiment (HYDICE) sensor, which collected data in 210 bands in the range 0.4–2.5 µm at an IFOV of 1–4 m, depending on the altitude of the aircraft and ground speed. In this case, the sensor collected data over the Washington DC Mall in 190 bands. This data set contains 1280 scan lines with 307 pixels in each scan line, i.e., each band is a 1280×307 image (Figure 6).
Fig. 6: A selected band for the first (top) and second (bot-tom) test cases.
Figure 7 illustrates the entropy value of these two hyperspec-tral data test cases. As can be seen, the entropy value of some bands in the first test case is equal to zero. This implies that they have only one value for all the pixels in that band, and one can consider them as the corrupted bands. It can be seen that, in the first test case, there are 62 corrupted bands, indi-cating that more than 25% of the bands are corrupted. In the second test case, it can be seen that there are just a few bands with an entropy equal to zero, as well as some others with low entropy. These are highly correlated in the neighbouring pix-els and include less amount of information when compared with the other bands. The compression ratio of these bands is
expected to be more than the others. In addition, the proposed methods include the predictive scheme and, due to the neighbouring correlation of the large amounts of bands, it can be efficient for this test case as well.
In the proposed Adaptive Method, the sum of the compressed bit-streams consists of the coded version of the corrupted bands and the compressed bit-streams obtained from the pro-posed visually-lossless and lossless compression methods.
Fig. 7: The Entropy Values of All the Bands of a) First Test Case, b) Second Test Case [24].
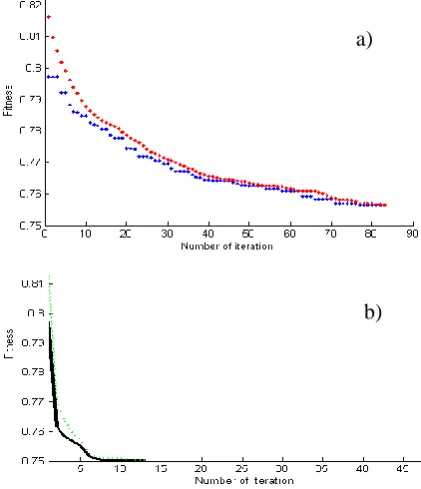
Figures 8 and 9 illustrate the variation of fitness function ob-tained by the GA and BHGAPSO methods with varying num-bers of iterations. The results show that BHGAPSO is able to find a better solution in less number of iterations than a situa-tion when the GA is taken into account.
The new method was applied on the hyperspectral data test cases, and the compression ratios are presented in Table 1. The compression ratio (CR) was calculated as:
(11)
Table 1. Compression Ratio for Compression of Both TestCases Obtained by Different Compression Algorithms
Lossless JPEG JPEG2000
Adaptive Proposed Method (ENLCM) Lossless
Method (NLCM) Test case
2.327 2.778
3.76 2.58
First
2.375 2.04
4.08 3.75
Second
[image:5.595.55.284.529.610.2]method. The population converges to some specific bands for both test cases. These bands have the highest correlation with each other and may provide more information than other bands.
Fig. 8. Variation of Cost Function for different iterations in a) GA b) BHGAPSO for the first test case
Fig. 9. Variation of Cost Function for different iterations in a) GA b) BHGAPSO for the second test case
Fig 10: Initial population (top), the population after elimi-nating the corrupted bands (middle), last population after
[image:6.595.66.277.122.367.2]optimizing hyperspectral bands (bottom) by BHGAPSO for the first test case
Fig 11: Initial population (top), last population (bottom) after optimizing hyperspectral bands by BHGAPSO for
the second test case
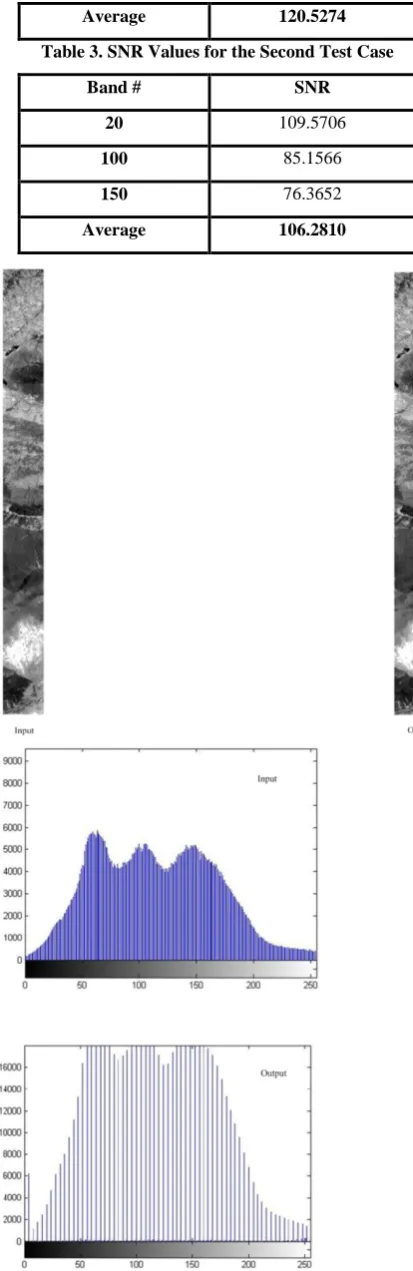
Figure 12 illustrates the input and output images after the reconstruction phase, and their histograms for band 112 for the first test case. As can be seen, the output image is visually lossless. The SNR values for some sample bands which were compressed by the visually lossless scheme of proposed method were calculated for both test cases and the results are presented in tables 2 and 3. The SNR evaluation is devoted to the visually lossless scheme where remainders are omitted to have more compression. As can be seen from Tables 2 and 3, SNR values are acceptable according to what has been dis-cussed in the previous sections.
Figures 13 and 14 show the compression ratio of different methods for all the bands. According to Figure 13, in the first test case, the proposed adaptive method (ENLCM) gives the best result in terms of compression ratio, while the lossless method (NLCM) works better than the lossless JPEG. How-ever, JPEG2000 has a better compression ratio than the NLCM because of better compression of the corrupted bands. The only advantage of NLCM is its simplicity, which is suit-able for real-time systems that need a simple and fast algo-rithm. ENLCM works efficiently and compresses each band as required. Compared to the previous methods, ENLCM demonstrates an increased compression ratio of more than 15%, while JPEG2000 shows an increase of more than 5%.
Table 2. SNR Values for the First Test Case
Band # SNR
10 92.3553
100 122.0417
150 121.9455
a)
b)
a)
b)
Nu mb er of sol uti on
Number of bands
Nu m be r of sol uti on
[image:6.595.66.278.398.700.2]Average 120.5274
Table 3. SNR Values for the Second Test Case
Band # SNR
20 109.5706
100 85.1566
150 76.3652
[image:7.595.325.542.361.473.2]Average 106.2810
Fig. 12. The input image and output image after recon-struction phase, and their histograms for the first test case
As shown in Fig. 13, the ENLCM and NLCM methods work more efficiently for the compression of uncorrupted bands.
However, in the corrupted bands, the compression ratio of the proposed adaptive method is much higher than the others. Therefore, ENLCM works better than other compression techniques. It should be noted that, for visualization purposes, compression ratio with a value superior to 5 are not included in the figure because the values of the compression ratio of the corrupted bands are very high. For instance, the corrupted band number 75 has a compression ratio of 8.25 and 1190.19 for lossless JPEG and JPEG2000, respectively. However, the proposed adaptive method is able to achieve a compression ratio of 82599. In addition, it is clear from Fig. 13 that the proposed methods are better than the JPEG2000 for most of the bands.
[image:7.595.319.545.517.662.2]ENLCM also demonstrates the best result in the second test case (Fig. 14). For the second test case, JPEG2000 shows the worst result among the three methods. It shows that a predic-tive scheme is better for this test case. Also, due to the im-provement of the proposed method with respect to Lossless JPEG, one can conclude that the predictive scheme could be a good choice for hyperspectral data compression. As expected, the compression ratios are high in the low-detail bands with lower entropy. Furthermore, the efficiency of the proposed method is visually tangible. In the second test case, about 50% improvement in the compression ratio could be observed and, in this case, the compression system is computationally sim-ple.
Fig. 13. The Compression Ratio of Different Methods for All the Bands of the First Test Case
Fig. 14. The Compression Ratio of Different Methods for All the Bands of the Second Test Case
5. CONCLUSION
hyperspectral bands, and finding a group of bands with less correlation with each other. Corrupted bands are separated based on a histogram evaluation step and compressed using a new 10-bytes coding scheme. Afterwards, in order to find a group of bands with less correlation with each other, the un-corrupted bands are optimized using the BHGAPSO. The output of this step is a chromosome which contains a group of bands with the least correlation value. This group is com-pressed with our lossless compression method. The remaining bands are coded by the proposed visually lossless compres-sion method. Finally, the outputs of these three comprescompres-sion steps are added together to create the final compressed bit-stream, which is ready for storage or transmission. Experi-mental results show that ENLCM is much more efficient than NLCM, JPEG and JPEG2000, with an overall improved com-pressed ratio. ENLCM was tested on two different cases and compared with JPEG standards. In the first test case, more than 12% improvement in terms of the compression ratio is obtained compared to the other methods, and about 50% im-provement was observed in the second test case.
6. REFERENCES
[1] M. R. Pickering and M. J. Ryan, hyperspectral data compression, G. Motta, F. Rizzo, and J. A.Storer, Eds. Springer, 2006, chapter 1.
[2] J.Mielikainen and P.Toivanen, hyperspectral data com-pression, G. Motta, F. Rizzo, and J. A.Storer, Eds. Springer, 2006, chapter 2.
[3] S. R. Tate, “Band ordering in lossless compression of multispectral images,” IEEE Transaction on Computers, vol. 46, no. 4, pp. 477–483, 1997.
[4] T. Ebrahimi, D. S. Cruz, J. Askelof, M. Larsson, and C. Christopoulos, “Jpeg 2000 still image coding versus other standards,” in SPIE Int. Symposium, San Diego California USA, 30 Jul - 4 Aug 2000, invited paper in Special Session on JPEG2000.
[5] P. Ghamisi, F. Sepehrband, J. Choupan, M. Mortazavi, “Binary Hybrid GA-PSO Based Algorithm for compres-sion of Hyperspectral Data”, The 5th
International Con-ference on Signal Processing and Communication Sys-tems (ICSPCS' 11), 12-14 December, Honolulu, Hawaii. [6] A. Skodras, C. Christopoulos, and T. Ebrahimi, “The
JPEG2000 still image compression standard," IEEE Sig-nal Processing Magazine, pp. 36-58, sept 2001.
[7] Goldberg, D. E. (1989). Genetic algorithms in search, optimization, and machine learning. Reading, Massachu-setts, USA: Addison–Wesley Longman.
[8] J. Kennedy and R.C. Eberhart, Swarm Intelligence, Mor-gan Kaufmann Publishers, San Francisco, 2001.
[9] P. Ghamisi, M. S. Couceiro, J. A. Benediktsson, A Novel Feature Selection Approach Based on FODPSO and SVM, IEEE Transaction on Geoscience and Remote Sensing, [In press].
[10]P. Ghamisi, M. S. Couceiro, N. M. F. Ferreira, L. Kumar, "Use of Darwinian Particle Swarm Optimization tech-nique for the segmentation of Remote Sensing images", IGARSS 2012, pp.4295-4298, 22-27 July 2012. [11]K. Premalatha and A.M. Natarajan, Hybrid PSO and GA
for Global Maximization, ICSRS Publication, Vol. 2, No. 4, December 2009
[12]Russell C. Eberhart and YuhuiShi.Comparison between genetic algorithms and particle swarm optimization. In et. al. V. William Porto, editor, EvolutionaryProgram-ming, volume 1447 of Lecture Notes in Computer Sci-ence, pages 611–616. Springer, 1998.
[13]Peter J. Angeline. Evolutionary optimization versus par-ticle swarm optimization: Philosophy and performance differences. In V. William Porto and et al., editors, Evo-lutionary Programming, volume 1447 of Lecture Notes in Computer Science, pages 601–610. Springer, 1998. [14]T. Bushberg, The essential of Medical Imaging, 2nd ed.
Philadelphia: Lippincott Williams & Wilkins, 2006. [15]R. Gonzales and R. Woods, Digital Image Processing,
3rd ed. New Jersey: Pearson Prentice Hall, Upper Saddle River, 2008, pp. 525-626.
[16]P. Ghamisi, A. Mohammadzadeh, M. R. Sahebi, F. Sepehrband and J. Choupan, “A Novel Real Time Algo-rithm for Remote Sensing Lossless Data Compression based on Enhanced DPCM”, International Journal of Computer Applications 27(1):47-53, August 2011. [17]F. Sepehrband, P. Ghamisi, A. Mohammadzadeh, M. R.
Sahebi, J. Choupan, “Efficient Adaptive Lossless Com-pression of Hyperspectral Data Using Enhanced DPCM”, International Journal of Computer Applications 35(4):6-11, December 2011.
[18]F. Van den Bergh. An Analysis of Particle Swarm Opti-mizers, PhD Thesis. Department of Computer Science, University of Pretoria, South Africa, 2002.
[19]P. Ghamisi, “A Novel Method for Segmentation of Re-mote Sensing Images based on Hybrid GA-PSO”, Inter-national Journal of Computer Applications 29(2):7-14, September 2011.
[20]P. Ghamisi, Micael S. Couceiro, Jon Atli Benediktsson, Nuno M. F. Ferreira “An Efficient Method for Segmenta-tion of Images Based on FracSegmenta-tional Calculus and Natural Selection”, Expert Systems with Application Publisher, 39 (2012) 12407-12417.
[21]Chun-Feng Lu and Chia-Feng Juang, Evolutionary fuzzy control of flexible AC transmission system, IEE Proc.-Gener. Transm. Distrib., Vol. 152, No. 4, July 2005. [22]P. Ghamisi, J. A. Benediktsson, Feature Selection Based
on Hybridization of Genetic Algorithm and Particle Swarm Optimization, IEEE Geoscience and Remote Sensing Letters, vol.12, no.2, pp.309-313, Feb. 2015. [23]P. Ghamisi, "A Novel Method for Segmentation of
Re-mote Sensing Images based on Hybrid GA-PSO", Inter-national Journal of Computer Applications, 29(2):7-14, September 2011. Published by Foundation of Computer Science, New York, USA.
[24]P. Ghamisi, F. Sepehrband, L. Kumar, M. S. Couceiro, Fernando M. L. Martins, A New Method for Compres-sion of Remote Sensing Images Based on Enhanced Dif-ferential Pulse Code Modulation Transformation, Science Asia, 39 (5), 449-455.
![Fig. 4: Block diagram of EDT [17]](https://thumb-us.123doks.com/thumbv2/123dok_us/8025638.767314/4.595.55.289.647.727/fig-block-diagram-of-edt.webp)
![Fig. 7: The Entropy Values of All the Bands of a) First Test Case, b) Second Test Case [24]](https://thumb-us.123doks.com/thumbv2/123dok_us/8025638.767314/5.595.327.527.173.470/entropy-values-bands-test-case-second-test-case.webp)