Feed Optimization System based on Quality Filtering
Ritika Nevatia
Sardar Patel Institute ofTechnology
Munshi Nagar, Andheri West Mumbai, India
Soham Kanade
Sardar Patel Institute ofTechnology
Munshi Nagar, Andheri West Mumbai, India
Yashaswi Alladi
Sardar Patel Institute ofTechnology
Munshi Nagar, Andheri West Mumbai, India
Chintan Panchamia
Sardar Patel Institute of TechnologyMunshi Nagar, Andheri West Mumbai, India
Kiran Gawande
Sardar Patel Institute of Technology Munshi Nagar, Andheri West
Mumbai, India
ABSTRACT
The phenomenal rate at which data is being generated on social networking websites demands for effective organization and administration methods. The current approach leads to loss of quality content amongst popular content. The paper presents an algorithm that ranks content in an ecosystem according to quality relevance to generate an organized and improved feed which evolves with the changes in data. For achieving relevance of content, the algorithm considers different parameters like user interests, article category, domain expertise of a user, quality rating of an article, and its future popularity and user activities in the ecosystem. These attributes are normalized according to the extent of their effect in determining the overall rank of an article.
Keywords
Domain expertise, Quality filtering, Personalizing, Content ranking, Web feed optimization, Algorithm, User interaction, Social media
1. INTRODUCTION
Social Networking sites have given the users the power to create and share content, thus causing an outburst of information. As a result, there is a requirement for effective feed organizing algorithms. The existing approaches provide the most popular content with the limelight as they rely heavily on the likes and shares ideology. However, popularity is not always synonymous with quality. The algorithm presented in the paper tries to achieve extraction of articles based on quality. It assumes of an ecosystem that essentially is divided into two sections, the feed and a search. The feed section is personalized with stress on quality and relevance for each user. On the other hand, the search section lists the articles solely based on their quality rating.
The algorithm computes the rank of an article based on metrics such as user interests, quality rating according to time spent on an article, an estimated future popularity of an article [1], the expertise of a user in the category of article that he creates or interacts with and the bond between different users. Each activity in the ecosystem results in a value being imparted to concerned articles and users. The articles are then organized and displayed according to their final value in the feed. The paper‟s scope is to evaluate the degree to which a certain metric affects the final results in the feed and hence a linear scale with constant scaling has been utilized for the sake of simplicity in computing values and generation of the feed results and also in accordance with results observed [2].
While certain metrics determine the quality, there is a requirement for relevance which needs to be considered for generating a user specific feed. These metrics like user interests and his association with other users in the ecosystem are modelled according to observations provided. The concept of information hubs and user network [3] has been considered for further improving the ranking of articles. A new approach for reducing isolation is employed based on the time a user spends on an article. This provides articles with less but complete views which is indicative of its quality to feature in the feed. Thereby the gap between populist and quality oriented content is reduced.
The subsequent sections explain the approach and the associated computations involved in determining different ranks and their relative effects on the feed results. The efficacy of employed methods is contrasted to determine their relative weightage.
2. RELATED WORK
The need for a quality oriented feed generation stems from the fact that existing algorithms fall short at certain levels. These algorithms however need to be considered while modelling the quality oriented approach as they help in analysing the effects of various parameters and metrics that are of significant value.
The popularity of news articles is predicted based on the activity on them during initial few hours of publishing. This algorithm helps in understanding the kind of content that become viral online.
There are different metrics that can be used to extend Edge Rank and these metrics impact the algorithm in different ways [4].
The method of identifying sources of quality information by the concept of information hubs is novel. Moreover the effect of user-follower network in making content go viral is analysed.
3. THE MODEL
The algorithm is split into four modules, each of which caters to a different type of rank determination. The final algorithm is then obtained by relatively weighing the effect of each module in extracting quality oriented and relevant content. The algorithm is split as follows:
Quality Estimation based on reading time
Reducing isolation by restricting virility and boosting quality content.
Personalizing the feed to match user interests and provide weightage to quality content from followers.
3.1 Quality estimation based on reading
time
This algorithm primarily decides the quality of the article, by taking into account, the amount of time a User dedicates to reading the article from A to B. The algorithm changes the intensity of the deduced rating, based on the size of the section read by the User.
The primary focal points of this algorithm are as follows:
The average speed, of an adult in reading text off a digital screen [5]
The standard deviation model constructed for the sake of efficient rating
Consideration for the amount of text read from the article [6]
[image:2.595.308.548.86.257.2]An adult‟s globally observed average speed for fast reading is about 300 words/minute [7]. The global average of all adults who read slower than normal is about 250 words/minute. The algorithm being discussed here, considers the average, i.e.275 words/minute, to normalize subsequent rating of the article under scrutiny.
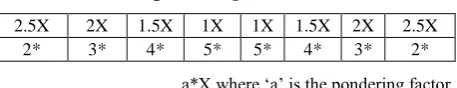
Table 1. Standard deviations customized using pondering factor
2.5X 2X 1.5X 1X 1X 1.5X 2X 2.5X
2* 3* 4* 5* 5* 4* 3* 2*
a*X where „a‟ is the pondering factor
The above shown table explains the customized standard deviation used for deciding the rating of the article under scrutiny. The 1-star rating falls beyond the highest and lowest threshold of the 2-star rating zones.
Generally, an article that is rich, quality-wise, is something that easily connects with the reader. Hence, the reader always takes a time close to the global average speed. However, articles that may be written well, but might not be edited correctly, might need a little bit of effort. This means that the user will ponder over the article trying to connect the dots. As the article‟s quality decreases, the reader takes too much time implying non understandable content or too little time if it is not of interest to the reader [8].
Considering the speed of the reader, and amount of the time spent on the article, as it becomes more dull or uninteresting, the pondering factor changes. The changing „pondering‟ factor adds two side-benefits:
Reduces the strictness of the rating system, making it more efficient
[image:2.595.54.283.401.445.2] It also helps in eliminating flawed rating, caused by hardware failure or unintended loss of connection from the internet
TABLE 2. Article rating based on reading time
User Article 1 (343 words) read time
Article 2 (1057 words) read time
1 1.3848546 2.3309122
2 1.6441220 2.9899218
3 1.3708485 2.1391242
4 1.5138350 2.0981822
5 1.8181668 2.5767282
6 1.9046668 2.4619641
7 1.7751667 2.6465013
8 1.5776668 3.5672973
9 0.7393333 1.9948471
10 2.7871668 -
11 0.8167016 -
Rating 4.727272 2.7777777
3.2 Interaction based quality refining
algorithm
The Interaction based quality refining algorithm (IBQRA) depends upon User Interaction to extract quality content. The paper [9] serves as a reference in devising this algorithm. IBQRA is 3 step algorithm that evaluates several parameters during its stages. The 3 steps involved in IBQRA are-
User Interaction (UI) Value
Domain Expertise (DE) Value
Interaction based Quality (IbQ) Value
All three steps involve calculation of these values based on the interactivity parameters and type factors.
3.2.1. UI Value
The User Interaction value is simply a numerical representation of interactivity of the user in the ecosystem. Users can be ranked on the basis of their UI value which is directly proportional to the way in which the User interacts in the ecosystem.
UI Value α User Interaction
The UI Value is determined with the help of the following 5 interactivity parameters:
Content Generated by the User(A)
Number of Shares by the User(SUT)
Number of people Following the User(F)
Number of comments by the User(C)
Number of likes by the User(L)
The primary aim behind considering all these parameters is to check up on the ways in which any user interacts within a typical social networking ecosystem. The UI value is then calculated via a formula which also normalizes the parameters in order to keep the weightages fair.
The formula for UI value based on the interactivity parameters given above can be expressed as-
Where
UIV- UI Value
λ – Time Factor (Total number of days since the user joined the ecosystem)
TS- Total number of Shares recorded on the ecosystem
TU- Total number of Users using the ecosystem
TC- Total number of Comments recorded on the ecosystem
TL- Total number of Likes recorded on the ecosystem
It is seen that all parameters stand normalized on a scale of 10 since their multipliers sum up to the same number. Also, the denominators for every parameter ensure that they contribute only as a factor of the total interactivity parameters recorded on the ecosystem.
The above formula returns a UI Value which is used in calculating the IbQ value in the algorithm.
3.2.2. DE Value
The Domain Expertise is the mathematical representation of the level of expertise the user commands in specific fields of interest. Any article uploaded is categorized in these particular fields of interest and thus helps in determining the expertise related to a specific domain. The DE value holds the following principle-
Domain Expertise α Quality of Content
Thus it assumes that an article written by an expert has to be better in terms of quality than an article by any amateur/newcomer in the same field. Hence, amateurs/newcomers will always lose out on gaining any domain expertise at the start. However, the formula for DE value is flexible enough to accommodate changes over time. It can be given by-
DEV = { (4AD/TA) + (3V/F) + (3SD/SR) }
Where
DEV- DE Value
AD- Number of Articles of that particular Domain generated by the user in question
TA- Gross total number of articles generated by the user in question
V- Number of Votes given to the user in question for the Domain Expertise of that particular domain in question
F- Total number of Followers of the user in question
SD- Total Shares recorded for all the articles under the particular domain in question
SR- Total Shares for all the articles generated by the user in question (including the ones under the particular domain)
The above formula returns a specific DE value which is helpful in determining the IbQ value in the final stage of the algorithm.
3.2.3
.
IbQ Value
As the name suggests, the Interaction based Quality value returns the total value for any particular by primarily taking into consideration its interactivity parameters along with the DE value. This is the final stage in the IBQRA. It can be given by-
IbQV = { (UIV) * (DEV) * (TFV) }
Where
IbQV- Interaction based Quality Value
UIV- UI Value
DEV- DE Value
TFV- Type Factor Value
The type factor value can be calculated as follows:
For a „like‟, TFV = (1/1000)
For „comments‟, TFV = (Total number of comments by the user in question on the article/100)
For „shares‟, TFV = (1/10)
For any article uploaded, TFV= 10
The type factor value is nothing but a way to rate the article based who is interacting with it. Thus, it helps in giving us the broader, wider perspective via the IbQ value.
[image:3.595.136.461.591.691.2]The final output that IBQRA provides is the IbQ value for any article. Thus, every article in the ecosystem will be evaluated by the IBQRA and be given a certain IbQ value. The quality of the article in the ecosystem can thus be determined based on the interaction.
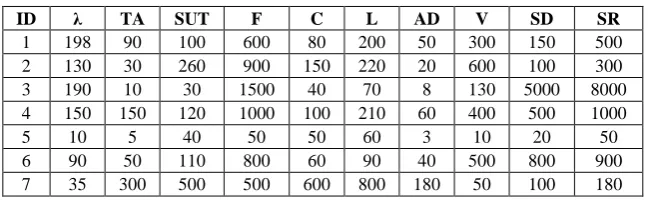
Table 3. User Parameters
ID λ TA SUT F C L AD V SD SR
1 198 90 100 600 80 200 50 300 150 500
2 130 30 260 900 150 220 20 600 100 300
3 190 10 30 1500 40 70 8 130 5000 8000
4 150 150 120 1000 100 210 60 400 500 1000
5 10 5 40 50 50 60 3 10 20 50
6 90 50 110 800 60 90 40 500 800 900
7 35 300 500 500 600 800 180 50 100 180
Table 4. Evaluated User Values
ID UIV DEV IbQV(L) IbQV( C ) IbQV(S)
1 4 5 0.02 0.2 2
2 2 6 0.012 1.08 1.2
3 1 6 0.006 0.12 0.6
4 8 5 0.04 2.4 4
5 4 5 0.02 2.2 2
6 4 8 0.032 0.96 3.2
7 61 5 0.305 308.05 30.5
3.3. Isolation Reduction
Articles on the ecosystem can be said to fall under three categories – those that receive less attention, those that receive healthy attention and those that receive viral attention. The articles receiving healthy attention are usually synonymous to quality and those that garner too much attention are populism oriented. The algorithm is based on the assumption that viral content suppresses quality content and if given an opportunity the quality content can become viral.
The approach relies on early prediction and does not consider articles that boom much later after they have been created because it reduces isolation from the beginning stage.
The following parameters of an article are considered by this module:
1) No. of comments received (C)
2) No. of shares (S)
These parameters are evaluated at times t1, t2 and t3 from publishing time. At each sampling instant, a popularity value is computed as follows:
PV = logα(S) +logβ(C)
α and β are bases decided based on the overall influence of shares and comments in predicting the extent of popularity.
A logarithmic scale is used as it brings down the range of popularity values to be considered for different categories.
Threshold values of popularity for the three categories of articles are decided as λ1, λ2. The threshold range in which the computed popularity value falls determines the action to be taken.
1) Less than λ1- The article is categorized as one that has not received much attention; it is then shown in the feed of random few domain experts (FDE) in the category of the article.
2) Between λ1 and λ2 - The article is considered as one falling into the quality category. It is then shown in the feed of many random domain experts (MDE) in category of the article.
3) Above λ2- The article is classified as viral and hence is not considered for further iterations, so is shown only in the feeds of followers (F) of the user who posted the article.
[image:4.595.52.486.417.741.2]The reason for showing the articles in feeds of domain experts is because domain experts can impart significant value to articles if they are of quality content. The potential article is then sampled at next sampling time instant. If the category in which the article falls is changed, then the same procedure is repeated, else the article is removed from sampling list.
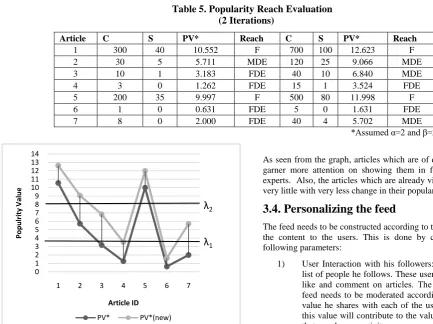
Table 5. Popularity Reach Evaluation (2 Iterations)
Article C S PV* Reach C S PV* Reach
1 300 40 10.552 F 700 100 12.623 F
2 30 5 5.711 MDE 120 25 9.066 MDE
3 10 1 3.183 FDE 40 10 6.840 MDE
4 3 0 1.262 FDE 15 1 3.524 FDE
5 200 35 9.997 F 500 80 11.998 F
6 1 0 0.631 FDE 5 0 1.631 FDE
7 8 0 2.000 FDE 40 4 5.702 MDE
*Assumed α=2 and β=3
Figure 1. Popularity boosting of quality articles
As seen from the graph, articles which are of quality content, garner more attention on showing them in feed of domain experts. Also, the articles which are already viral are boosted very little with very less change in their popularity value.
3.4. Personalizing the feed
The feed needs to be constructed according to the relevance of the content to the users. This is done by considering the following parameters:
1) User Interaction with his followers: A user has a list of people he follows. These users create, share, like and comment on articles. The user at hand‟s feed needs to be moderated according to the bond value he shares with each of the users and in turn this value will contribute to the value of the article that user has an activity on.
0 1 2 3 4 5 6 7 8 9 10 11 12 13 14
1 2 3 4 5 6 7
P
opul
ri
ty
V
al
ue
Article ID
PV* PV*(new)
λ
12) User Interaction with his Interests: Given a set of interests by the user which are adaptive according to user interaction, posts with those interests need to show up on the feed more often. The interests are initially accepted from the user while later it adapts according to the content the user is most interactive with.
3) Article parameters like creator, number of likes and number of shares need to be considered for prioritizing the content. A creator who is a domain expert is given more importance than a normal user. Articles with more shares and likes from important followers determined in point 1 are given greater weightage.
4) Timeframe of the article: Older articles however relevant and rich in content need to be pushed down with the passage of time. The timeframe of the article takes care of this. Each article is multiplied by a time factor which is inversely variant to the time passed. Thus the overall value of the article degrades if it is old.
In this example, Like is considered as 1, Share as 3 and comment as 5 points as a type factor. Consider 3 articles, 3 domains and 4 users in the system. And their relationship with each other as follows.
[image:5.595.309.547.79.443.2]Each user‟s domain expertise for three different kinds of domains is considered for instance as in Table 6.
Table 6. Domain Expertise of each user
D1 D2 D3
U1 5 5 5
U2 0 8 8
U3 6 0 0
U4 5 8 8
[image:5.595.314.542.285.350.2]Further, assumed example ecosystem has three articles on which each of these users have an activity. A sample description of these activities on three articles A1, A2 and A3 have been defined in Table 7.
Table 7. Activity on each article
A1 A2 A3
U1 Likes Likes, Comments Likes
U2 Likes, Comments Like, Shares, Comment Creates
U3 Creates - -
U4 Likes, Shares Creates Shares
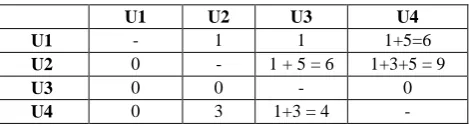
For the personalization based on followers, Table 8 calculates Interaction bond values of each user with the other.
Table 8. Interaction bond value with each user
U1 U2 U3 U4
U1 - 1 1 1+5=6
U2 0 - 1 + 5 = 6 1+3+5 = 9
U3 0 0 - 0
U4 0 3 1+3 = 4 -
* determined by the likes, shares, comments on that user‟s article from the table above
[image:5.595.46.289.355.430.2]Table 9 considers the timeframe of the article and thus calculates the article values for each of the three articles present in the ecosystem.
Table 9. Article values
L S C Timeframe Creator Domain
A1 3 1 1 1 day ago U3 D1, D2
A2 2 1 2 3 days ago U4 D2
A3 1 1 0 5 days ago U2 D2, D3
* Number of likes, shares, comments, timeframe, creator and domains
Thus an article-user relationship is created based on the above factors to personalize the feed:
(Article value = Bond Value*Activity on that article + Domain Value Points + Article Parameters – Timeframe)
Calculating for pair (U1, A1) (1*1+1*3) + (1*7) + (6*1+6*3)) + (5+5) + (3*1+1*3+1*5) - 1 = 55
[image:5.595.49.288.497.571.2]Similarly for each user the Final Values for each article is calculated as shown in Table 10.
Table 10.Final article values for each user
A1 A2 A3
U1 55 68 34
U2 96 78 42
U3 16 12 1
U4 63 47 48
Hence, order in the feed for the users:
U1 – A2, A1, A3
U2 – A1, A2, A3
U3 – A1, A2, A3
U4 – A1, A3, A2
Thus the above model personalizes the order of the three articles A1, A2, A3 for four different users.
4. CONCLUSION AND FUTURE SCOPE
This algorithm, takes into consideration, the quality of the article, the content that the user will prefer reading, the sources that the user is connected to, and content that the user themselves will produce. The application uses all these parameters, to generate a highly classified and an efficient news feed, for bringing to light, quality content, which can even be just a few milliseconds old.
This algorithm has a very expansive scope for the future. The assumed system is originally a closed ecosystem, where the users interact as a part of it. The analysis discussed initially is, currently applicable only to content present within the bounds of the ecosystem. This implementation can be expanded to the entire web, to generate truly quality-rich content, for all the users in the world.
5. ACKNOWLEDGEMENTS
[image:5.595.51.286.605.668.2]6. REFERENCES
[1] Web Usage Mining and Pattern Discovery: A Survey
Paper. By. Naresh Barsagade
lyle.smu.edu/~mhd/8331f04/barsagada.doc
[2] Khuan Yew Lee, and Jer Lang Hong, “ELITE- A novel ranking algorithm for social networking sites using
generic scoring function”
http://connection.ebscohost.com/c/articles/89050210/elite -novel-ranking-algorithm-social-networking-sites-using-generic-scoring-function
[3] A Distributed and Privacy Preserving Algorithm for Identifying Information Hubs in Social Networks by Muhammad U. Ilyas, M. Zubair Shafiq, Alex X. Liu,
Hayder Radha
http://myweb.uiowa.edu/mshafiq/files/Infocom2011-PrivacySocialNetworks.pdf
[4] Wie Xie, Ai Phuong Hoang, Feida Zhu, Ee Peng Lim “Information vs Interaction: An alternative user ranking
model for social networks”
http://link.springer.com/chapter/10.1007/978-3-319-03260-3_20
[5] In the eye of the reader, foveal and peripheral perception: from spell to the joy of reading (2006), PPGs. 117th
[6] Andrew Dillon, “Reading from paper vs screens: A critical review of the empirical literature” https://www.ischool.utexas.edu/~adillon/Journals/Readin g.htm
[7] Reading and subcortical auditory function Banai K, Hornickel J, Skoe E, Nicol T, Zecker S, Kraus N http://www.ncbi.nlm.nih.gov/pmc/articles/PMC2758683
[8] Assessing the Impact of Topic Interest on Comprehension Processes Joseph P. Magliano, Amanda M. Durik, and Janet K. Holt