Visualising Web Visitations: A Probabilistic Approach
Geoff Ellis
Huddersfield University
Alan Dix
Lancaster University
[email protected]
[email protected]
http://www.hcibook.com/alan/papers/iv04-web/
Abstract
This paper presents a technique, the Quantum Web Field, designed to give an ambient visualisation of the current activity on a web site. It uses the paths of past visitors to the site and a self-organising map to build a diffuse 'probabilistic' mapping of pages to cells in a 2D matrix, where highly traversed page-links tend to be closer to each other. The paths of current visitors appear as intelligible trails giving a sense of purposeful human activity rather than offering detailed analysis. The visualisation is not constrained by either the complexity or the number of pages in the site.
1. Introduction
Visualising aspects of the web is a major strand of research in both web and visualisation communities and it is also a practical concern for those designing and maintaining sites. Whereas the general focus of web visualisation is concerned with direct examination and analysis of a web site or the links between sites, our interest lies in visualisations that give one a sense of the activity of people visiting the site – humanity active in the electronic environment. We wish to emulate to some degree that hubbub of voices heard outside the window, or the 'at a glance' sense of activity of the shopping mall.
In this paper, we present a visualisation technique, the Quantum Web Field, which utilises the paths of visitors to the web site to create a two dimensional representation of past activity on the web site. It uses a self-organising map to build a diffuse 'probabilistic' mapping of pages to cells in a matrix – pages which are more likely to be followed tend to be closer to each other.
Superimposed on this virtual landscape are the paths of current web visitors like footsteps on a checkerboard. Just as footsteps leave their mark in the real world, our visualisation is designed to leave the trail of a web visitor through the site.
We are focusing on a system for providing background awareness of web activity rather than offering detailed analysis. Background or peripheral awareness has been shown to be vital for supporting people involved in
several tasks at the same time as it exploits our ability to process information at the periphery of our attention, with very low overhead [13]. As such, the visualisation could be installed as a screen saver, displayed in a small window on the desktop, or projected in a public space.
In the next section, we will review work in related areas of web visualisation and awareness. In section 3, we will illustrate the use of Quantum Web Fields and users session paths. In section 4, we will describe the algorithm used to implement the visualisation, focusing on the more novel aspects. Finally, in section 5, we will highlight some of the issues faced in developing the visualisation and identify further work in this area.
2. Web visualisation
There are numerous visualisation tools for studying the structure and usage of the web sites. Static features of the web itself for example, link structure, word co-occurrence are utilised [5, 10, 19] in addition to dynamic access data such as, how often pages are visited, how often links are traversed and how often paths are taken through a site [4, 7]. These visualisations help to uncover possible navigation problems experienced by users, categorise users in e-commerce applications, predict site usage and provide users with intelligible site map, so they can see where others have been (e.g. personal browsing history) or even meet others in a virtual environment.
Many visualisation techniques rely on the data being structured in a hierarchical fashion. However, most web sites tend to be in non-linear forms, often adhoc [21]. In addition, the sheer size of many web sites and the multitude of links exacerbate the problem. Approaches such as cyclic graphs, cone trees and 2D and 3D hyperbolic arrangement cannot effectively represent this type and volume of data [21]. Many 3D visualisations are rendered incomprehensible [2] although clustering has been used effectively in Narcissus [11] to deal with the occlusion problems generated by numerous nodes and edges.
method [14] to extract paths that are likely to re-occur while reducing noise in the original usage data. Pitkow [15] also advocates the use of sampling to reduce the amount of data to be processed.
The need for awareness as a means of promoting successful collaboration is widely recognised in CSCW (Computer Supported Cooperative Work) and it has been implemented in various web collaborative systems [3, 6, 8]. In Awareness Maps [9], up-to-date awareness information about members of the shared workspaces is provided as an array of pictures of active users fading over time.
Furthermore, ambient displays have been effectively used to present information in the environment or in the periphery of the user's attention, thus reducing the problem of information overload often generated by the delivery of awareness information at each user's desktop. For example, the TOWER environment [16] creates a 'theatre of work' as a multi user 3D environment on ambient displays. Avatars of users working in the same context appear spatially close [17] and although they may be physically remote they can interact directly with each other by touching on the avatars on the display.
Whilst the above systems focus on making group members aware of each other’s activities at a particular instance, we are more interested in the paths that strangers take. The Footprints system [20] is also inspired by three real-world forms of navigation: maps, trails and signposts. It captures paths that users have taken from web server logs and displays the information as self-organising graphs.
Like Footprints and other systems [4, 19], we are also using collaborative or social filtering which makes use of the paths of a large number of past visitors. However, we use this information to generate a probability matrix based on the co-occurrence of highly used page links to display the trails of current visitors to a particular web site, rather than displaying the actual pages and links individually.
3. Visualising visitations
We will now describe the Quantum Web Field for web visitation awareness to show the ‘footsteps’ of visitors as they navigate from page to page. An important design criteria was that the footsteps appear ‘intelligible’; not that one can necessarily say “ah yes someone is visiting page X”, but more that the paths appear ‘human’. As an arbitrary mapping of pages into 2D space would lead to apparently random movements across the space, the visualisation adjusts its algorithm to produce intelligible paths. This does not mean that there are no ‘jumps’ – sometimes users will take unusual paths through the site. However, we would like common paths to give rise to more gradual movements, just like physical footsteps.
The Quantum Web Field shows a checkerboard of coloured squares. In the world of large-scale phenomena each object has a unique location in space. However, in the quantum world each particle can exist in different
places, with a given probability of being at any particular location. Likewise, in the Quantum Web Field, each page is given a probability of being found at each square. These probabilities are arranged so that pages that tend to appear next to one another in session paths have high probabilities on adjacent squares.
Web fields
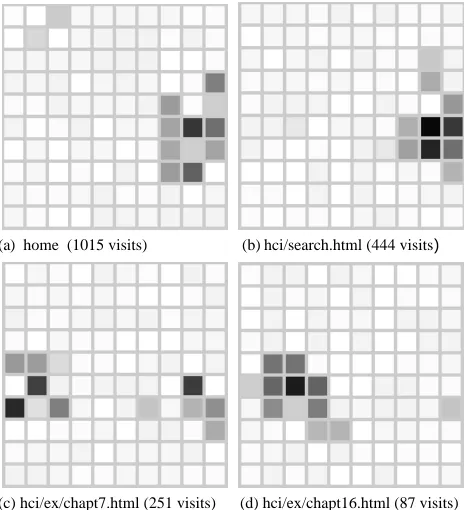
Figure 1 represents the web fields for 4 pages from the Hcibook web site [www.hcibook.com/e3]. The darker squares are those where the page has a higher probability of being placed. The algorithm has a ‘crowding factor’ which makes pages spread out over the network of squares, but it does not force each page to occupy a single square. In fact, by adjusting parameters during the procedure that generates the web field, it would be possible to make the algorithm ‘cool’ into a state where there was a single page per square. However, by allowing each page to have a more diffuse mapping to the web field the Quantum Web Field can visualise sites where there are many links from a page and also cater for large sites without changing the number of squares. In addition, the many–to–many relationship between squares and pages allows some freedom when plotting footsteps through the site, thus giving more human-like paths.
(a) home (1015 visits) (b) hci/search.html (444 visits)
[image:2.595.312.544.364.619.2]
(c) hci/ex/chapt7.html (251 visits) (d) hci/ex/chapt16.html (87 visits)
Figure 1. Web fields for sample pages
the search facility is not generally available across the site. Finally, note that (c) has a bimodal nature showing that visitors often link to/from the chapter 7 exercises from the search or home pages as well as some of the other exercise pages, such as (d).
Session paths
In the quantum world, particles only get a single location when they are observed. Similarly, when a session visits a page, a single square is coloured as the ‘wave function’ collapses. The location for the page is chosen in a random, yet proportionate manner, based on the probabilities in the page’s web field. The location of subsequent pages in the session also depends on their web field, biased by the distance from the last visited page.
The overall effect is that a session path visits a series of squares that tend to be close to one another, but have the occasional jump across the web field. Identical paths do not necessarily hit the same squares, although they will tend to follow similar paths across the web field. This leads to a visualisation that has enigmatic quality, giving a sense of purposeful activity and human-like variety, but defying a simple explanation.
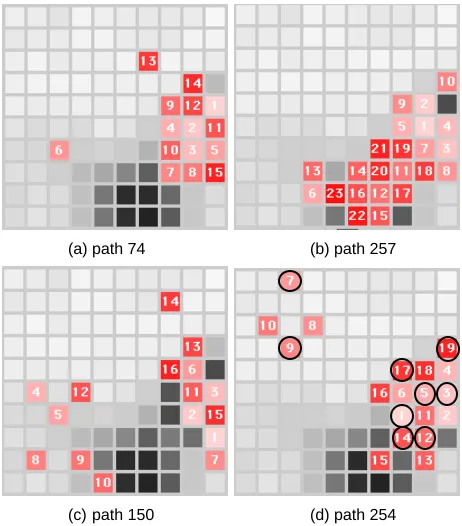
[image:3.595.313.544.207.470.2]Figure 3 shows four paths across the web field. These have been taken from a set of 320 possible paths of suitable length. To ease interpretation, the squares are numbered in the order they are visited and the trail also fades with time, with the most recent pages visited appearing darker.
Figure 2. Overall field density
To put the paths into context, the overall probability field density (Figure 2) is shown in the background of all the grids in Figure 3. The overall field density is not uniform for two reasons. First, although the crowding factor built into the algorithm adds a ‘pressure’ towards uniformity, the natural clustering of parts of the site counteracts this. Second, some pages are visited less often than others and so some parts of the map correspond to less frequently visited pages. Consequently, some parts of the space get highlighted more than others, rather like seeing car lights in a town. The lights are more likely to be in the populous areas.
On examining the paths (Figure 3) in more detail, (a) shows a fairly compact trail, pages which are commonly browsed. In fact, the log data confirms that the visitor has
started at the table of contents page (square 1) and browsed well-used pages such as the early chapters of the book, overviews and resources. Path (b) shows a longer session where 23 pages have been visited. As with the previous example, the web site user has confined their browsing activity to more commonly visited pages. Note that the path layout algorithm cannot choose an occupied position in the web field, therefore the path will spread out even if activity is in one area of the web field. A possible solution being considered is curtailing the length of a trail so that earlier pages visited will fade completely and hence could be 'stepped upon' again.
(a) path 74 (b) path 257
(c) path 150 (d) path 254
Figure 3. Paths through the web field
Furthermore, some of session paths in this particular web log exhibit pogo-like activity, with the visitor hopping, rather than strolling around the site - path (c). On examining the data, this path is a sequential pass through most of the chapter pages. The visitor may be an actual person, but a sequential pass is characteristic of a web crawler. Although the web logs are already filtered to remove ‘honest’ crawlers, the visualisation may have revealed a web crawler that masquerades as a normal browser. Note that if this was a common web browsing pattern, the visualisation algorithm would have taken this into account and clustered the pages together.
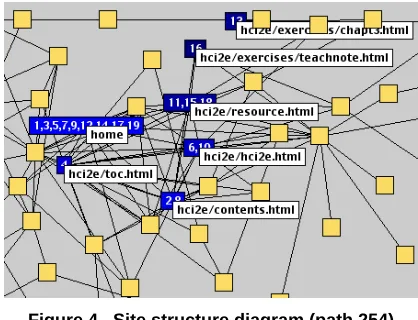
[image:3.595.107.225.413.542.2]home page is distributed across the site and not just encapsulated in a single square.
Figure 4. Site structure diagram (path 254)
The Quantum Web Field algorithm is not constrained by the site structure or the number of pages. Figure 5 illustrates 2 long paths though web fields. The grid on the left shows a visitor browsing well-used links between popular pages and then branching out into a less used part of the site. The grid on the right instead, shows a visitor alternating between two parts of the site, each of which has commonly visited pages.
[image:4.595.317.542.218.386.2]
Figure 5. Higher resolution paths
4. Mechanisms
Figure 6 shows the Quantum Web Field algorithmic architecture.
(a) web logs are pre-processed to extract sessions and create co-visitation statistics
(b) the comes-next matrix is used to produce a 2D visualisation space
(c) live web visits are sampled
(d) the sampled sessions are drawn into the 2D visualisation space
Steps (a) and (b) are part of a pre-processing stage and steps (c) and (d) are carried out in real time to give the actual visualisation.
Web log processing
Standard web logs are analysed to extract the paths that visitors take through the site. The web log itself is a
simple record of all requests including HTML pages, graphics, PDF documents, etc. Successive requests may come from different sources, but in the standard extended web log format, the IP address of the requesting client is given. This can be used to create paths as a sequence of requests coming from a single client IP address. Problems associated with obtaining reliable usage data are well documented [15, 21]. These include:
(i) pages may be cached so revisits to the same page may be missed
(ii) several visitors may be coming through the same proxy and be treated as one
Figure 6. Stages of visitation visualisation
We intend to install the system on a site that is generated entirely by PHP scripts and so can be specially instrumented to give more exact sessions. However, it is important to have the ability to deal with standard web logs to make the system more easily deployed.
After session extraction several further filtering is performed to:
• remove image files, document downloads etc. • match up aliases to the same page (e.g. /fred/ and
/fred/index.html)
• remove web crawler paths
• remove sessions visiting just one page • give each page a unique id
Example data:
Original web log (IP address has been changed
from the original)
192.184.30.18 - - [06/Nov/2003:12:20:24 -0600] "GET /hci/resources/ HTTP/1.0" 200 7869 "http://www.hcibook.com/hci/" "Mozilla/4.0 (compatible; MSIE 6.0; Windows NT 5.1; .NET CLR 1.0.3705; .NET CLR 1.1.4322)"
192.184.30.18 - - [06/Nov/2003:12:20:30 -0600] "GET /hci/chapters/intro/ HTTP/1.0" 200 7839 "http://www.hcibook.com/hci/resources/" "Mozilla/4.0 (compatible; MSIE 6.0; Windows NT 5.1; .NET CLR 1.0.3705; .NET CLR 1.1.4322)"
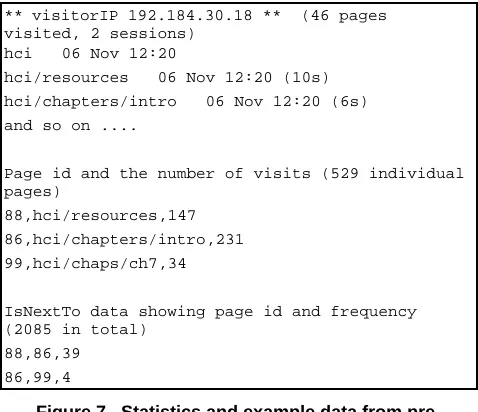
[image:4.595.50.282.360.476.2]** visitorIP 192.184.30.18 ** (46 pages visited, 2 sessions)
hci 06 Nov 12:20
hci/resources 06 Nov 12:20 (10s)
hci/chapters/intro 06 Nov 12:20 (6s)
and so on ....
Page id and the number of visits (529 individual pages)
88,hci/resources,147
86,hci/chapters/intro,231
99,hci/chaps/ch7,34
IsNextTo data showing page id and frequency (2085 in total)
88,86,39
[image:5.595.46.285.71.277.2]86,99,4
Figure 7. Statistics and example data from pre-processing the web log
The resulting sessions are then used to create the following matrices:
comesNext(from,to) {number of times page 'to' follows page 'from' in the sessions}
isNextTo(p,q) = comesNext(p,q) + comesNext(q,p) {number of times page p is next to page q}
The isNextTo matrix fulfils a role rather like the similarity matrix used in many visualisations, clustering algorithms or statistical techniques such as multi-dimensional scaling. However, similarity matrices usually have a dominant diagonal, that is:
∀ i, j: mi,j≤ mi,i
If the matrix we were using was "number of common sessions" then this would satisfy the above property, however the isNextTo matrix has a zero diagonal as a page self-links have been removed during pre-processing.
Original web log: 64110 visits Pre-processed log: 11992 visits
Number of individual visitor IP addresses: 1266 (ignoring 1 access-only addresses)
Creating the visualisation space
The Quantum Web Field is inspired by Kohonen self-organising maps [12], although due to the different nature of the web data, our algorithm is radically different.
Each of the WxH cells of the web field has an associated vector, vx,y with one entry per page. The entries can be interpreted as densities or un-normalised probabilities of finding the relevant page at that square. Initially these are set to random positive values. The pages are then presented one by one in proportion to their relative occurrence and placed in the web field.
To choose where to place page p, the following values are calculated for each field location x,y.
Let v = the vector at location x,y (that is vx,y)
closeness(x,y) =
∑
q ∈ pages isNextTo(p,q) x v(q)this says how much page p would like to be next to location x,y
wantsToBeAt(x,y) =
(
∑
x',y' ∈ neighbours of x,ycloseness(x',y')
)
×
crowdingFactor(x,y)The wantsToBeAt value is treated as a probability distribution and the page is placed using this. That is the probability of choosing location x,y is proportionate to wantsToBeAt(x,y). By 'placed at' we mean that a small value δ is added to the p-th value in the field vector at x,y.
Notice that the wantsToBeAt value is a combination of a measure of how strongly page p would like to lie next to the pages neighbouring this location, but multiplied by a ‘crowding factor’. The latter is designed to ensure that pages tend to spread themselves all over the map, rather than many pages occupying the same square. Currently this factor is:
crowdingFactor(x,y) = ((δ + v(p))/(δ + ∑q ∈ pages – {p} v(q))) α
The parameter α is tuned to give a good distribution.
visualising paths
The placement in the Quantum Web Field is more complex than say following paths in a site structured map. The web field does not uniquely map a page to a square, but instead gives each page a probability or propensity to be in a particular location. Each session is allocated a colour. The first page of a session is placed randomly on the web field where the probability of placing it at location x,y is proportionate to the vx,y (p) (recall vx,y is the map vector at location x,y).
Subsequent pages in the same session are placed at a location that tend to be next to one another by biasing the natural probability above by the distance from the last page location. So if the last page in the session is placed at x’,y’ and the current page is p, the probability of drawing it at location x,y is proportionate to:
vx,y (p) / dist( (x’,y’), (x,y) )β
Adjusting β makes the pages more or less likely to be placed next to one another, where a large value corresponds to a high likelihood of adjacent placements. Recall also that the web field itself is organising itself so that pages that often lie next to one another in paths are placed near one another.
5. Conclusion and future work
presence on a web site. The objective is background awareness rather than precise knowledge.
The Quantum Web Field involved extensive algorithm design as a simple use of a self-organising Kohonen net would have ended up with close pages clustered in a single cell – visitors would pogo rather than walk! Our initial algorithm design had to be refined to make layouts that had desirable properties. In particular, we had not realised that we would need to ‘force’ pages to spread themselves over the web field.
The Quantum Web Field is rather enigmatic, a form of ‘informative art’ rather like the Mondrian-like bus time display [18]. The layout is designed more to give a ’feel’ of intelligible human presence than to be actually comprehensible, although from our initial work it does seem that certain types of web browsing activity manifest themselves as recognisable paths. For instance, the visitor having general look at the site (well-used pages) which contrasts with the 'pogo' path, which may well be a non-human presence in the site.
We intend to install these visualisations on the www.hcibook.com web site shortly so they can become part of the experience of ordinary visitors. The visualisation will be updated on a regular basis to reflect the visitors activities and hence is expected to gradually change over time, in a similar way to the Stock market planetarium [1], but without the 'artificial life' creatures! Whilst the initial designs are aimed at showing all or a selection of visitors on one display, we are considering using the Quantum Web Field as a visualisation of the users own path through the site. Future work will also investigate different ways of visualising the actual paths, perhaps using footprints, multiple paths and even the depiction of the web field as a landscape.
References
[1] Autogena, L. and Portway, J. (2001). Stock Market Planetarium. Art installation currently in Copenhagen, Denmark http://www.blackshoals.net/ (accessed 20/3/04).
[2] Benford, S., Taylor, I., Brailsford D., Koleva, B., Craven, M., Fraser, M., Reynard, G. and Greenhalgh, C. (1999). Three
Dimensional Visualization of the World Wide Web. ACM
Computing Surveys 31(4), December 1999
[3] Budzik, J., Bradshaw, S., Fu, X. and Hammond, K.J. (2002). Supporting on-line resource discovery in the context of ongoing tasks with proactive software assistants, Intl Journal on
Human-Computer Studies (IJHCS), Jan 2002, Elsevier Press,
56(1), pp. 47-74
[4] Chalmers, M., Rodden, K. and Brodbeck, D. (1998). The Order of Things: Activity-Centred Information Access. Proc. 7th
Intl. Conf. on the World Wide Web, Brisbane, April 1998, pp.
359-367.
[5] Chi, E., Pirolli, P., Pitkow, J. (2000). The Scent of a Site: A System for Analyzing and Predicting Information Scent, Usage, and Usability of a Web Site, Proc. of ACM CHI 2000
Conference on Human Factors in Computing Systems, ACM
Press, pp. 161-168.
[6] Cohen, D., Jacovi, M., Maarek, Y.S. and Saroka, V. (2002). Livemaps for collection awareness, Intl Journal on
Human-Computer Studies (IJHCS), Jan 2002, Elsevier Press,
56(1), pp. 7-23
[7] Cugini, J. and Scholtz, J. (1999). VISVIP: 3D Visualization of Paths through Web Sites. Intl Workshop on Web-Based
Information Visualization, WebVis'99. Florence, Italy, IEEE.
[8] Gellersen, H.W and Schmidt, A. (2002). Look Who's Visiting: Supporting Awareness for Visitors in the Web. Intl
Journal on Human-Computer Studies (IJHCS), Jan 2002,
Elsevier Press, 56(1), pp. 25-46.
[9] Gross, T., Wirsam, W. and Graether, W. (2003). AwarenessMaps: Visualising Awareness in Shared Workspaces.
Extended Abstracts of the Conference on Human Factors in Computing Systems - CHI 2003 (Apr. 5-10, Fort Lauderdale,
Florida). ACM Press, pp. 784-785
[10] Heer, J. and Chi, E.H. (2002). Separating the Swarm: Categorization Methods for User Sessions on the Web. Proc.
conference on Human Factors in Computing Systems, CHI 2002,
Minneapolis, USA. ACM Press. pp. 243-250
[11] Hendley, R.J., Drew, N.S., Wood, A. and Beale, R. (1995). Narcissus: Visualizing Information. Proc. of 1995 Information
Visualization Symposium, Atlanta, GA, pp. 90-96
[12] Kohonen, T. (2001). Self-Organizing Maps. Springer
Series in Information Sciences, Vol. 30, Springer, Berlin,
Heidelberg, New York, 1995, 1997, 2001. 3rd Extended Edition [13] Liechti, O. and Sumi, Y. (2002). Awareness and the WWW. Intl Journal on Human-Computer Studies (IJHCS), Jan 2002, Elsevier Press, 56(1), pp. 1-5
[14] Pitkow, J. E. and Pirolli, P. (1999). Mining Longest Repeated Subsequences to Predict World Wide Web Surfing.
Second USENIX Symposium on Internet Technologies and Systems, UITS, Boulder CO.
[15] Pitkow, J. (1997). In search of reliable usage data on the WWW. Proc. of Sixth International World Wide Web
Conference, Santa Clara, California, April 7-11.
[16] Prinz, W. (2001) Awareness of Cooperative Activities in Mixed Realities. Proc. of the Conference on artistic, cultural
and scientific aspects of experimental media spaces (September
21-22, 2001, Schloss Birlinghoven. Sankt Augustin), pp. 231-234
[17] Prinz, W. and Gross, T. (2001). Ubiquitous Awareness of Cooperative Activities in a Theatre of Work. Proc. of
Fachtagung Arbeitsplatzcomputer: Pervasive Ubiquitous Computing (Oct. 10-12, Munich, Germany) Bode, A. and Karl
W., eds VDE Publisher, Berlin, Germany, pp. 135-144
[18] Skog, T., Ljungblad, S. and Holmquist, L.E. (2003) Between aesthetics and utility: designing ambient information visualizations, Proc. InfoVis 2003, IEEE Symposium on
Information Vizualisation (Oct. 20-21, Seattle, Washington)
[19] Wasfi, A. (1999). Collecting User Access Patterns for Building User Profiles and Collaborative Filtering. Proc. of the
4th international conference on Intelligent user interfaces. LA,
California, ACM Press, pp. 57 - 64
[20] Wexelblat, A. and Maes, P. (1997). Footprints: History-rich web browsing. Proc. Conf. Computer-Assisted Information
Retrieval (RIAO), pp.75–84