Developing a "Self-directed Learning Preparation Skills
Scale for Primary School Students": Validity and
Reliability Analyses
Gülten Feryal Gündüz
1,*, Kıymet Selvi
21700. yil Osmangazi Secondary School, Turkey 2Faculty of Education, Anadolu University, Turkey
Copyright©2016 by authors, all rights reserved. Authors agree that this article remains permanently open access under the terms of the Creative Commons Attribution License 4.0 International License
Abstract
The purpose of this study is to develop “Self-Directed Learning Preparation Skills Scale” for primary school students. Data were gathered according to the principles of descriptive research method. In order to develop this scale, draft items were developed through review of literature, interviews done with teachers, parents and students and presented to the experts for evaluation. After the alterations made according to experts’ suggestions, a pilot study with 16 primary students was carried out to revise the items. After the revision, the scale was administered to a sample of 450 3rd and 4th year primary school students. In order to determine the validity of the scale, exploratory and confirmatory factor analyses were performed. The results of the analyses revealed that this 38-item “Self-Directed Learning Preparatory” Scale contained four factors, and these factors explained % 45.65 of total variance. The four factors were named respectively as “Continuity in Learning Skills” (α=.87), “Planning in Learning Skills” (α=.85), “Awareness Towards Learning Skills” (α=.80) and “Management of Learning Environment and Learning Resources Skills” (α=.80). The overall internal reliability coefficient (Cronbach Alpha) of the scale was found as .94.Keywords
Self-directed Learning Preparation Skills, Primary School Students, Scale Development1. Introduction
Due to the rapid developments in science and technology in today’s information age, information continually accumulates and already existing information lose its up-to-dateness and changes quickly. In addition, the advancements and changes in information technologies have enabled individuals to access information through more flexible learning environments and new learning
opportunities. When these new learning opportunities are applied effectively, students can manage their learning according to their own learning preferences, specialize based on their interests and abilities and acquire more knowledge about social, cultural, vocational and actual issues. Increasing in parallel with the developments in information age, these new learning opportunities imply that learning cannot be confined to educational institutions. It can even be claimed that educational institutions will soon have fewer roles in this context and out-of-school learning will be more effective on learners’ lives than school learning in formal education.
The fact that learning is no more limited to educational institutions brought a new dimension to the issue: the skills that individuals should have. It is necessary for students to be individuals who are able to access knowledge, to question the knowledge obtained, to adapt this knowledge to their beliefs and life styles, and finally to expand and to transfer their knowledge when need arises. In other words, they should be equipped with “self-development” and “lifelong learning” skills. The Commission for a Nation of Lifelong Learners (1997) defined lifelong learning as “a continuously supportive process which stimulates and empowers individuals to acquire all the knowledge, values, skills and understanding they will need throughout their lives and to apply them with confidence, creativity, and enjoyment in all roles, circumstances, and environments [1]. According to Soran, Akkoyunlu & Kavak [2], lifelong learning turns educational activities and learning into a dynamic process that provides individuals with opportunities to learn everywhere and every time rather than in a fixed time and place. The most important skill necessary for individuals to be a part of lifelong learning process (life-long learners) is “self-directed learning” [3], Weimer, 2010 cited in [4].
in 1900s (Maeroff, 2003 cited in [6]). The first detailed studies in the field were carried out by Knowles (cited in [5]) and Tough (cited in [7]. Knowles [8] defined SDL on the basis of the behaviors that are supposed to take place during the process. In his definition, SDL is a process that includes:
• decision making with or without the help of others
• determination of the learning needs
• clear and accurate expression of learning outcomes
• choice and application of appropriate learning strategies and evaluation of learning outcomes [9]. According to Long (1987), who conducted and supervised a considerable number of major studies in the field, SDL refers to mental processes used to determine learning objectives and behavioral activities involving the search and definition of knowledge required to achieve these objectives [cited in 9]. Similarly, Bolhuis and Voeten (2001) suggest that SDL is about the following issues: students’ attempts to organize their learning processes in a simultaneous and complementary way; focusing on structuring the knowledge obtained about the topic as well as the affective dimensions of learning; and perception of the outcomes as a social phenomenon [cited in 10]. According to Annuar and Shaari [11], self-directed learning is a process during which individuals evaluate their learning needs, formulate goals, choose and implement proper strategies and analyze learning outcomes. It also helps students to improve themselves and society. Fisher, King, and Tague [12] also define SDL as students’ taking initiatives and responsibilities for their own learning processes. English and Kitsantas [13] also emphasized the role of students’ responsibility in learning in SDL and defined self-directed learning as students’ taking part in a learning process that they themselves specify rather than the ones defined by instructors. Tyler, Trumpower, Atas and Purse [14] stated that SDL is often characterized with a significant level of individual choice and control and the learner is considered an autonomous decision-maker in learning activities. Self-direction is a complex concept with a variety of aspects and associated constructs. In practice, self-direction involves shifting the responsibility for the learning activity from an external source such as teacher to the individual learner. The learner here assumes some level of control and active engagement in the learning process [15]. Finally, in accordance with these definitions, Küçüker [16] defines SDL as learning preferences that require students to take responsibility for their own learning in different learning environments, to manage their own learning processes, to be equipped with affective and cognitive skills needed for realizing this learning process and to maintain continuity in learning.
When the definitions suggested above are examined, it can be seen that a group of experts define SDL as personality traits affecting learning while others suggest that it is a learning process where learners consciously try to achieve their own learning goals. Some of them define it as a product, goal or outcome in terms of a learner’s orientation. There are also some experts who deal with SDL in terms of combination of the definitions mentioned above [17, 18, 19].
However, it can be said that such experts define the characteristics that learners should have mostly within the framework of affective traits. Guglielmino [20] and Oddi [21] state that these characteristics include attitudes, values and abilities, and they considerably influence learners’ learning purposes, activities, sources and priorities. One of the basic elements of Brockett’s self-directed learning model called The Person Process Context (PPC) Model is individuals, and it includes certain characteristics of individuals such as creativity, critical reflection, enthusiasm, life experience, life satisfaction, motivation, previous education, resilience, and self-concept [22]. Confessore (1992) [23] suggests that SDL is observed in individuals who are willing to learn about a particular topic, and an autonomous learner has four distinct characteristics; namely willingness, risk taking, skill and continuity. Similarly, Carr [24], Meyer [25] and Derrick [7] emphasize that learners’ goals are significant since they trigger self-directed learning. They also specifically focus on effective factors leading to the realization of SDL.
Major affective skills affecting individuals’ self-directed learning include the following: valuing learning; being goal-oriented; being curious; having will and basic freedoms; taking responsibility for learning; risk taking; having self-confidence; and insisting on learning [21, 26, 23, 24, 7, 25, 12, 27, 28, 29, 30, 31, de Bruin, 2007 cited in 32]. In addition to affective traits, learners should also have certain cognitive abilities which include planning skills, determining needs for learning, doing task analysis, managing learning environment and duration, deciding on learning resources and management processes (Zimmerman, 1898 cited in [33], Loyens et al, 2008 cited in [34], Guglilelmino and Guglielmino, 2003 cited in [18]). Planning skills and affective traits required to realize SDL can be considered as preparatory skills to achieve this type of learning.
Self-directed learning preparation skills can be considered as the activities and plans carried out by learners to realize this type of learning. These skills can be classified into two groups; namely affective and cognitive preparation skills for self-directed learning. SDL affective preparation skills, which include learners’ attitudes towards learning and their behaviors reflecting their personality characteristics, refer to the behaviors of learners while managing and evaluating their own learning. Specifically, these affective skills are “taking responsibility for learning”, “being willing and open to learning” and “valuing learning”. SDL cognitive preparation skills refer to learners’ planning and preparations for self-directed learning prior to the implementation and evaluation of learning process. These skills include “determining learning needs and objectives”, “managing learning resources” and “communicating with others”.
schools face the most challenging task of compared to teaching instructor at higher education level [36]. The effective realization of SDL with the help of such SDL skills also requires an accurate measurement of to what extent these skills are acquired by learners. There are scale development or adaptation studies in the related literature focusing on how to determine SDL skills learners have and to what extent they use them. Literature review reveals that some of these scales specifically focus on planning learning skills and affective traits. Among those scales, the most commonly used one is “Self-directed Readiness Scale”, which was developed by Fisher, King and Tague and later adapted to Turkish language by Kocaman, Dicle, Üstün & Çimen [37]. Following the two-round Delphi technique to determine the suitability of 93 items in the scale developed based on the related literature, 52 items were found to be suitable for the scale. After the item analysis and principal components analysis, the final outcome was a 40-item scale with involving three factors. The first dimension of the scale, which is “self-management” subscale, consists of 13 items, the second subscale “willingness to learn” 12 items and the third subscale “self-control” 15 items. In order to determine the reliability of the scale, Cronbach Alpha coefficient was calculated for the overall scale and for subscales. The coefficient for the overall scale was found to be 0.92, and coefficients for self-management, willingness to learn and self-control were calculated as 0.86, 0.86 and 0.83 respectively. The number of items for the adaptation of the scale by Kocaman et.al [37]) did not change and the Alpha coefficient was calculated as 0.94 for whole scale and 0.87, 0.86 and 0.95 for subscales respectively.
Another frequently used scale for the determination of readiness for SDL is Gugliemino’s [20] “Self-Directed Readiness Scale”, which also inspired Fisher, King and Tague to develop their own scale. Following the exploratory factor analysis, the scale consisted of 8 factors and 58 items. The factors in this scale were “love to learn”, “self-respect as an independent learner”, “ability to take risks”, “complexity and incomprehensibility of terms in the field of learning”, “creativity”, “considering learning a lifelong process”, “taking initiative in learning”, “self-understanding”, and “ taking responsibility for his own learning”. The scale was adapted to different languages and their reliability and validity studies were carried out. The analyses made by different researchers revealed that reliability coefficient of the scale ranges between 0.72 and 0.96. Saeedina and Nor [38] carried out a study in which they adapted this scale to primary school students. In this study conducted with 9-year-old students, they chose 20 items from Guglielmino’s scale that are likely to be comprehended by the students of that age group. After applying the factor analysis, the final version consisted of 19 items and 7 subscales. These subscales are openness to learning opportunities, self-concept as an effective learner, initiative and independence in learning, informed acceptance of responsibility for one’s own learning, love of learning,
creativity and future orientation. In order to determine the reliability of the scale, Cronbach Alpha and test-retest reliability methods were used. Alpha reliability coefficient of the scale was calculated as 0.87 and Spearmann-Brown coefficient as 0.94. Similarly, Oddi [21] developed “Continuing Learning Inventory”, which includes the following dimensions of continual self-directed learning: Proactive versus Reactive Drive, Cognitive Openness versus Defensiveness and Commitment to Learning versus Apathy or Aversion to Learning. According to expert opinions and factor analysis results, the scale consisted of 24 items. Cronbach Alpha and test-retest statistics used for reliability analysis revealed the following coefficients; 0.88 and 0.89 respectively.
Another important scale developed according to the psychological dimension of learning is “Learner Profile Questionnaire” by Confessore & Confessore (1994). This questionnaire focuses on four factors which are influential in learning; namely willingness, resourcefulness, initiative and persistence. While this questionnaire enabled researchers to evaluate such attempts as a whole, it was not sufficient for the evaluation of each single factor. In other words, this questionnaire provided inadequate data in determining learners’ needs and the factors facilitating or deteriorating self-directed learning, Therefore, Confessore’s students developed a single scale for each factor in their dissertations by using the items in the questionnaire [cited in 39].
scale was found to be 0.93. The Pearson product-moment correlation coefficient obtained after test-retest analysis was calculated as 0.90. All four scales developed by Carr, Ponton, Derrick and Meyer take learner autonomy as a psychological construct and focus on behavioral intentions rather than measuring observable behaviors of individuals. Learner Autonomy Profile (LAP), the scale formed by combining above mentioned four scales, consists of 164 items and has been used in many studies after the detailed reliability and validity analyses. In the following years, Confessore and Park [39] developed an abridged version of the scale. The researchers did not develop any new items, and instead they excluded certain items in a way to keep reliability and item total correlation as high as possible. Regression analysis was applied for all the components under each factor step by step. For the purpose of determining which items to include while forming the abridged version, the items under each component were mutually compared and the ones with low coefficient were excluded from the scale. As a result, three items from each component, which explain the component in the best way, were kept in the scale. The second step was principal components analysis, which is applied to determine whether 22 components under the factors of the scale are combined under one single component or not. Finally, total scores obtained from the abridged version were compared to those obtained from original LAP scale by calculating Pearson product-moment correlation coefficient and later Cronbach alpha reliability coefficients were calculated. The reliability coefficients for the sub dimensions of the scale – willingness, skillfulness, entrepreneurship, and insistence- were calculated as 0.90, 0.92, 0.90 and 0.93 respectively. The results show that the abridged version of LAP can be safely used in self-directed learning studies. Aydede & Kesercioğlu [6] developed “Self-Directed Learning Skills Scale for Science and Technology” for primary schools students. A total of 59 items were developed on the basis of the ideas suggested in the related literature and the opinions of 8th year primary school students. After the content validity of the scale was calculated, principal components analysis was applied to determine the construct validity. According to the results of the analysis, 34 items were excluded from the scale since their factor load values were lower than 0.30 and involved more than one factor. The remaining 25 items formed the final version of the scale. The factor analysis applied revealed that this 25-item scale includes two factors; namely “Planning Self-Directed Learning in Science and Technology Course” and “Self-Confidence for Self-Directed Learning in Science and Technology Course”. The Cronbach alpha coefficient for the overall scale was found to be 0.86. The scales developed or adapted by researchers so far mostly focus on adults or university students. Most of the pioneering studies on self-directed learning available in the related literature were conducted with adult subjects. However, the importance of acquiring self-directed learning skills at earlier ages just like in adulthood was highly emphasized in the literature in the following years [26, 40, 41,
42, 43, 44]. Self-directed learning, which is defined as primary school students’ internalizing their responsibility in learning and working individually or in small groups [Treffinger, 1993 cited in 45], is considered the key factor in lifelong learning [46]. Primary school educational programs applied in Turkish context suggest educating individuals who are committed to lifelong learning. These programs stipulate that lifelong learning is a necessity and this can be realized only by making students enjoy learning during schooling. Therefore, the following suggestions are highlighted in these programs: it is necessary to provide conditions where students enjoy learning and learning to learn; it is vital to educate individuals who can identify and solve problems and take responsibility for their own learning; and it is essential to provide each single child with opportunities to continue his/her development and to increase and enrich his/her potentials [47]. Parkinson [3], in his study on skills related to lifelong learning, suggests the following: focusing on learning rather than academic achievement; managing learning; learning out of school environment; solving design problems; performing self-assessment; doing research; learning to learn; and identifying weaknesses. Self-directed learning provides students with necessary skills to learn also out of their formal learning environments at schools and to continue their lifelong learning experiences effectively. Helping students to acquire these skills also plays an effective role in increasing their academic achievement. Senemoğlu [48] states that students’ academic achievement highly depends on being aware of their own learning process and managing it effectively.
learning effectively. Just like adults and young learners have different levels in realizing their self-directed learning, their self-directed learning skills, which involve cognitive and affective skills they have or they can have, also differ considerably. Developing self-directed learning in 6 to 9 year-old students entails qualities such as displaying enthusiasm, being motivated and curious, taking initiatives, seeking help from others when needed, perseverance, learning from mistakes, setting goals and self-evaluation (not necessarily explicit), working together with others, taking risks and finding empowerment in the process [31].
Although the idea that self-directed learning should be acquired at early ages has been agreed by experts to a great extent, the studies focusing on self-directed learning process of primary school students mostly deal with the definition or description of self-directed learning and how to associate it with various factors [5, 31, 45, 53, 54, 55, 56]. Despite the presence of a few studies conducted on developing self-directed learning skills of primary school students [57, 58, 59], there are no studies focusing on the skills that students of that age group should have in order to ensure self-directed learning. Because of this gap in the related literature, no scale is available to determine to what extent students already have these necessary skills. The literature review also revealed no studies on developing a scale for primary school students. The only study related to scale development for the above mentioned purpose was the adaptation of the scale developed by Guglielmino for adults. The adopted version of the scale included the items that might be easily comprehended by the children of that age group and no new items were developed in this adaptation study by Nor and Saeednia [38]. In addition, some of the subfactors in the scale were represented by only one single item. This adapted version was, however, criticized by some experts. They stated that the exclusion of some items might result it hindering the determination of certain skills that are crucial for self-directed learning, so the scale is likely to be insufficient in determining the self-directed learning skills of primary school students. As a result, it might be suggested that it is essential to develop a more comprehensive and detailed scale involving the necessary skills in self-directed learning for young learners.
In addition to the fact that related literature lacks a scale specifically developed for primary school students, it is believed that determining students’ levels of self-directed learning will be important in raising their awareness about the skills they should have in order to be autonomous learners and helping them to know about their weaknesses and strengths. In addition, teachers will access to valuable information in order to guide their students by using appropriate strategies for the development of self-directed learning. Considering these problems and needs, the current study aims to develop a scale to determine self-directed learning preparatory skills of primary school students and apply reliability and validity studies to the scale developed.
2. Method
The current research is a scale development study. The characteristics of participants and the scale development stages of the study were presented below.
2.1. Participants
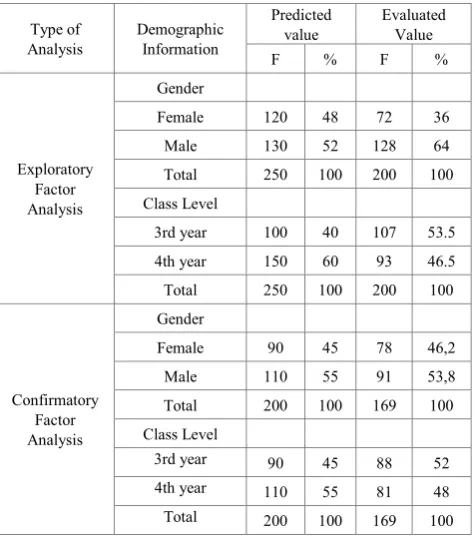
[image:5.595.315.553.479.748.2]The subjects for the current study were chosen by using purposive sampling method. The schools of students in the sampling were determined by using criterion sampling and maximum variation methods, which are types of purposive sampling methods, and the classrooms in these schools were selected by using random sampling method. Criterion sampling method refers to the determination of situations that meet the predetermined criteria [60]. For the purposes of the study, 3rd and 4th year primary school students were chosen as the subjects of the study. In maximum variation sampling method, the aim is to represent the population of the study as much as possible [60]. In this study, schools were determined on the basis of socioeconomic differences and general academic achievement. Accordingly, a total of three primary schools located in Eskişehir were chosen as the sampling of the study. Each primary school was chosen according to socio-economic and general academic success levels; high, medium and low.Classrooms from 3rd and 4th year classes where the scale was administered were chosen by using random sampling method and students in these classrooms became the study group of the current study. Table 1 displays demographic information of the students in the study group such as the class they attend and gender.
Table 1. Demographic Information of the Students Participated In The
Study
Type of
Analysis Demographic Information
Predicted
value Evaluated Value
F % F %
Exploratory Factor Analysis
Gender
Female 120 48 72 36
Male 130 52 128 64
Total 250 100 200 100
Class Level
3rd year 100 40 107 53.5
4th year 150 60 93 46.5
Total 250 100 200 100
Confirmatory Factor Analysis
Gender
Female 90 45 78 46,2
Male 110 55 91 53,8
Total 200 100 169 100
Class Level
3rd year 90 45 88 52
4th year 110 55 81 48
There are different suggestions in the related literature regarding the number of people in a sampling required for factor analysis. While Nunnaly [61] suggests that 10 or 15 participants for each item should be included in the analysis, Gorsuch [62] claims 5 participants would be sufficient for the analysis. This study was conducted with the number of participants suggested by Gorsuch [62]; however, a certain number of forms were excluded from the analysis since they were not returned by the participants or filled out incorrectly and incompletely. As shown in Table 1, sampling sizes in the current study were planned to be between 200 and 300 for the purposes of exploratory factor analysis. Self-directed Learning Readiness Skills Scale was applied to 100 3rd year and 150 4th year students; the total being 250 students. One classroom (a total of 25 students) did not return the scales and another 25 students replied the scale incorrectly or left some items unanswered. Therefore, these 50 scales were not included in the analysis. Exploratory factor analysis was applied to the data obtained from 200 students. According to Table 1, 72 of these students are females, 128 males; 107 3rd year and 93 4th year students. Kline [64] and Guilford [1954 cited in 63] claims that a total of 200 people in a sampling would suffice to identify reliable factors in a factor analysis. Similarly, Kim-Yin suggests certain sampling sizes to keep an item in the scale. Accordingly, sampling size should be 200 for an item with a factor load of 0.40 [cited in 65]. Although the number of subjects were determined as 250, the factor load was calculated as 0.40 since the data obtained from 200 survey forms was included in the analysis as suggested in the related literature.
It is necessary to have adequate sampling size in order to apply confirmatory factor analysis. As suggested in the related literature [66, 67, 68], sampling size should be at least 100 for confirmatory factor analysis. As displayed in Table 1, the confirmatory factor analysis of the scale, which was done after exploratory factor analysis, was planned to be applied to the data obtained from 200 students. The students which are the subjects of confirmatory analysis are different from those of exploratory analysis. However, since 31 students filled out the scale incorrectly or did not reply to some items, the analysis was applied to the data obtained from a total of 169 students. As shown in Table 1, 78 of these students are females and 91 males; 88 third year and 81 fourth year students.
2.2. Implementation Process
The first phase in the development of the scale was literature review, in which the previously developed or adapted scales were examined. In addition, self-directed learning preparation skills that students should have were determined and “Self-Directed Learning Preparation Skills Scale” was developed accordingly. After a thorough literature review, a total of 40 items related to self-directed learning preparatory skills were prepared. The items of the scale were revised after document analysis and expert
opinions. The details of this process are given below: Following the literature review, a survey was administered to primary school teachers and students (from first year to fifth year) in February 2012 to obtain their opinions regarding self-directed preparation skills. Self-directed learning preparation skills were revised according to the results obtained from this questionnaire. After the revisions, self-directed preparation skills included a total of 24 items in two groups; namely learning skills and affective skills.
Common basic skills and learning outcomes of the following subjects were examined: Turkish, Mathematics, Life Sciences, Social Sciences, and Science and Technology., which were the main courses of primary school education (from 1st year to 4th year): The first two phases included the revision of self-directed learning preparation skills based on the framework of skills covered in curricula and literature review. This new version consisted of the following self-directed learning preparation skills: determining learning needs, determining learning goals, managing
learning resources and communication skills. Affective
skills are taking responsibility of one’s own learning, willingness to learn and valuing learning. At the end of this phase, self-directed learning preparation skills consisted of 50 items in total.
“Self-Directed Learning Preparation Skills” scale was to a total of 9 experts for feedback and evaluation; five being experts in Educational Programs and Teaching (the main field); two language experts and two primary school teachers. The experts were asked to evaluate the items in the scale in terms of language use (Turkish), appropriateness to the characteristics of the group that the scale is planned to be administered, and the theme. The feedback received from the experts was evaluated by the researcher by taking similarities and differences mentioned into consideration. As a result, 9 items were excluded from the survey; 3 were revised and two items were rewritten as separate items due to overlapping.
The finalized version after the feedback received from the experts was piloted with 10 students attending İbrahim Karaoğlanoğlu Primary School and having similar characteristics with the subjects of the study; 5 3rd year students and 5 4th year students. The aim of this pilot study was to test the items in terms of comprehension. Since item 3 and item 10 were not clearly understood by the students, they were reevaluated in terms of language and clarity and corrected accordingly. After these revisions, the scale was given to 6 more students; 3 4th year and 3 3rd year students. The final version was observed to create no problems in terms of comprehension.
3. Findings
3.1. Construct Validity
Firstly, exploratory factor analysis was applied to the data obtained and later confirmatory factor analysis. Finally, the relationship between predetermined latent and observed variables was tested in order to validate factor structure. 3.1.1. Exploratory Factor Analysis Results
Exploratory factor analysis was used to examine the structure of the data obtained and to eliminate the problematic items during the scale development process. For the purposes of this analysis, Principal Components Analysis and Varimax rotation were applied. The aim of principal components analysis is to obtain maximum number of variances with each variable in a set of data. It is a practical solution for researchers who want to categorize a large number of variables into relatively low number of variables [65]. It is also suggested that this method is psychometrically strong, mathematically simple and quite effective in dealing with potential uncertainty factor problems [69].
Kaiser-Mayer-Oklin coefficient and Barlett Sphericity test are also very important for the calculation of adequate sample size for exploratory factor analysis -that is the applicability of the collected data for exploratory factor analysis. Keiser –Mayer-Oklin coefficient must be at least .60 for a sound factor analysis. In addition, p value calculated in Barlett test must be meaningful [70]. The suitability of the data collected from the students for principal components analysis was evaluated with Keiser – Meyer-Olkin coefficient and Barlett Sphericity test result, which are displayed in Table 2.
Table 2. Kaiser-Meyer-Olkin and Barlett Test Results
Kaiser-Meyer-Olkin Statistics ,903
Bartlett's Test of
Sphericity (Approximately) Chi Square 3781,912
Degree of Freedom 903
Level of Significance ,000
As shown in Table 2, Keiser – Meyer –Olkin coefficient was calculated as 0.903, which shows that data set is suitable for factorization. Also, meaningful p value (p<.05) implies
high correlation between the variables. In other words, sampling size is suitable for Principal Component Analysis. One of the mostly used techniques for determining the number of factors is Catell’s scree plot. According to this analysis, 43 items were categorized under 12 factors, whose eigen value is higher than 1. After Varimax rotation, the distribution of these items according to the factors and scree plot results were examined. According to the results, this 12-factor structure does not have a meaningful structure for self-directed learning preparation skills. Accordingly, four-factor structure was found to be appropriate.
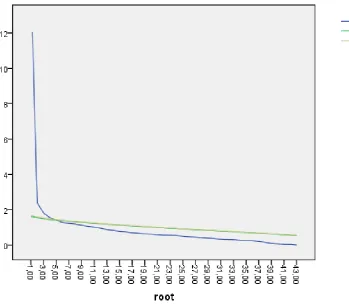
In this study, in order to determine the number of factors to be included in the scale, parallel analysis method was also used, which was developed by Horn [71]. This method requires a series of random matrices which include the same number of participants and variables as the real data. These random matrices are applied principal components analysis and the mean of eigenvalues are calculated, and later these values are compared to those obtained from the real data. The criteria used for the determination of factor numbers is the point where the eigenvalues obtained from the real data are higher than those obtained from random data [72, 73]. When the eigenvalues obtained from parallel analysis was examined, it is seen that the first four eigenvalues that belong to the original matrix are higher than random data eigenvalues’ means and percentage values, but it gets lower after the fifth value. Therefore, the number of dimensions was found to be 4 since the value of original matrix was higher than the eigenvalues obtained from random matrix. The examination of scree plots obtained from the analyses is a useful guidance for researchers while determining the number of factors. Figure 1 and Figure 2 displays eigenvalues analysis, Catell’s scree plot and Horn’s parallel analysis.
Figure 1. The Eigenvalue Analysis of Self-directed Learning Preparation Skills Scale Obtained From Catell’s scree plot
[image:8.595.114.464.400.704.2]The value obtained after parallel analysis regarding the number of factors is the same as the value calculated in factor analysis. Based on these graphics, the number of factors was determined as 4.
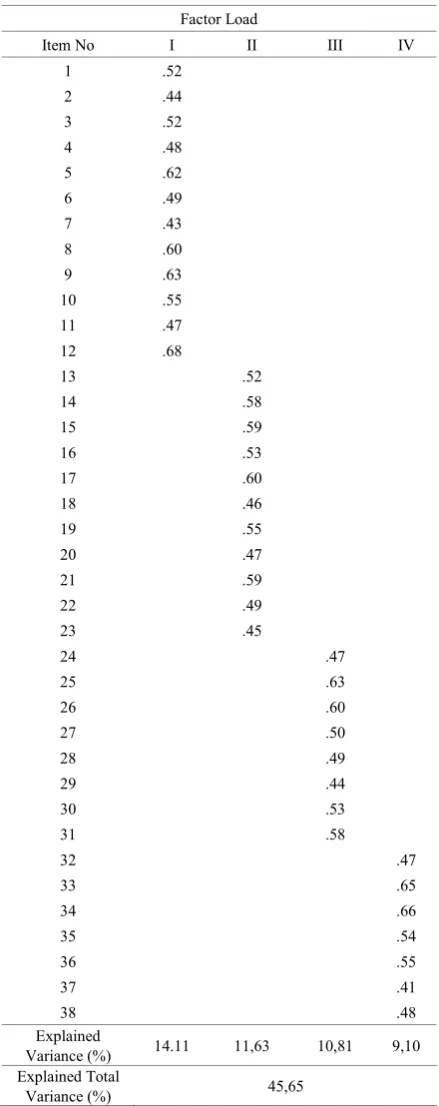
[image:9.595.322.542.103.657.2]While deciding which items will be included in the scale, the following criteria were followed: item factor load is higher than 0.40 [75] and the difference between the item loads of two factors is at least 0.10 when an item is placed in these two factors at the same time [74]. The results of factor analysis for validity and factor loads are shown in Table 3. Before the analysis, the scale had totally 43 items. After the validity analysis, 3rd, 21st, 22nd, 34th, and 40th items whose factor loads were lower than 0.40 were excluded from the draft scale. The remaining 38 items were renumbered in the new version of the scale. The item loads calculated in validity analysis are between 0.68 and 0.40 and the scale has a four-factor structure. The total variance explained by these factors together is 45.65 %. The variance ratios ranging between 40% and 60 % in factor analyses are accepted as ideal [64]. The first factor in the scale is “Continuity in Learning Skills”, which includes 12 items and explains 14.11% of total variance. The items in this factor are mostly related to taking responsibility in learning, which refers to students’ being responsible for their own learning. In other words, determination of learning goals, application of practices to ensure learning and the evaluation of learning are learning-centered [7, 12, 20, 24, 26, 30]. In addition, “continuity in learning skills” also cover communication skills, having pleasure in learning, valuing learning and out-of-school learning. “Valuing learning” refers to learners’ belief and awareness that their learning is important for themselves and the society. The second factor is called “Planning Learning Skills” and includes 11 items. Planning learning involves determining learning needs and learning goals skills and it explains 11,63 % of total variance. “Learning needs determination skills” refer to learners’ planning their learning by analyzing the differences between the existing situation and desired one. “Learning goal determination skills” are the ones used to determine the goals learners want to achieve at the end of learning process. Third factor, “awareness towards learning skills”, includes 8 items and explains 10.81% of total variance. It involves the following skills: communication skills and willingness to learn. “Willingness to learn” is learners’ attempts to learn new information and being curious on his/her own will. “Communication skills” involve the expression of feelings, opinions or information through written, oral or visual channels as well as listening to feelings, opinions of others and the knowledge they have (Meyer, 2001, [15]). The last factor, which is called “management of learning environment and learning resources skills”, includes 7 items and explains 9.10 % of total variance. These skills are about determining time, environment, finance and human resources needed to obtain knowledge to achieve desired goals (24, 27, 76].
Table 3. Factor Analysis and Factor Loads of Self-Directed Learning
Preparation Skills Scale
Factor Load
Item No I II III IV
1 .52
2 .44
3 .52
4 .48
5 .62
6 .49
7 .43
8 .60
9 .63
10 .55
11 .47
12 .68
13 .52
14 .58
15 .59
16 .53
17 .60
18 .46
19 .55
20 .47
21 .59
22 .49
23 .45
24 .47
25 .63
26 .60
27 .50
28 .49
29 .44
30 .53
31 .58
32 .47
33 .65
34 .66
35 .54
36 .55
37 .41
38 .48
Explained
Variance (%) 14.11 11,63 10,81 9,10
Explained Total
Variance (%) 45,65
Table 4. Item Analyses for Overall Scale
Item X Sx Item Total
M1 4,13 1,16 ,63
M2 3,74 1,30 ,46
M3 4,08 1,23 ,55
M4 3,79 1,35 ,53
M5 4,20 1.00 ,49
M6 3,94 1.25 ,60
M7 3,85 1,27 ,54
M8 4,19 1,16 ,60
M9 4,06 1,24 ,48
M10 3,85 1,13 ,59
M11 4,02 1,21 ,55
M12 3,85 1,25 ,52
M13 3,83 1,18 ,58
M14 4,14 1,08 ,53
M15 3,86 1,28 ,56
M16 3,91 1,20 ,53
M17 4,03 1,17 ,59
M18 3,93 1,18 ,65
M19 4,17 1,15 ,46
M20 4,11 1,17 ,60
M21 4,31 1,19 ,66
M22 4,06 1,15 ,64
M23 4,30 1,02 ,62
M24 4,30 1,05 ,65
M25 4,16 1,04 ,63
M26 4,09 1,08 ,65
M27 4,33 1,02 ,52
M28 4,06 1,10 ,63
M29 4,29 0,98 ,60
M30 4,17 1,11 ,60
M31 4,31 1,01 ,59
M32 4,28 1,09 ,64
M33 4,30 1,11 ,59
M34 4,04 1,23 ,54
M35 4,14 1,17 ,66
M36 4,07 1,18 ,72
M37 3,87 1,34 ,51
M38 4,17 1,22 ,62
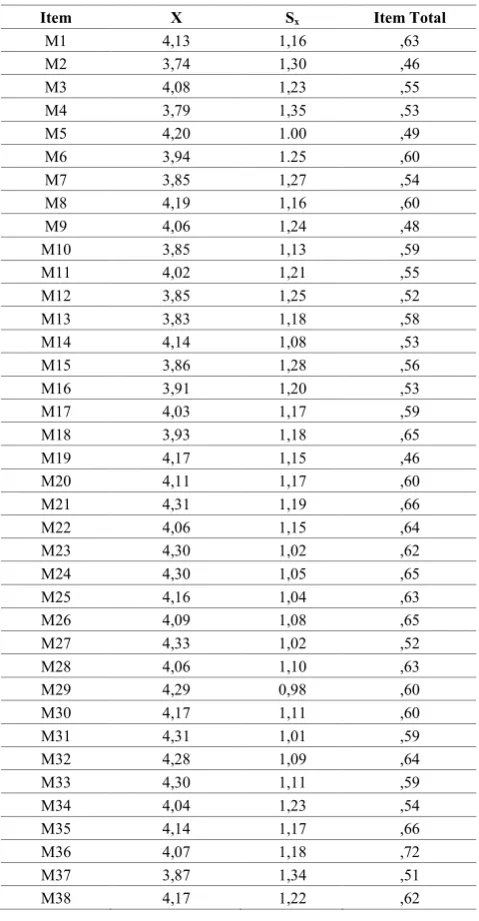
When the item mean scores are examined in Table 4, it is seen that this value is over 4 for most of the items. The values over 4 means high agreement by the subjects for these items, which implies that items are highly agreed by the participants. Standard deviation values calculated range between 0.98 and 1.35. Item total correlation explains the relationship between the scores obtained from test items and the total score for the test [65, 77]. Corrected item-total correlations range between 0.21 and .51. According to Büyüköztürk [60] the items with an item total correlation value less than 0.20 should be excluded from the scale. Since there are no items with a value lower than 0.20, all the items analyses were kept in the scale.
In order to determine item discrimination of the scale, 27% top and bottom group comparison analysis was also applied to the data. As for the internal validity of the scale, independent group t-tests were made. First of all, test scores were sorted from the lowest to the highest and later 27% bottom and top scores were calculated. The scores obtained by 54 teachers for each top and bottom group were compared. In these comparisons, t value was found to be meaningful at p<.001 level. When examined, it is seen that t values for the differences between item points of 27% top and bottom groups range between 6.441 and 11.303. The mean of top group for total item points is also higher, which shows that there is a meaningful difference (p<0.01) in favor of the top group. Accordingly, it might be concluded that items have internal reliability and high discrimination within themselves.
When the dual correlations between factor points are examined, it can be said that there is a positive relationship among each factor, though being at medium level. The highest correlations were between “Continuity in Learning Skills” and “Awareness Towards Learning Skills”, and between “Continuity in Learning Skills” and Management of Learning Environment and Learning Resources Skills”. The relationship among the factors in the developed scale is shown in Table 5.
Table 5. The Correlation among the Factors of the Scale
Correlation Coefficient
Continuity in
Learning Skills Learning Skills Planning in Awareness Towards Learning Skills
Management of Learning Environment and Learning
Resources Skills
Continuity in Learning Skills 1 .71 .72 .72
Planning in Learning Skills .71 1 .65 .67
Awareness Towards Learning Skills .72 .65 1 .63
Management of Learning Environment and
Learning Resources Skills .72 .72 .63 1
Self-Directed Preparation Skills
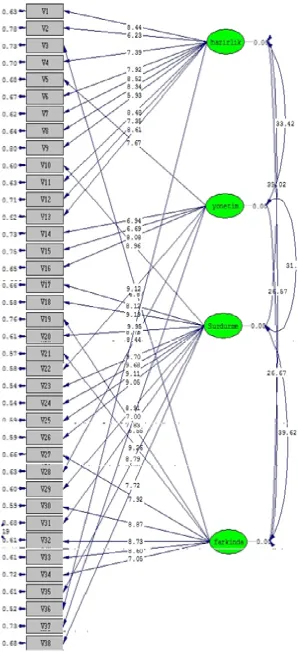
[image:10.595.65.548.584.716.2]3.1.3. Confirmatory Factor Analysis Results
Confirmatory factor analysis is used to test the accuracy of factor structure predetermined by the researcher. This analysis assumes that more than one latent variable, which are thought to be structured by the items in the scale, is explained by another latent variable and tests the appropriateness of this assumption to the available data set [78, 79, 80, 81]. Kline [79] recommends confirmatory factor analysis in order to test the accuracy of the model revised after exploratory factor analysis. In this study, the model obtained after exploratory factor analysis was tested by using data obtained from another sampling in order to test the validity of the structure formed.
[image:11.595.56.296.450.684.2]The first thing researchers should check is the level of significance of t values. The connection diagram showing standard coefficients regarding the model was presented in Figure 2. Parameter predictions are meaningful at .05 level if “t” values exceed 1.96, and they are meaningful at .01 level when they exceed 2.56. In the analyses done in structural equality model, t values that are not meaningful must be excluded from the analysis. However, it can be useful to check error variances as well before making the final decision [65]. As shown in Figure 2, all indicators give meaningful t values at .01 and .05 level and error variances are quite low. Another value that should be examined is p value, which provides information about the significance of the difference between predicted covariance matrix and observed (x2)
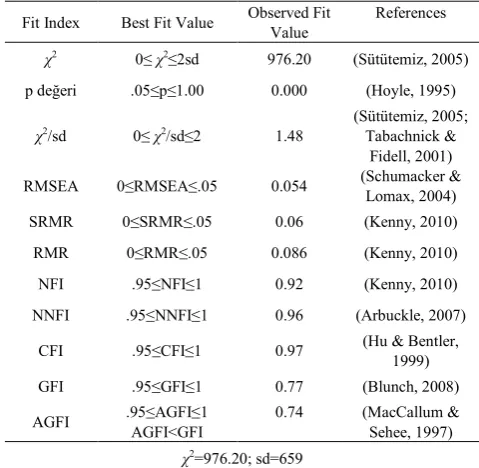
Table 6. The Ideal Fit values for Exploratory Factor Analysis in the
Related Literature and the Fit Values Observed in the Scale
Fit Index Best Fit Value Observed Fit Value References
χ2 0≤ χ2≤2sd 976.20 (Sütütemiz, 2005)
p değeri .05≤p≤1.00 0.000 (Hoyle, 1995)
χ2/sd 0≤ χ2/sd≤2 1.48 (Sütütemiz, 2005; Tabachnick & Fidell, 2001) RMSEA 0≤RMSEA≤.05 0.054 (Schumacker & Lomax, 2004)
SRMR 0≤SRMR≤.05 0.06 (Kenny, 2010)
RMR 0≤RMR≤.05 0.086 (Kenny, 2010)
NFI .95≤NFI≤1 0.92 (Kenny, 2010)
NNFI .95≤NNFI≤1 0.96 (Arbuckle, 2007)
CFI .95≤CFI≤1 0.97 (Hu & Bentler, 1999)
GFI .95≤GFI≤1 0.77 (Blunch, 2008)
AGFI .95≤AGFI≤1 AGFI<GFI 0.74 (MacCallum & Sehee, 1997)
χ2=976.20; sd=659
Naturally, it is better when p value is not meaningful; however, meaningful p value can be tolerated in many studies. Therefore, it is useful to evaluate alternative fit indexes about the application between two matrices [65]. Fit indexes obtained after the analyses regarding the model are displayed in Table 6.
3.2. Reliability Analysis
[image:13.595.58.297.155.291.2]In order to test the presence of normal distribution in the data, Kolmogorov-Smirnov Test was applied. The results of the test are displayed in Table 7.
Table 7. The Results of Kolmogorov-Smirnov Z Test
N TOTAL 200
Normal Parameters (a,b)
Mean 152,77
Standard Deviation 24,782
Most Extreme Differences Absolute ,115
Positive ,080
Negative -,115
Kolmogorov-Smirnov Z 1,629
Asymptotic Significance
(2-tailed) ,000
The maximum score to be taken from this 38-item scale is 190 and the minimum score is 38. According to the analyses, the minimum score was calculated as 61 and the highest score was 188; the range was 127. As displayed in Table 7, the mean value for the scale is 152.77, standard deviation 24.782, skewness value -.32 and kurtosis .58. Kolmogorov-Smirnov test results showed a meaningful p value. This result implies that the data does not have normal distribution. Pallant [56] suggests that this result is often observed in studies with high number of subjects and low p value cannot be interpreted as the absence of normal distribution. Similarly, Tabachnick and Fidel [84] emphasize that skewness and kurtosis values are more sensitive in big samplings; and therefore, distribution should be examined by using histogram. In the current study, the results of normal probability graph, detrended normal probability graph and box plot were examined. The analyses done revealed a normal distribution.
In order to calculate internal consistency of the scale, Cronbach Alpha coefficient was used. The value was calculated as .94. If Alpha value is between 0.80 and 1 in a scale with one variable, the scale is considered highly reliable [91]. As shown in Table 8, internal consistency value for each of these four factors was calculated as .87, .85, .80 and .80 respectively. Therefore, the scale used in this study can be told to be highly reliable.
Table 8. Reliability Coefficients of Subscales
Subscales Cronbach’s α
Continuity in Learning Skills .87
Planning in Learning Sills .85
Awareness Towards Learning Skills .80
Management of Learning Environment and
Learning Resources Skills .80
The second test used in reliability analyses of the scale was split-half method, which is used when test-retest or equivalent forms methods are not practical or difficult to
apply and when the test measures only one variable [78]. The reliability data obtained by using half-split method is also known as internal consistency. The Spearman-Brown two halves test correlation was found to be 0.90, which is within the range of acceptable values in the literature. The values over 0.80 are considered “good” in the related literature [93].
The results of reliability and validity analyses clearly showed that “Self-Directed Preparation Scale” (Appendix 1), which consists of 4 subscales and 38 items, can be used to determine preparation skills of primary school students for self-directed learning.
4. Conclusions
This study aimed to develop a scale for determining primary school students’ SDL preparation skills. In the current study, exploratory factor analysis was realized first and later confirmatory factor analysis was applied via LISREL. The item-total correlation of the items in the scale was found to be between .68 and .40. The scale consists of four factors which are “Continuity in Learning Skills”, “Planning in Learning Skills”, “Awareness Towards Learning Skills” and “Management of Learning Environment and Learning Resources Skills”. The total variance of four factors in the scale is 45,65 %. After the exploratory factor analysis, confirmatory factor analysis was applied to the data obtained. Although the results of the first analysis suggested revisions in some items, these modifications were not made since chi square value was within the acceptable value range and the modifications were not going to change chi square value. In other words, the fit according to the values obtained in the first analysis was quite good. The results of reliability analysis showed that internal consistency values were found to be within an acceptable range. Cronbach Alpha value, the internal consistency coefficient, was calculated as 0.94. The scale consists of four subscales and 38 items.
[image:13.595.57.297.631.713.2]learning skills” also covers communication skills, having pleasure in learning, valuing learning, and out-of-school learning. “Valuing learning” refers to learners’ belief and awareness that their learning is important for themselves and the society. The importance of these indicators’ in SDL was also emphasized in related literature [7, 12, 24].
The second factor is called “planning learning skills”. Planning learning involves determining learning needs and learning goals skills. “Learning needs determination skills” refers to learners’ planning their learning by analyzing the differences between the existing situations and desired one [7]. Although the importance of determining learning needs skills is emphasized by most of scientists in the literature [8, 28, 94, Bradley & Lane, 1996 cited in 95], there weren’t any items related to these skills in previously developed scales. This scale differs from other SDL scales since it includes indicators related to learning needs determination skills. “Learning goal determination skills” are the ones used to determine the goals learners want to achieve at the end of the learning process. Although determining learning goals skills were included in previously developed scales [11, 12, 24], these skills were usually expressed with one indicator in these scales. In the present scale, determining learning goals skills included more than one indicator; in other words, these skills were represented in more detail.
Third factor is called “awareness towards learning skills”. It involves the following skills: communication skills and willingness to learn. “Communication skills” involves the expression of feelings, opinions or information through written, oral or visual channels as well as listening to feelings, opinions of others and the knowledge they have [25]. This scale is similar to Williamson’s a self-rating scale of self-directed learning [30] and Meyer’s Inventory of Intentional Behavior [25] since both involve communication skills. “Willingness to learn” is learners’ attempts to learn new information and being curious on his/her own will. Willingness to learning is also presented in other SDL scales just like other indicators as such as being curious about learning, having pleasure in learning [7, 12, 24] and as being open to learning [24, 30]).
The last factor is called “management of learning environment and learning resources skills”. These skills are about determining time, environment, finance and human resources needed to obtain knowledge to achieve desired goals. [24, 27, 62]. The importance of managing learning time effectively [27, 94] and managing learning resources skills [27, 94, 96] are emphasized by in the related literature. Although the importance of these skills in SDL is expressed by a lot of scientists, there weren’t any items related to these skills in previously developed scales. It can be said that this scale is different from the previous scales since it covers these skills in more detail.
According to the results of the study, the scale, which was developed based on the findings obtained in the study, was found to be a reliable and valid as a data collection instrument that can be used in the studies to be conducted to
determine preparation skills for self-directed learning with primary school students. It is suggested that the studies to be carried out with different subjects might provide valuable data regarding the consistency of the scale. In addition, further studies can be conducted to adapt the scale to various levels of education in order to use it in a wider context.
It is a well-known fact that the most important components of teaching-learning process are students, teachers and parents. Therefore, the discussions about SDL and SDLPSS that focus on students and teachers will contribute to the effective and efficient realization of teaching-learning process. When we raise teachers’ and students ‘awareness about SDL and SDLPSS skills, it is likely that there will be more practical applications in classroom environments and learners will be equipped with SDL skills accordingly - especially at primary school level. When the related literature is examined, it can be seen that there are few discussions aiming to explain SDL in detail and a limited number of related studies have been conducted with primary school students. The primary reason of discussions about SDL at adult level is that SDL is considered a key concept leading to increase in job performance. However, it is difficult to develop SDL as the age increases because learning strategies that learners develop according to their personal learning tendencies are acquired as early as possible; namely during primary school years. Therefore, the attempts to equip adults with SDL and SDLPSS skills are a wrong and inadequate approach. Thus, SDL and SDLPSS skills should be developed at primary school level by adopting a bottom up approach rather than a top-down one. It is necessary to continue discussions about the issue and to conduct new research by considering the changes in approaches mentioned in this study to find new methods and techniques to help students to acquire these skills more effectively.
Appendix: Self-directed Learning Planning Skills Scale
Notapplicable applicable Very few Somewhat applicable applicable Quite Completely applicable Planning in Learning Skills
1. I specify what I already know about the topic to be learned. 2. I identify my weaknesses regarding my own learning
process. …
Continuity in Learning Skills
I successfully complete the learning task for which I take responsibility
I find different solutions for the problems I face during my learning process.
…
Awareness towards Learning Skills
I identify my strengths regarding my own learning process. I determine the individuals to ask for help to achieve my goal
when conducting a study / research. …
Management of Learning Environment and Learning Resources Skills
I make certain choices regarding my learning in accordance with my abilities
I determine the learning resources that I will use to achieve my goal when conducting a study / research
…
REFERENCES
[1] Elaldı, Ş. (2015). Investigating lifelong learning dispositions of students studying English language and literature in terms of different variables. Educational Research and Reviews, 10 (16), 2340-2351.
[2] Soran, H., Akkoyunlu, B., Kavak, Y. (2006). Yaşam boyu öğrenme becerileri ve eğiticilerin eğitimi programı: Hacettepe Üniversitesi Örneği. Hacettepe Üniversitesi Eğitim Fakültesi Dergisi, 30, 201–210.
[3] Parkinson, A. (1999). Developing the attribute of lifelong learning. Frontiers in Education Conference Proceedings,
12b6-13.Retrieved September 28, 2014 from http://fie-conference.org/fie99/papers/ 1027.pdf.
[4] Morrison, D. and Premkumar, K. (2014). Practical strategies to promote self-directed learning in the medical curriculum.
International Journal of Self-directed Learning, 11 (1), 1-11. [5] Saeednia, Y. (2011). Basic needs satisfaction and self-directed learning among children: An appraisal of the educational aspects of Maslow’s theory. United States of America: VDM Publishing House.
[6] Aydede, M. N. & Kesercioğlu, T. (2009). Fen ve teknoloji dersine yönelik kendi kendine öğrenme becerileri ölçeğinin geliştirilmesi. Çukurova Üniversitesi Eğitim Fakültesi Dergisi, 3 (36), 53-61.
[7] Derrick, M. G. (2001). The measurement of an adult’s intention to exhibit persistence in autonomous learning
(Doctoral dissertation, The Faculty of The Graduate School of Education and Human Development, The George Washington University, USA). George Washington University, USA. Available from ProOuest Dissertations and Theses database. (UMI No. 3006915).
[8] Knowles, M. (1975). Self-directed learning: A guide for learners and teachers. Chicago: Follett Publishing Company. [9] Hoban, S. & Hoban, G. (2004). Self-esteem, self-efficacy and
self-directed learning: attempting to undo the confusion,
International Journal of Self-Directed Learning, 1 (2). 7-25. [10]Zsiga, P.L. & Webster, M. (2007). Why should secondary
educators be interested in self-directed learning?,
International Journal of Self-Directed Learning, 4 (2). 58-68. [11]Annuar, N & Shaari, R. (2014). The antecedents of
self-directed learning among distance learner in Malaysian public universities, Global Summit Education, 195-205. [12]Fisher, M., King, J. & Tague, G. (2001). Development of
self-directed learning readiness scale for nursing education.
Nurse Education Today, 21, 516-525.
[13]English, M. C., & Kitsantas, A. (2013). Supporting student self-regulated learning in problem-and project-based learning. Interdisciplinary Journal of Problem-Based Learning, 7(2), 127-150. doi:10.7771/1541-5015.1339.
[15]Küçüker, G. F. (2014). İlkokul öğrencilerinin kendi kendine öğrenme becerilerinin geliştirilmesine yönelik öğretici destekli bir model önerisi, (Doctoral dissertation), Anadolu Universtiy, Turkey.
[16]Teal, Vess and Ambrose (2015). Linking positive psychology with self-directed learning: A model of self-directed wellness, International Journal of Self-directed Learning, 12 (1), 16-28. [17]Benvenuti, S. A (2012). Facilitating the development of
self-directed learning skills in information system students. (Master thesis, University of the Witwatersrand, Johannesburg).
[18]Shin, G. (2012). An analysis of learning principal in two types of self-directed learning purpose. International Journal of Education and Learning, 1 (1), 35-39.
[19]Hiemstra, R., & Brockett. (2012). Reframing the meaning of selfdirected learning: An updated model. 53rd Annual Adult Education Research Conference, Saratoga Springs, NY. Retrieved from http://www.adulterc.org/Proceedings/2012/p apers/ hiemstra.pdf
[20]Guglielmino, L. M. (1977). Development of the self-directed learning readiness scale (Doctoral dissertation, University of Georgia, USA). Retrieved from http://search.proquest.com/p qdtglobal?accountid=7181.
[21]Oddi, L. F. (1984). Development of an instrument to measure self-directed continuing learning (Doctoral dissertation), Illinois Univesity, USA. Retrieved from http://search.proque st.com/pqdtglobal ?accountid=7181
[22]Confessore, G. J. (1992). An introduction to the study of self-directed learning. G.J. Confessore ve S.J. Confessore (Ed.)., Guideposts to self-directed learning: Expert commentary on essential concepts. King of Prussia, PA: Organization Design and Development, Inc. 1-6.
[23]Carr, P. B. (1999). The measurement of resourcefulness intentions in the adult learner (Doctoral dissertation, The Faculty of The Graduate School of Education and Human Development, George Washington University). Available from ProOuest Dissertations and Theses database. (UMI No. 9949341).
[24]Meyer, D. T. (2001). The measurement of intentional behavior
as a prerequisite to autonomous learning. (Doctoral
dissertation, The Faculty of The Graduate School of Education and Human Development, The George Washington University, USA). George Washington University, USA. Available from ProOuest Dissertations and Theses database. (UMI No. 9999882).
[25]Long, H. B. (1990). Learner managed learning. New York: St Martin’s Press.
[26]Costa, A. L. & Kallick, B. (2004). Assessment strategies for self-directed learning, Thousand Oaks, California: Corwin Press
[27]Long, H.B. (2005). Skills for self-directed learning. Retrieved from
http://docs.google.com/viewer?a=v&q=cache:SFZIYmg2Gp IJ:www.ode.state. or.us.
[28]Ponton, M. K. (2006). Autonomous learning from a social cognitive perspective, New Horizons in Adult Education and Human Resource Development, 20 (2), 38-49.
[29]Williamson, S. N. (2007). Development of a self-rating scale of self-directed learning. Nurseresearcher, 14 (2).
[30]Mettler, A. and Korte, M. (2012). The early learning center at Jeffers, on Open School: (Re)discovering the joy of learning. International Journal of Self-directed Learning, 9 (1), 38-49. [31]Francis, A. and Flanigan, A. (2012). Self-directed learning and
higher education practices: Implications for student performance and engagement. The International Journal of the Scholarship of Teaching and Learning, 7 (3), 1-18. [32]Alcı, B. & Altun, S. (2007). Lise öğrencilerinin matematik
dersine yönelik özdüzenleme ve bilişüstü becerileri, cinsiyete, sınıfa ve alanlara göre farklılaşmakta mıdır? Ç. Ü. Sosyal Bilimler Enstitüsü Dergisi, 6(1), 33-44.
[33]Saks, K. And Leijen, A. (2014). Distinguishing self-directed and self-regulated learning and measuring them in the e-learning context. Procedia-Social and Behavioral Sciences. 12, 190-198.
[34]Shaikh, R. B. (2013). Comparison of Readiness for Self-Directed Learning in Students Experiencing Two Different Curric- ula in One Medical School. Gulf Medical Journal, 2, 27-31.
[35]Asfar, N. and Zainuddin, Z. (2015). Secondary students’ perceptions of information, communication and technology (ICT) use in promoting self-directed learning in Malaysia [36]Kocaman, G., Dicle, A., Üstün, B. & Çimen, S. (2006). Kendi
kendine öğrenmeye hazıroluş ölçeği. Poster presented at the 3rd Active Education Congress in Turkey, Dokuz Eylül University, İzmir, Turkey.
[37]Guglielmino, L.M. & Guglielmino, P. J. (2005). Reliability & validity information. Learning Preference Assessment. Retrieved from www.lpasdlrs.com.
[38]Saeednia, Y. & Nor, M. (2008). Exploring Self-Directed Learnig among Children. World Academy of Science, Engineering and Technology, 2 (10), 462-467.
[39]Confessore, G.J. & Park, E. (2004). Factor validation of the learner autonomy profile (Version 3.0) and extraction of the short form, International Journal of Self-Directed Learning, 1
(1), 39-58.
[40]Brockett, R.G. & Hiemstra, R. (1991). Self-direction in adult learning: Perspectives on theory, research, and practice.
London and New York: Rout ledge, Retrieved from http://wwwdistance.syr.edu/sdlindex.html.
[41]Garcia, E. (2014). Increasing self-directed learning in the early grades. Partnership For 21st Century Learning, 1 (7), Retrieved from http://www.p21.org/news-events/p21blog/14 89-garcia-increasing-self-directed-learning-in-the-early-grad es
[42]Gibbons, M. (2004). Pardon me, didn't I just hear a paradigm shift, Retrieved from http://www.selfdirected learning. com/article3.html.
[43]Merriam, S.B. & Caffarella, R.S. (1991) Learning in adulthood: A comprehensive guide (2nd Ed.). Jossey- Bass, 1999.
[44]Schöning, M. (2015). Children in charge: self-directed learning programs. Edutopia: What Works in Education.
Retrieved from http://www.edutopia.org/blog/children-in-ch arge-self-directed-learning-mirjam-schoning.
of primary schools and students’ self-directed learning knowledge. International Education Journal, 5 (5), 166-177. [46]Zimmerman, B. J. (2002). Becoming a self-regulated learner: An overview. Theory into Practice, 41 (2), 64-72. http://www.jstor.org/stable/1477457
[47]Ministry of National Education (2005). İlköğretim 1.-5.sınıf
programları tanıtım kitapçığı, Retrieved from
http://iogm.meb.
gov.tr/files/io1-5sinifprogramlaritanitimkit.pdf.
[48]Senemoğlu, N. (2005). Gelişim, Öğrenme ve Öğretim. (12.baskı). Ankara: Gazi Kitabevi.
[49]Polat, S. (2010). İlköğretim beşinci sınıfta fen ve teknoloji dersinde üstbiliş stratejilerine dayalı öğretim uygulamasının öğrenci erişilerine etkisi, (Master’s thesis, Selçuk Universtiy, Institute of Social Sciences, Konya, Turkey).
[50]Carpenter, J. (2011). Self-direction in the online and face-to-face classroom: a new look at Grow’s staged self-directed learning model ((Doctoral dissertation, Northern Illinois University), Available from ProOuest Dissertations and Theses database
[51]Grow, G. (1991). The staged-self-directed learning.
Self-directed learning: Consensus & Conflict. 199-226. [52]Guglielmino, M. L. (2008). Why self-directed learning?.
International Journal Of Self-Directed Learning, 5 (1), 1-14. [53]Faisal, M. ve Eng, N. L. (2009). The effect of self-directed
learning tasks on attitude towards science. 35th Annual Conference Assessment For A Creative World, 13-18/9/2009, Brisbane, Australia. 22.10.2013 tarihinde
http://www.iaea.info/documents/paper 4d5282bb.pdf sitesinden erişilmiştir.
[54]Mok, M. M., Leung, S. ve Shan, P. W. (2005). A comparative study of the self-directed learning of primary students in Hong Kong and Macau, International Journal of Self-directed Learning, 2 (2), 39-54.
[55]Schwartz, J. (2006). Self-directed learning and student attitudes, The journal of unschooling and alternative learning. 1 (2), 23-52.
[56]Van Deur, P. (2004). Gifted primary students’ knowledge of self-directed learning. International Education Journal, 4 (4), 64-74
[57]Birenbaum, M. (2010). Assessing self-directed active learning in primary schools. Assessment in Education: Principles, Policy & Practice, 9 (1), 119-138.
[58]Lau, W. (2007). Redesigning pedagogy conference: culture, knowledge and understanding. 28-30 Mayıs 2007, Singapur.
Retrieved from
http://conference.nie.edu.sg/2007/paper/papers/INO373.pdf [59]Sellars, M. (2006). The role of intrapersonal intelligence in
self-directed learning. Issues in Educational Research. 16 (1), 95-119.
[60]Yıldırım, A. & Şimşek, H. (2008). Sosyal bilimlerde nitel araştırma yöntemleri. Ankara: Seçkin Yayıncılık.
[61]Nunnally, J. (1978). Psychometric Theory (Second edition). New York: McGraw HilL.
[62]Gorsuch, R. L. (1983). Factor analysis (2.baskı). Hillsdale, NJ: Erlbaum.
[63]Çolakoğlu, Ö. & Büyükekşi, C.(2014). Evaluation of factor effecting exploratory factor analysis process, Karaelmas Journal of Educational Sciences, 2, 58-64.
[64]Kline, P. (1994). An easy guide to factor analysis. New York: Routledge.
[65]Çokluk, Ö., Şekercioğlu, G. & Büyüköztürk, Ş. (2012). Sosyal bilimler için çok değişkenli istatistik: SPSS ve LISREL uygulamaları. (2nd ed.). Ankara: Pegem A Yayıncılık. [66]Marsh, W.H. & Hau, T.K., (1999). Confirmatory modeling in
organizational behavior human resource management: Issues and applications. Journal of Management, 6(2), 337-360. [67]Sapnas, K. G. & Zeller, R. A. (2002). Minimizing sample size
when using exploratory factor analysis for measurement.
Journal of Nursing Measurement, 10,135-154.
[68]Brown, A.T., (2006). Confirmatory factor analysis: for applied research. New York: The Guilford Press.
[69]Stevens, J. (1996). Applied multivariate statistics for the social sciences (3rd ed.). Mahwah, New Jersey: Lawrence Erlbaum. [70]Pallant, J. (2005). SPSS Survival Manual. Second edition. New
York: Open University Press.
[71]Horn, J.L. (1965). A rationale and test for the number of factors in factor analysis. Psychometrika, 30(2): 179-185. [72]O’Connor, B. P. (2000). SPSS and SAS programs for
determining the number of components using parallel analysis and Velicer’s MAP test. Behavior Research Methods, Instruments & Computers, 32, 396-402.
[73]Piccone, A.V. (2009). A comparison of three computational procedures for solving the number of factors problem in exploratory factor analysis. Published Doctor of Philosophy dissertation. University of Northern Colorado.
[74]Büyüköztürk, Ş. (2010). Sosyal Bilimler için Veri Analizi El Kitabı. 12. Baskı. Ankara: Pegem Akademi Yayıncılık. [75]Coombs, W. & Schroeder, H. (1988). An Analysis of Factor
Analytic Data., Personality and Individual Differences, 9, 79–85.
[76]Vanderstoep, S. W. & Pintrich, P. R. (2003). Learning to learn: the skill and will of college success. Upper Saddle River, N.J: Prentice Hall.
[77]Erdoğan, Y., Bayram, S. ve Deniz, L. (2008). Web tabanlı öğretim tutum ölçeği: açıklayıcı ve doğrulayıcı faktör analizi çalışması, Uluslararası İnsan Bilimleri Dergisi. 4(2), 121-145.
[78]Jöreskog, K. G. & Sörbom, D. (1993). LISREL 8: Structural equation modeling with the simplis command language. Lin-colnwood: Scientific Software International, Inc.
[79]Kline, R. B. (2005). Principles and practice of structural equation modelling. New York: Guilford Publications, Inc. [80]Schumacker, R. E. & Lomax, R. G. (1996). A beginner’s guide
to structural equation modeling. New Jersey: Lawrence Erlbaum Associates, Inc.