Evaluation of the Performance of Expanded
Immunization Programme Supply Chain and Logistics
Management in Southern Benin Rural Health District
V. Agueh
1, C. Sossa Jerome
1,*, D. Nyametso
2, M.N. Paraiso
1, C.S. Azandjemè
1,
C. Metonou
1, Laurent T. Ouédraogo
31Department of Health Promotion, Regional Institute of Public Health, University of Abomey-Calavi, Benin 2Department of Health Policies and Health System, Regional Institute of Public Health, University of Abomey-Calavi, Benin
3Department of Epidemiology and Biostatistics, Regional Institute of Public Health, University of Abomey-Calavi, Benin
Copyright©2016 by authors, all rights reserved. Authors agree that this article remains permanently open access under the terms of the Creative Commons Attribution License 4.0 International License
Abstract
The objective was to evaluate the performance of the expanded immunization programme’s (EPI) supply chain of and logistics management in Comé health district in 2015. This cross-sectional and evaluative study concerned the central deposit of vaccines and 19 health care centers randomly selected. Data on the performance of EIP supply chain of and logistics management were collected from 5 to 30 March 2015 using direct observation, document exploitation, questionnaire and individual interview in 20 health workers directly involved in EIP activities and 59 mothers of children aged 0-11 months. The performance of the supply chain and logistics management was assessed through three components “structure”, “process” and “results” using predetermined score of two scales seeking for achievement of criterions included in components. The overall performance of the EIP’s supply chain and logistics in the health district of Comé was rated fair (score = 75.2%). The performance level was good for “structure” (score = 90.3%), acceptable for the “process” (score = 79, 85%) and poor for the “results” of the management of supply chain and logistics (score = 59.48%). The level of performance EIP supply chain and logistics was sub-optimal. Adequate measures should be considered to improve the component “result” of the EIP supply chain and logistics management in the health district of Comé.Keywords
Evaluation, Supply Chain, Logistics, Expanded Immunization Programme, Performance, Health District, Benin1. Introduction
T
he Expanded Immunization Programme (EIP) is considered one of the great successes of public health ever recorded [1] According to WHO estimates, Immunizationprevents annually two to three million deaths [2-4]. Despite the successes, the EIP is facing difficulties; including threats to access to EIP services, supply chain and logistics management. WHO estimates that one in five children still do not receive the program's basic vaccines [1].With the introduction of new vaccines in developing countries, serious challenges emerged in the supply chain systems that threaten access to vaccines, the availability and the quality of vaccines. Hence there is a need for optimization and improvement of supply chain and logistics’ systems in these countries [5].
Successful immunization programmes are built on functional end-to-end supply chain and logistics systems. The role of the supply chain is to ensure effective vaccine storage, handling, and stock management, rigorous temperature control in the cold chain, maintenance of adequate logistics and information system management [3].
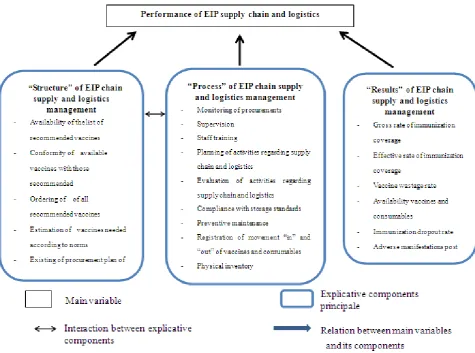
Figure 1. Conceptual Frame work of evaluation Performance of EIP chain supply and logistics in Come health district in 2015
2. Materials and Methods
2.1. Setting
The study was carried out in Comè health district located in the southwest of Benin, 90 km from Cotonou, the economic capital. Comè health district covers an area of 1,120 km² including four communes: Comé, Bopa, Houeyogbé and Grand-popo. Its population was estimated at 326 112 habitants in 2011 including 18% of child under five years. The annual growth rate of population is 3.25%. EPI supply chain and logistics are used in central deposit of vaccines and in 37 public health centers including 33 first line district health centres and four health centers of commune. In the health district vaccinations activities are mainly executed by non-skilled health workers.
2.2. Study Design
This was cross-sectional and evaluative study conducted from 5 to 30 March 2015 in the central deposit of vaccines and in 19 health centers in the health district of Comé.
2.3. Study Population
The study population and material included EIP chain supply and logistics, health workers involved in
immunization activities in health centers and mothers of children aged 0-11 months who brought their children to the vaccination during the study period.
2.4. Criteria for Inclusion and Non-inclusion
Public health facilities in the health area considered in this study are those which delivered immunization service. Private health facilities in the health district and anyone among the study population that refuses to participate in the study were not included.
2.5. Sampling Methods and Techniques
Simple random sampling technique was used to select half of health facilities (20/38) including 17/33 first line health centers, 2/4 health centers of commune and 1/1 central deposit of vaccine. The non-probabilistic method (reasoned choice) was used to select one health workers (per health center) directly involved in immunization activities and the logistician of the central deposit of vaccine. Mothers of children aged 0-11 months were selected by convenience as they came to health center to immunize their infants.
2.6. Study Variables
EPI supply chain and logistics in Comé health district. This main variable was explained by three components which were: the “structure” which referred to selection and procurement of vaccines and availability of required resources, the “process” which included vaccine stock management, client services, supply chain and logistics’ management and “results” that referred to immunization coverage rate, vaccine wastage and client satisfaction (figure 1).
2.7. Measurement and Appreciation of the Performance
We used criterions of the EIP guidelines datasheets of Benin and WHO standards for vaccine management and supply chain of vaccine storage that we have adapted to assign a score to the criterions included in components "structure" and "process" [8-10]. The appreciation of the level of adequacy of the component "results" was made in relation to national targets set by the 2014-2018 multi-year plan of complete vaccination in Benin [11]. The year 2014 was considered for the assessment of the availability of vaccines, crud immunization coverage, effective immunization coverage, dropout rates, rates of adverse manifestation post immunization (AMPI) and vaccine wastage.
The three explicative components were operationalized through assigning a score to each criterion of the components (figure 1). A two scales score was used. The score "1" was assigned if the criterion was met and "0" if the criterion was not met. The sum of the scores of different criterions determined the total score for the explicative component. The appreciation of the components was made according to Varkevissier: appreciation “good” (score greater than 80% of the highest possible score), “fair or acceptable” (score between 60 and 80% of the highest possible score), and poor (score below 60% the maximum score) [12].
The performance of the EIP supply chain of vaccine storage in each surveyed structure was obtained by summing the scores for all three components. In the same respect, the performance of the EIP supply chain and logistics in Comé health district was obtained by summing the scores obtained at the all selected health centers and at the central deposit of vaccines.
Some elements are subdivided due to their complexity or importance in the supply chain.
In the "structure" component:
Conformity of vaccines with a list of recommended vaccines includes compliance of available vaccines and compliance of ordered vaccines.
Availability of material resources includes the availability of a functional fridge, a functional freezer, isothermal box, ice packs, auto disjoint syringes, safety boxes, temperature monitoring
device and a transportation means. In the "process" component:
Storage of vaccines according to the standards includes temperature range, disposition of vaccines, no expired vaccines, vaccine vial monitor (VVM) at stages 1 and 2, the use of temperature monitoring device, and the absence substances other than vaccines and immunization consumables in the refrigerator.
Vaccination activities are carried out in two strategies: fixed (in health centre) and outreached (in community),
Realization of preventive maintenance includes the twice-daily monitoring of the refrigerator temperature and the absence of frost more than 10 mm on the freezer of the refrigerator.
In the "results" component:
Crude coverage concerns seven antigens in the following doses: BCG (against tuberculosis), OPV-3 (against poliomyelitis), pentavalent-3 PCV13-3 (against diphtheria, measles, pertussis, polio, tetanus), TT2 (against tetanus) and more, VAR (against measles) and VAA (against yellow fever)
Vaccine wastage involved seven antigens which are BCG (against tuberculosis), OPV-3 (against poliomyelitis), pentavalent-3 PCV13-3 (against diphtheria, measles, pertussis, polio, tetanus), TT2 (against tetanus) and more, VAR (against measles) and VAA (against yellow fever)
Customer satisfaction includes satisfaction regarding three items: the welcome, the waiting time and hours of service delivery.
Since the central deposit of vaccine does not execute field vaccination activities, assessment of the implementation of the open vial policy, immunization activities, crude immunization coverage, effective immunization coverage , rates of AMPI, the immunization dropout rates, and appreciation external clients satisfaction do not apply at that level.
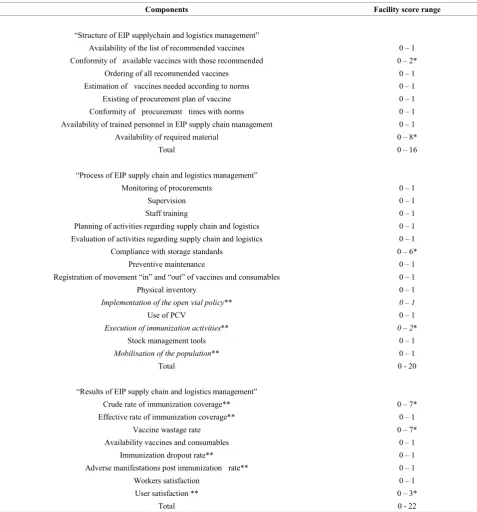
Then, in health centers, the total score ranges from 0 to 16 for component "structure", 0 to 20 for the component "process" and 0 to 22 for the "results". At the central deposit of vaccines, the total score is ranges from 0 to16 for the component "structure", 0 to 17 for the component “process” and 0 to 9 for the component “results” (table 1).
Table 1. Showing score used in the study
Components Facility score range
“Structure of EIP supplychain and logistics management”
Availability of the list of recommended vaccines 0 – 1
Conformity of available vaccines with those recommended 0 – 2*
Ordering of all recommended vaccines 0 – 1
Estimation of vaccines needed according to norms 0 – 1
Existing of procurement plan of vaccine 0 – 1
Conformity of procurement times with norms 0 – 1
Availability of trained personnel in EIP supply chain management 0 – 1
Availability of required material 0 – 8*
Total 0 – 16
“Process of EIP supply chain and logistics management”
Monitoring of procurements 0 – 1
Supervision 0 – 1
Staff training 0 – 1
Planning of activities regarding supply chain and logistics 0 – 1
Evaluation of activities regarding supply chain and logistics 0 – 1
Compliance with storage standards 0 – 6*
Preventive maintenance 0 – 1
Registration of movement “in” and “out” of vaccines and consumables 0 – 1
Physical inventory 0 – 1
Implementation of the open vial policy** 0 – 1
Use of PCV 0 – 1
Execution of immunization activities** 0 – 2*
Stock management tools 0 – 1
Mobilisation of the population** 0 – 1
Total 0 - 20
“Results of EIP supply chain and logistics management”
Crude rate of immunization coverage** 0 – 7*
Effective rate of immunization coverage** 0 – 1
Vaccine wastage rate 0 – 7*
Availability vaccines and consumables 0 – 1
Immunization dropout rate** 0 – 1
Adverse manifestations post immunization rate** 0 – 1
Workers satisfaction 0 – 1
User satisfaction ** 0 – 3*
Total 0 - 22
*Some elements are subdivided due to their complexity or importance in the supply chain. ** Not applicable at central deposit of vaccines
2.8. Data Collection Procedures
Questionnaires were used for data collection in workers directly involved in vaccination activities and mothers of children aged 0-11 months. Direct observation was used to check the maintenance and the functionality of the supply chain and logistics in the central deposit of vaccines of the health district. Data on vaccines stock management, vaccination indicators, were collected using existing periodic reports provided by health district coordinator and the statistician.
Questionnaires were pre-tested in other health district by checking the answerability and the appropriateness of questions. The result of the pre-test informed the investigator on the required adjustments in the questionnaire. The interviews for mother were conducted in the local language (Ouatchi) and in French by interviewers.
2.9. Data Analysis
were calculated as proportion of criterions met.
2.10. Ethical Considerations
The objectives of the study were explained to participants. Voluntary free and informed oral consent was obtained before starting the interview. This consent claims that participants are not at risk by refusing to participate in the survey or stopping their collaboration during the study. The confidentiality and anonymity of the information collected were ensured.
3. Results
3.1. Sample Description
Study participants included twenty (20) health facilities, nineteen (19) health workers involved in field vaccination
activities, one logistician of central deposit of vaccines and fifty-nine (59) mothers of children aged 0-11 months who brought their children to vaccination during the study period. Study material included the central deposit of vaccines in the health district, EIP supplies and logistics of selected health facilities.
3.2. Characteristics of Participants
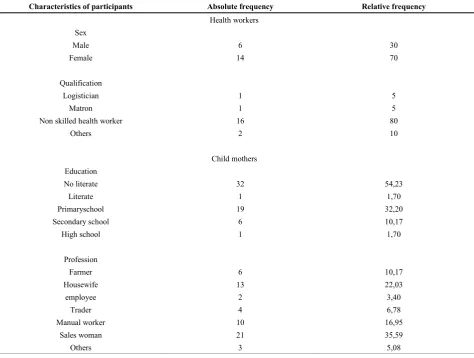
Socio-professional characteristics of workers directly involved in vaccination activitiesare summarized in table 2. Furthermore, the median age was 34.5 (26; 56) years. The median seniority at the service was 7.5 (2; 37) years.
[image:5.595.70.545.322.680.2]Demographic characteristics of mothers of children 0-11 months who brought their children for vaccination are described in table 2. Furthermore, the average age was 25.36 ± 5.0 years. The minimum and maximum ages were respectively 17 and 36 years.
Table 2. Characteristics of study participants 2015(n=20)
Characteristics of participants Absolute frequency Relative frequency
Health workers Sex
Male 6 30
Female 14 70
Qualification
Logistician 1 5
Matron 1 5
Non skilled health worker 16 80
Others 2 10
Child mothers Education
No literate 32 54,23
Literate 1 1,70
Primaryschool 19 32,20
Secondary school 6 10,17
High school 1 1,70
Profession
Farmer 6 10,17
Housewife 13 22,03
employee 2 3,40
Trader 4 6,78
Manual worker 10 16,95
Sales woman 21 35,59
3.3. Description of Components of the Performance of the EIP Supply Chain and Logistics
Description of the component “structure” of EIP supply and logistics management
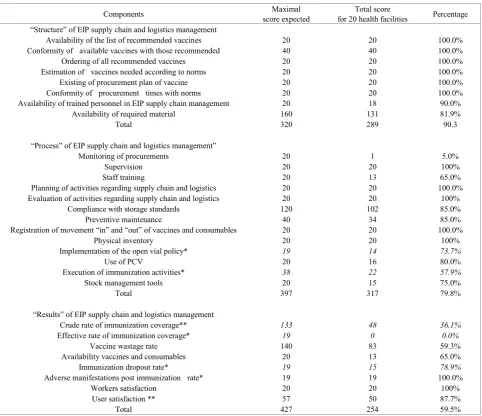
Table 3 describes facilities surveyed regarding the component “structure”. All facilities surveyed had a procurement plan, the majority (90%) had at least one staff trained in EIP supply chain and logistics management and had a fridge and (95%) had functional monitoring device. At contrast, few of them had a transportation means and functional freezer.
Description of the component “process” of EIP supply chain and logistics management
In table 3, the implementation of the open vial policy was effective in 73.68% (14/19) of workers directly involved in vaccination activities. In 13 facilities surveyed out of 20
[image:6.595.64.547.306.722.2](65%) including central deposit of vaccines, workers reported that they received training in EIP supply chain and logistics management. In all facilities surveyed, workers reported being supervised. In 80% (16/20) of the facilities surveyed, workers showed a correct interpretation of VVM. In health center, daily vaccination strategy in health center and outreach strategy in community were effective respectively in 15.79% (3/19) and 100% (19/19) of health centers workers. In the 19 health centers, vaccines and liquid for dilution were stored at a temperature between 2 and 8° C on the day of the survey in 17 centers (89.47%), the VVM on bottles were at stage 1 or 2 in 19 (100%) of health centers, a temperature monitoring device was placed in the refrigerator in 18 (94.74%) centers, the recommended standards of vaccines storage were met in 15 (78.95%) centers and effectiveness of twice-daily temperature monitoring of refrigerators was noted in 17 centers (89.47%).
Table 3. Components ‘score for assessment of performance of EIP supply chain and logistics management
Components score expected Maximal for 20 health facilities Total score Percentage “Structure” of EIP supply chain and logistics management
Availability of the list of recommended vaccines 20 20 100.0%
Conformity of available vaccines with those recommended 40 40 100.0%
Ordering of all recommended vaccines 20 20 100.0%
Estimation of vaccines needed according to norms 20 20 100.0%
Existing of procurement plan of vaccine 20 20 100.0%
Conformity of procurement times with norms 20 20 100.0%
Availability of trained personnel in EIP supply chain management 20 18 90.0%
Availability of required material 160 131 81.9%
Total 320 289 90.3
“Process” of EIP supply chain and logistics management”
Monitoring of procurements 20 1 5.0%
Supervision 20 20 100%
Staff training 20 13 65.0%
Planning of activities regarding supply chain and logistics 20 20 100.0%
Evaluation of activities regarding supply chain and logistics 20 20 100%
Compliance with storage standards 120 102 85.0%
Preventive maintenance 40 34 85.0%
Registration of movement “in” and “out” of vaccines and consumables 20 20 100.0%
Physical inventory 20 20 100%
Implementation of the open vial policy* 19 14 73.7%
Use of PCV 20 16 80.0%
Execution of immunization activities* 38 22 57.9%
Stock management tools 20 15 75.0%
Total 397 317 79.8%
“Results” of EIP supply chain and logistics management
Crude rate of immunization coverage** 133 48 36.1%
Effective rate of immunization coverage* 19 0 0.0%
Vaccine wastage rate 140 83 59.3%
Availability vaccines and consumables 20 13 65.0%
Immunization dropout rate* 19 15 78.9%
Adverse manifestations post immunization rate* 19 19 100.0%
Workers satisfaction 20 20 100%
User satisfaction ** 57 50 87.7%
Description of the component ‘results’ of EIP supply chain and logistics management
Table 3 shows the distribution of the surveyed facilities according to the national objectives for 2014 EPI indicators. The goals in 2014 for the availability of vaccines in the second half (100%) was achieved by the central deposit of vaccines. Vaccines and consumables availability in the 20 facilities surveyed ranged from 83 to 100%.
3.4. Internal and External Customers’ Satisfaction
Table 3 shows that 100% (20/20) of the workers were satisfied. Of 59 mothers of children 0-11 months who brought their children to vaccination, 96.61% (57) were satisfied with the welcome, 93.22% (55) for waiting time and 91.53% (54) for immunization services’ opening hours.
3.5. Appreciation of the Components of Performance of EIP Supply Chain and Logistics Management
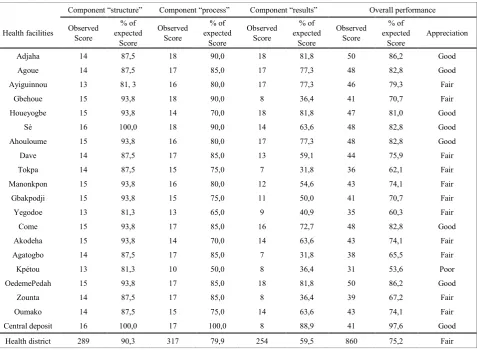
Table 4 shows the distribution of facilities surveyed according to the level of performance achieved regarding the “structure”, the “process” and the “results” of the EIP supply chain and logistics management. At the central deposit of vaccines, the score was good for the “structure” (score = 100%), “process” (score = 100%) and the “results” (score = 88.9 %). In health centers the overall score obtained was good for the “structure” (score = 90.3%), fair for the “process” (score = 79.9%) and poor for the “results” (score = 59.5%).
3.6. Determination the Overall Performance of the EIP Supply Chain and Logistics Management
[image:7.595.68.546.341.691.2]In table 4, the overall performance of the EIP supply chain and logistics management in the health district was good for 45% (9/20) of facilities (8 health centers and the central deposit of vaccines), acceptable for 55% (9/20) facilities and poor in 10% (2/20) of the facilities surveyed. The overall performance level of the EIP supply chain and logistics was fair for the health district (score = 75.2%).
Table 4. Score of components ‘score and performance of EIP supply chain and logistics management according to health facilities
Component “structure” Component “process” Component “results” Overall performance
Health facilities Observed Score expected % of Score
Observed Score
% of expected
Score
Observed Score
% of expected
Score
Observed Score
% of expected
Score Appreciation
Adjaha 14 87,5 18 90,0 18 81,8 50 86,2 Good
Agoue 14 87,5 17 85,0 17 77,3 48 82,8 Good
Ayiguinnou 13 81, 3 16 80,0 17 77,3 46 79,3 Fair
Gbehoue 15 93,8 18 90,0 8 36,4 41 70,7 Fair
Houeyogbe 15 93,8 14 70,0 18 81,8 47 81,0 Good
Sè 16 100,0 18 90,0 14 63,6 48 82,8 Good
Ahouloume 15 93,8 16 80,0 17 77,3 48 82,8 Good
Dave 14 87,5 17 85,0 13 59,1 44 75,9 Fair
Tokpa 14 87,5 15 75,0 7 31,8 36 62,1 Fair
Manonkpon 15 93,8 16 80,0 12 54,6 43 74,1 Fair
Gbakpodji 15 93,8 15 75,0 11 50,0 41 70,7 Fair
Yegodoe 13 81,3 13 65,0 9 40,9 35 60,3 Fair
Come 15 93,8 17 85,0 16 72,7 48 82,8 Good
Akodeha 15 93,8 14 70,0 14 63,6 43 74,1 Fair
Agatogbo 14 87,5 17 85,0 7 31,8 38 65,5 Fair
Kpétou 13 81,3 10 50,0 8 36,4 31 53,6 Poor
OedemePedah 15 93,8 17 85,0 18 81,8 50 86,2 Good
Zounta 14 87,5 17 85,0 8 36,4 39 67,2 Fair
Oumako 14 87,5 15 75,0 14 63,6 43 74,1 Fair
Central deposit 16 100,0 17 100,0 8 88,9 41 97,6 Good
4. Discussion
The study evaluated the performance of EIP supply chain and logistics management in the health district of Comé in Benin through three components namely “structure”, “process” and “results” using predetermined score at two scales according to criterions of the guidelines data sheets for EIP of Benin, the national targets set by the 2014-2018 multi-year plan of complete vaccination in Benin and WHO standards for vaccine and supply chain management. The study found that the level of performance of the supply chain EPI was not in satisfactory.
4.1. Availability of Material Resources
In the study, almost all facilities surveyed had at least one functional refrigerator. This rate is higher than those found by Tatoa in Togo in 2011 and Ateudjieu et al. in Cameroon in 2008 [13, 14]. Indeed, Tatoa had found during a cross-sectional study in 15 health facilities which implemented immunization activities in the health district of Binah in 2011 as part of the evaluation of the supply chain and quality of storage of vaccines, a proportion of 60% of health facilities with at least one functional refrigerator [13]. According to the results of the cross-sectional study in 40 health facilities in eight (8) health districts in Cameroon by Ateudjieu et al., 70.0% of health facilities had at least one functional refrigerator for EPI activities [14].The context of the health zone of Comé identified as a demonstration site with technical and financial support from 2012 to 2014 may explain this high rate of availability of functional refrigerator. The method and sampling technique used in our study (simple random probability for health centers) could also partly explain this difference. Tatoa had used a comprehensive non-probability sampling for the selection of health facilities surveyed [13]. In the study conducted by Ateudjieu et al., 40 health facilities were selected by random sampling in eight (8) districts with the lowest performance for immunization with the anti-tetanus vaccine (VAT 2 or more) in pregnant women during the first half of 2008 [14].
4.2. Preventive Maintenance of the Supply Chain and Logistics
The twice-daily temperature monitoring was performed in 89.47% (17/19) of health facilities with functional refrigerator. The absence of frost over 10 millimeters height in the refrigerator was noted in 84.21% of these facilities. That means that vaccines have been exposed to freezing in 15.79% facilities. The twice-daily temperature monitoring is not effective in all health facilities. In the study by Tatoa in health facilities in the district of Binah in Togo in 2011, 33% of health facilities with functional refrigerator did not record the temperature every day and vaccines were exposed to frost in 11% health facilities [13]. In the present study, proportion of facilities which record twice dailytemperatureis higher compared to those found in the
study by Tatoa in the health district of Binah in Togo. This could be justified by the frequency of supervision and evaluation in all health facilities surveyed.
4.3. Implementation of the Open Vial Policy
The implementation of the open vial policy was effective in almost three out of four surveyed health centers. This proportion is lower than those prior reported by Sidibé (100%) by a cross-sectional study and evaluative study on vaccine management in eight (8) health centers in the Comè health district in 2006 [15]. The higher proportion of trained workers on EPI logistics reported by Sidibé (90%) compared to (65%) in the present study could explain this difference. Indeed, the performance regarding wastage rate of antigens is low (59.3%) in concordance with the fair implementation of open vial policy.
4.4. Availability of Vaccines and Consumables
The availability of vaccine found in the study was low than those reported in the evaluation of the Optimize Project in Senegal in 2013. Optimize Project is a demonstration project of integration of supply systems of vaccines and consumables and other drugs and the establishment of a mobile warehouse. The evaluation of this project had found the availability for all antigens less than 50% in the health districts [16]. This difference can be explained by the centralization of vaccines at the regional depot and the largest number of health centers served by the mobile warehouse of the Medical Region St Louis (110 health centers) compared with the health district of Comè with only 37 health centers.The centralization of vaccines and consumables in the health district and the establishment of a mobile warehouse for distribution at health centers could contribute in improving vaccine availability. Studies conducted by Brown et al. in Benin in 2014 and Assi in Niger through the HERMES tool (Highly Extensible Resource Modeling for Supply Chains) showed that the scenario in which the central deposit of the health zone distributes vaccines directly to health centers has been most beneficial in terms of logistics costs and availability of vaccines [17, 18].
4.5. Immunization Coverage
in Benin in 2008 pointed out the lack of availability of immunization services as one of the main reasons for non-vaccination or incomplete vaccination in children [6].
The limitations of this study concern the geographic scope limited to a pilot heath district. Further, some recommendations of EIP guidelines datasheets of Benin and WHO standards for vaccine management and supply chain were equally weighted when assessing components while it is possible that recommendations did not have exactly the same effect the performance. But all elements appreciated and the scoring scheme used was validated by college of experts including (formers national directors of EIP, responsible of EIP logistic supplies and current academic teachers in immunization system). However, the study shows interest results for improvement of the quality of EPI supply chain and logistics in Benin rural health districts.
5. Conclusions
The performance of the EPI logistics chain in the health zone of Comè is sub-optimal. Efforts are needed for supply chain management, physical inventory management, training providers and implementation of immunization activities to improve the performance of EPI supply chain and logistics management and the subsequent the effective immunization of children in the health district of Comè.
Acknowledgements
We are very grateful to participants in the study.
Funding
None
Conflict of interest
The authors declare no conflict of interest.
REFERENCES
[1] OMS. Le programme de vaccination qui a sauvé des millions de vies. Bulletin de l’Organisation mondiale de la Santé 2014 ;92 :314-315. Available on URL :http ://www.who.int Accessed on 08/02/2015].
[2] OMS. La vaccination dans le monde : vision et stratégie. Rapport du Secrétariat.Organisation Mondiale de la Santé 2010.
[3] OMS. Plan d’action mondial pour les vaccins 2011-2020. Organisation Mondiale de la Santé, 2013, Genève.
[4] OMS. Rapport d’évaluation du Plan d’action pour les vaccins. Organisation Mondiale de la Santé 2014, Genève.
[5] M.I. Zaffran, J. Vandelaer; D. Kristensen, B. Melgaard, P.Yadav, K.O. Antwi-Agyei, H. Lasher. The imperative for stronger vaccine supply and logistics systems. Vaccine 2013; 18: 31, Suppl 2: B73–80.
[6] Ministère de la Santé. Rapport de la Revue externe 2008 du Programme Elargi de Vaccination 2009, Cotonou.
[7] Ministère de la Santé. Rapport de l’atelier d’optimisation de la chaine logistique des vaccins du PEV au Bénin 2012, Cotonou.
[8] Ministère de la Santé. Fiches techniques du PEV 2007. Cotonou.
[9] OMS. Gestion des vaccins. Cours de formation en gestion des vaccins. Bloc III. Module 9, 2014, Genève.
[10]OMS (2004). Gestion de la chaîne du froid. Cours de formation en gestion des cadres Niveau intermédiaire. Module 8, 2004, OMS, Bureau régional de l’Afrique.Genève. [11]Ministère de la Santé. Agence Nationale pour la vaccination et les soins de Santé Primaires: Plan pluriannuel complet de vaccination 2014-2018, 2013, Cotonou.
[12]C. Varkevissier, I. Pathmamanatan, A .Brownlee. Elaboration et mise en œuvre des programmes de recherche sur les systèmes de santé 1993, Vol 2, première partie : aspect des variables. Canada.
[13]K. Tatoa. Evaluation de la chaîne de froid et de la qualité de conservation des vaccins dans le District sanitaire de Binah en 2011, 2011, Mémoire DIU. Université Paris DAUPHINE. [14]J. Ateudjieu, B. Kenfack, .B.W. Nkontchou, M. Demanou.
Program on immunization and cold chain monitoring: the status in eight health districts in Cameroon. BMC Res Notes 2013: 6; 101.
[15]H. Sidibé. Evaluation de la gestion des vaccins dans la Commune de Comè au Bénin. Mémoire N°451/IRSP/06, 2006, Ouidah.
[16]Organisation mondiale de la Santé, PATH. Optimize: Rapport Sénégal. Seattle: PATH 2013, Dakar.
[17]S.T. Brown, B. Schreiber, B.E. Cakouros, A.R. Wateska, H.M. Dicko, D.L. Connor, P. Jaillard, M. Mvundura, B.A. Norman, C. Levin, J. Rajgopal, M. Avella, C. Lebrun, E. Claypool, P. Paul, B.Y. Lee. The benefits of 336th designing Benin’s vaccine supply chain. Vaccine 2014; 32:4097-103.
[18]T.M. Assi, Removing the regional level from the Niger vaccine supply chain. Vaccine 2014: 31(26) ;2