Essays on skills, management and productivity
Full text
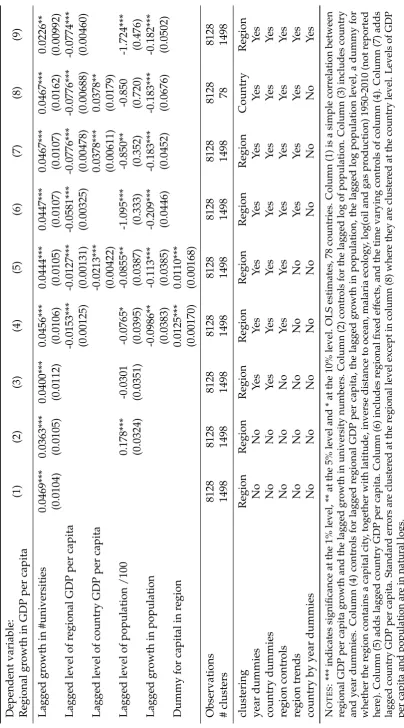
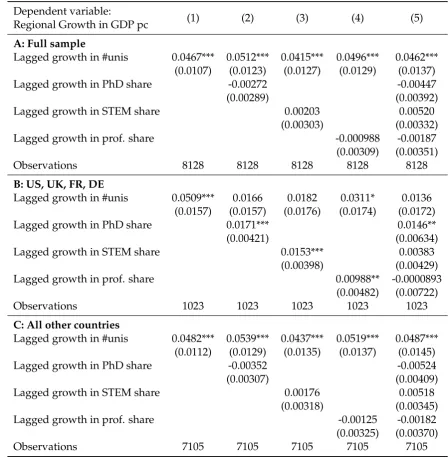
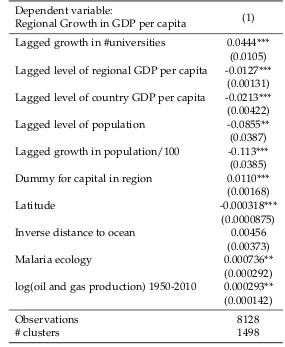
Figure
Related documents
Basic demographics of the respondents in this study indicate that Korean international students entering the Pharm.D program in average have spent 5.0 ± 2.8 years in the
The empirical result shows that this corruption news significantly affected the stock market, the t-value for both the 2 days and 5 days event window shows a significant and
(1) S TUDY .—The Secretary of Housing and Urban Development shall conduct a study to determine the impacts, on rents paid by el- derly and disabled individuals and families
Further, such data has been observed to exhibit effective low-rank, and has led to interest in the particular problem of low-rank matrix-completion: Given a partially-observed
This project evaluates a model of care that integrates evidence-based strategies into a person-centred interdisciplinary rehabilitation package: Interdisciplinary Home-bAsed
Cı´lem te´to pra´ce bylo prove´st resˇersˇi dostupny´ch aplikacı´ pro rozvoj kognitivnı´ch a mo- toricky´ch funkcı´ jedince a na za´kladeˇ zı´skany´ch poznatku˚ se
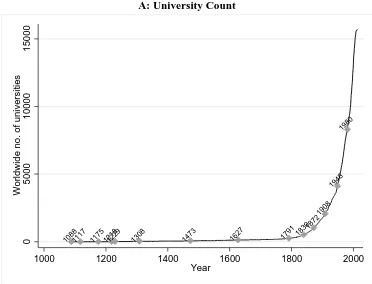
We emphasize the interaction between natural resources and human capital, as well as their effects on levels of income and rates of economic growth, in order to explain why
Specifically, the study was guided by two research questions focused on (a) the extent to which learning styles had a predictive relationship with student achievement in an
