'W'
CONCENTRATION AND DISTRIBUTIOl
IN URANIUM-PLUTONIUM MIXED OXIDE FUEL,]
AUTORADIOGRAPHY AND MICRODENSITOMETRY
w
$0
m
Mill·· » !
M
« Í A S
¡lliníy
I
»i
Joint Nuclear Research Centre
Karlsruhe Establishment - Germany
»III
Mlu) 'Ψ* "»ι iii· a ï* if» '■ " ' ί γ "Λ i Τ " "¡Ι " *f|-k· . mj' *■ i t\t ImtAJvw ' * f Γ14« ii
European Institute for Transuranium Elements
" " r a t a . ?
t:¡wx:
liii|ral«HBw
il Iti ¡«K!»!«»
IliÉiÏŒ
il
■ tiWiÉip "ais'"
m
, * J i f f Í l ^ ^
NOTTC i ™ ' '
This document was prepared under the sponsorship of the Commission
g j g of the European Conciti.,
' P ^ B K | ^ m S |
tiililf
LEGAL N 0 T I C E
lie
iiiÄelÉIiiifliilÉii
Neither the Commission of the European Communities, its contractors nor any person acting on their behalf :
make any warranty or representation, express or implied, with respect to the accuracy, completeness, or usefulness of t h e information contained in this document, or t h a t the use of any information, apparatus, method or process disclosed in this
rights; or
atm
— _ — _ _ j „ „ „ „ — » „ „ , „ . ^ ^ „ ^ „ . „ ^ ^ , ™ ^ „ . „ ^
D E T E R M I N A T I O N O F PLUTONIUM CONCENTRATION AND DIS T R I B U T I O N IN URANIUM-PLUTONIUM M I X E D O X I D E F U E L BY AUTORADIOGRAPHY AND MICRODENSITOMETRY by C. SARI Commission of the European Communities
Joint Nuclear Research Centre - Karlsruhe Establishment (Germany) European Institute for Transuranium Elements
Luxembourg, October 1971 - 28 Pages - 14 Figures - B.Fr. 40.—
The plutonium concentration and the homogeneity of the uranium-plutonium oxides, carbides and nitrides has been determined by microdensitometric analysis of autoradiographs of the examined radioactive material. The method is based on the fact t h a t the blackening of a film is proportional to the con centration of the radiation emitted from the material. Correct measurements require the use of a reference material and standard curves which are independent of parameters such as exposure time of the film to the α radiations, the devel opment time, inhomogeneities of the film and errors caused by wrong utilization of the microdensitometer.
EUR 4733 e
D E T E R M I N A T I O N OF PLUTONIUM CONCENTRATION AND DIS T R I B U T I O N IN URANIUM-PLUTONIUM M I X E D O X I D E F U E L BY AUTORADIOGRAPHY AND MICRODENSITOMETRY by C. SARI Commission of the European Communities
Joint Nuclear Research Centre - Karlsruhe Establishment (Germany) European Institute for Transuranium Elements
Luxembourg, October 1971 - 28 Pages - 14 Figures - B.Fr. 40.—
The plutonium concentration of less than 50 % in the solid can be determined with a precision of about 10 % and with about 5 % for higher concentrations. The microdensitometric measurements can be performed with an accuracy of ± 0.25 %. The aperture of the apparatus varies from a few μ2 to a few mm2.
The method allows the concentration determination of any material emitting radiation.
The dimensions of segregated particles emitting radiation and their distances can also be determined.
Examples of analysis performed on oxides, carbides and nitrides are reported.
The plutonium concentration of less than 50 % in the solid can be determined with a precision of about 10 % and with about 5 % for higher concentrations. The microdensitometric measurements can be performed with an accuracy of ± 0.25 %. The aperture of the apparatus varies from a few μ* to a few mm2.
The method allows the concentration determination of any material emitting radiation.
The dimensions of segregated particles emitting radiation and their distances can also be determined.
Examples of analysis performed on oxides, carbides and nitrides are reported.
The plutonium concentration of less than 50 % in the solid can be determined with a precision of about 10 % and with about 5 % for higher concentrations. The microdensitometric measurements can be performed with an accuracy of ± 0.25 %. The aperture of the apparatus varies from a few «a to a few mm2.
The method allows the concentration determination of any material emitting radiation.
The dimensions of segregated particles emitting radiation and their distances can also be determined.
E U R 4 7 3 3 e
COMMISSION OF THE EUROPEAN COMMUNITIES
DETERMINATION OF PLUTONIUM
CONCENTRATION AND DISTRIBUTION
IN URANIUM-PLUTONIUM MIXED OXIDE FUEL BY
AUTORADIOGRAPHY AND MICRODENSITOMETRY
by
C. SARI
1971
Joint Nuclear Research Centre Karlsruhe Establishment - Germany
A B S T R A C T
The plutonium concentration and the homogeneity of the uranium-plutonium oxides, carbides and nitrides has been determined by microdensitometric analysis of autoradiographs of the examined radioactive material. The method is based on the fact t h a t the blackening of a film is proportional to the con centration of the radiation emitted from the material. Correct measurements require the use of a reference material and standard curves which are independent of parameters such as exposure time of the film to the α radiations, the devel opment time, inhomogeneities of the film and errors caused by wrong utilization of the microdensitometer.
The plutonium concentration of less than 50 % in the solid can be determined with a precision of about 10 % and with about 5 % for higher concentrations. The microdensitometric measurements can be performed with an accuracy of ± 0.25 %. The aperture of the apparatus varies from a few μ2 to a few mm2.
The method allows the concentration determination of any material emitting radiation.
The dimensions of segregated particles emitting radiation and their distances can also be determined.
Examples of analysis performed on oxides, carbides and nitrides are reported.
KEYWORDS
QUANTITATIVE ANALYSIS URANIUM OXIDES PLUTONIUM URANIUM NITRIDES PLUTONIUM ISOTOPES URANIUM CARBIDES
PLUTONIUM OXIDES DENSITOMETERS PLUTONIUM NITRIDES URANIUM COMPOUNDS
PLUTONIUM CARBIDES RADIOAUTOGRAPHY PLUTONIUM COMPOUNDS RADIOISOTOPES
Introduction 5
1. Experimental 7
1.1. Autoradiograph}'· ¡7
1.2. Microdensitometry 7
2. Results 8
2.1 . Standard curves ,8
2.2. Determination of plutonium concentration 8
2.2.1. Plutonium concentration in solid solution 9
2.2.2. Plutonium concentration in mechanical mixture 9
2.2.3. Determination of concentration profiles 9
2.3. Evaluation of the dimensions of segrega Led
plutonium rich particles in a matrix and of
their distances
Summary *)
The plutonium concentration and the homogeneity of the
uraniumplutonium oxides, carbides and'nitrides has been
determined by microdensitometric analysis of autoradiographs
of the examined radioactive material. The method is based
on the fact that the blackening of a film is proportional
to the concentration of the radiation emitted from the
material. Correct measurements require the use of a
reference material and standard curves which are independent
of parameters such as exposure time of the film to the
α radiations, the development time, inhomogeneities of the
film and errors caused by wrong utilization of the micro
densitometer.
Plutonium concentrations of less than 50 % in the solid
can be determined with a precision of about 10 % and with
about 5 % for higher concentrations. The microdensi tome trió
me asuremerri; s can be performed with an accuracy of ψ 0.25 %.
The aperture of the apparatus can be varied fron; a few/a1 to
2
a few mm . The method allows the determination of the
concentration of any material emitting radiation.
The dimensions of segregated particles emitting radiation
and their distances can also be determined.
Examples of analysas performed on oxides, carbides and
nitrides are reported.
Introduction
The production of metallic, ceramic or metalceraiaic urani ν m
plutonium compounds is performed by fusion or sintering
processes. The sintering is essentially a heat treatment of
pellets obtained by pressing mixed uraniumplutonium
powders prepared by coprecipitation or by mechanical
mixture. If this material is used as a nuclear fuel it is
necessary, for security reasons (doppler effect, hot spots
etc.), to know the distribution of the plutonium in the
6
uranium matrix, and to determine the dimensions of the inho
mogeneities.
There are three different analysis methods available now:
αCOunting, Xray microanalysis, and auto
radiography. Though the first two methods provide rather
accurate measurements, they are not usually employed because
they are timeconsuming. The time required for a complete
scanning of a specimen would be at least a few days.
The autoradiography carried out with normal £~ 1_J7, or colour
¿f~2_7 or cellulose nitrate /~3_J7 films is up to now the
simplest and most useful method of analysis. It furnishes a
total topography of the plutonium distribution and allows
the identification of inhomogeneities and concentration
profiles in the matrix. The quantitative autoradiographic
determinations of materials emitting radiation were first
developed in the biological field. The measurements were
essentially based on the counting of radiation traces in the
photographic emulsion with the help of a light microscope.
This method was successfully employed later for the analysis
of nuclear material containing an amount of plutonium up to
a maximum of 0.8 % £~¿\J* Another and more suitable way of
quantitative autoradiographic analysis is based on photo
densitometric measurements of the photographic emulsion ex
posed to the radiations. The formula for the plutonium con
centration Cp is then:
Op % = á - ^ - S
C*J
were Te = exposure tiine, 2log Τ density of the autoradio
graph, γ = an optical constant. In this formula Cp ',i is
inaccui'cite and difficult to reproduce because of the errors
in the determination of γ, of Te and of the density.
The present investigation has been undertaken with che aim
to determine the plutonium concentration and redistribution
in plutonium bearing material using a comparative autoradio
microdensitometric method. This avoids the difficulties and
the errors related with the extremely sensitive conditions
1 . Experimental
1 .1_.._Au t or adi ogr ap_h.Y.
The specimens of uraniumplutonium samples (carbides,
nitrides, oxides) were mounted in a setting resin. A high
quality finish surface was obtained using suitably modified
metallographic techniques apt for the work with radioactive
material in ■ ·■· αtight glove boxes ¿f~6_7. In order to avoid
the contamination of the exposed film with radioactive
particles the specimens were completely decontaminated. This
operation, carried out in glove boxes, involved ultrasonic
cleaning and stripping of the sample surfaces with adhesive
tape in order to remove loose contamination. Then the
decontaminated specimen was transferred to'a non contaminated
glove box and mounted in a special container, with a low
meltingpoint (48 C) alloy, fig.1 . Pig.2 represents the
sequence of the mounting operations. The autoradiographs
were obtained by pressing nuclear track recording films on
the polished surface of the specimen. The exposure times were
between a few seconds and a few minutes. The α radiatici of
uranium compounds does not form an image with such short
exposure times, while that of plutonium compounds produces
well defined track lines.
A less boring and time consuming method was frequently, used
for routine analysis. It consisted of interposing a 6/u
thick sheet of Hostafan between the specimen surface and the
film. The device represented in fig.3 included a plastic
sack connected.to an αtight glove box, and was provided 2
with windows of 20 to 30 cm . These windows were closed by
sticking Hostafan sheets on to the plastic. From oirtside the
box the film was pressed against the specimen surface through
the Hostafan window. This operation took less than 30
minutes · ·
1^2_, Microdensitometry
The autoradiographs were quantitatively analysed with a Joyce
and Loebl automatic doublebeam recording microdensitometer.
- 8 2. Results and discussion
2.1. Standard curves
Seven specimens of uranium-plutonium mixed oxides with a
plutonium content of 5, 10, 15, 25, 45, 50 and 70 % have been mounted together in araldit in order to take an autoradio-graph for all specimens simultaneously. The exposure time varied between 10 and 90 seconds. The autoradiographs were
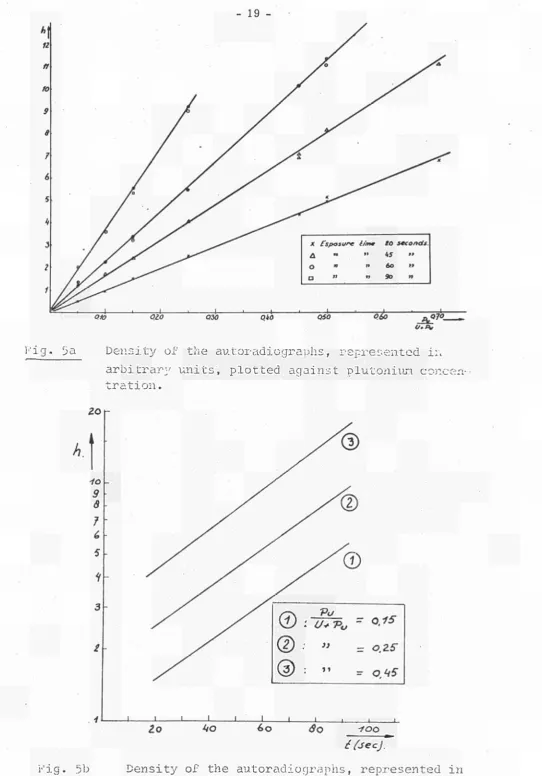
then analysed with the microdensitometer and the results are represented in fig.4. In fig. 5a and 5b the differences in density of the exposed and unexposed area of the photographic emulsion, represented in arbitrary units, are plotted against plutonium concentration and time. Fig. 5b shows that small variations of exposure time influence remarkably the
determination of the concentration. Moreover other errors caused by the variation of development time, the development solution, the quality of photographic emulsions etc. must also be taken into account. For these reasons it has been
considered necessary to use standard curves (fig.6) which are independent of the above mentioned parameters. In fig.6 h and ho are height differences between the lines of non exposed and exposed areas of the film; ho is always related to the reference material which must be examined simultaneous-ly with the unknown material. The h and ho values are
obtained from the graphs of fig.4: each composition is
considered in turn as a reference material. The use of these standard curves replaces the measurements of absolute
densities: the plutonium concentration of the analysed
specimen is determined by the curve of the reference material, fig.6 and by the ratio h-ho/ho obtained from the unknown and the standard composition.
£¿2i_2e£S£H!ií2aÍ:i2?-L.2 ''_BiHJ~2
niH!íL
22ΰ222£Ε^ΐί2ΰ
2.2.1 . Plutonium cone en tr a t ion of _ so 1 id_ _ sol} iti q ns
variation of the microdensitometric lines is proportional to
the variation of plutonium content. In the standard curves
of fig.6 the ratio hho/ho, calculated from the fig.7,
corresponds to a value Pu/|Ù+Pu)= 0.45 which represents the
plutonium concentration of the specimen f2Ì.
The same procedure was used for carbides and nitrides:
the ratios hho/ho calculated from the graphs of fig.8
correspond respectively to Pu/(u+Pu) = 0.28 and Pu/U+Pu) = 0.19.
2.2.2. Mean plutonium concentration of mechanical mixtures
The procedure of mechanical mixing of plutonium and uranium
oxides is at present the only economic v/ay to produce oxide '
fuel. It is therefore interesting to have a quick method of
analysis for the determination of the mean' plutonium concen
tration independent of the strong local variations.
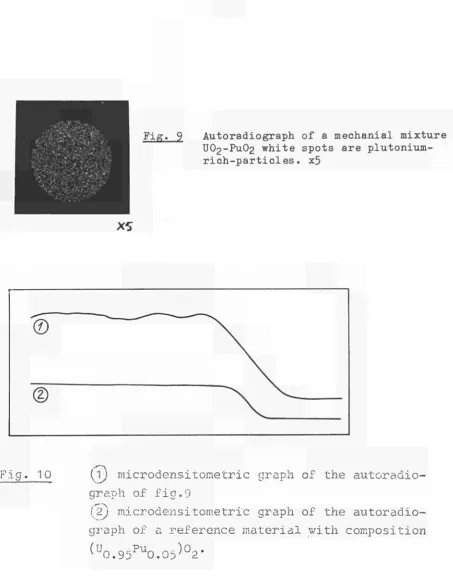
The autoradiograph of fig.9 gives a picture of the distri
bution of plutonium oxide particles in a uranium oxide
matrix. Each white spot in fig.9 represents roughly the
area of a plutoniumrich particle. The microdensitometric
determination of the mean plutonium concentration is
performed as explained in 2.2.1. The only difference is the
necessity to use a large aperture so that a sufficient number
of spots is always present in the aperture area. If the
dispersion of plutoniumrichparticles is homogeneous,
rather accurate concentration measurements can be performed,
otherwise (but this case is unusual) the results can be
represented by histograms. The plutonium concentration of
the specimen of fig.9 and 10 amounts to 15 %·
2.2.3. Determination of concentration profiles
The phenomena of diffusion or redistribution of material are
always connected with concentration profiles. If the
diffusing material is radioactive the autoradiographic and
microdensitometric techniques provide accurate measurements
in a very short time compared to the time required for
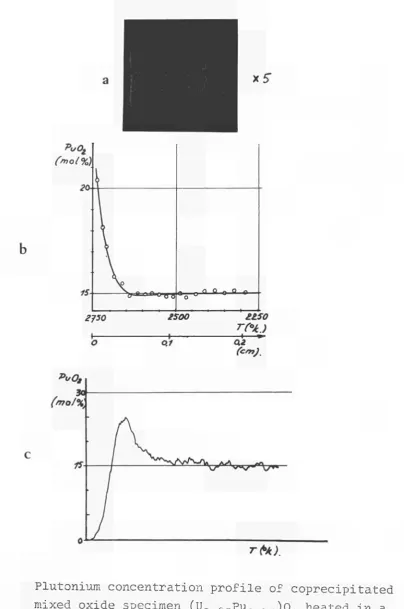
αcounting or Xray microanalysis procedures. In fig.11 and
11 bis the plutonium concentration profiles of specimens
10
plutonium redistribution occurred as a function of thermo
diffusion and preferential evaporation processes ¿f~7, 8_7*.
The trend of the curves obtained by autoradiomicrodensito
metry and by αcounting are comparable, and the values are
in good agreement. A striking difference is to be found in
the time necessary for the measurements. In addition even
if the window of the αcounter is relatively large (0.1 χ 1
mm) only 150 a/min. pass through and therefore an accurate
linear scanning of 1 cm of a surface requires about 90 hours.
The autoradiomicrodensitometric measurement of the same 1 cm
line takes less than 30 minutes. Moreover, the microdensito
meter has a smaller aperture width and therefore better
resolution.
Fig. 12 snows the plutonium concentration profile in' (U. of.
Pu„ 7 Ω) 0ο mixed oxide spheres prepared by solgel. The
growth of the particles occurred irregularly by superposition
of layers with different plutonium content.
il·5' · Evaluation of the dimensions of segregated plutonium
rich particles in a matrix and of their distances
Fig.13 represents the autoradiograph and the microdensito
metric graph of a specimen prepared by mechanical mixture of
(Ur. otP^n ic)0o spheres in a uranium oxide matrix. Micro
U. o5 O . I 5 ¿
densitometric scanning of the autoradiograph provides
information about the mean radius of the spheres and the mean
distance between the dispersed particles. The radius was
determined by the formula R = r25 where r is the half width
of the peaks measured on the microdensitometric graphs and
25 is the range, in AX, of the α radiations recorded in the ..
photographic emulsion /^~1 _J7. According to the assumption of
/fl_7» a n autoradiographic spot or a microdensitometric peak
should always have a diameter greater than 50 /u«
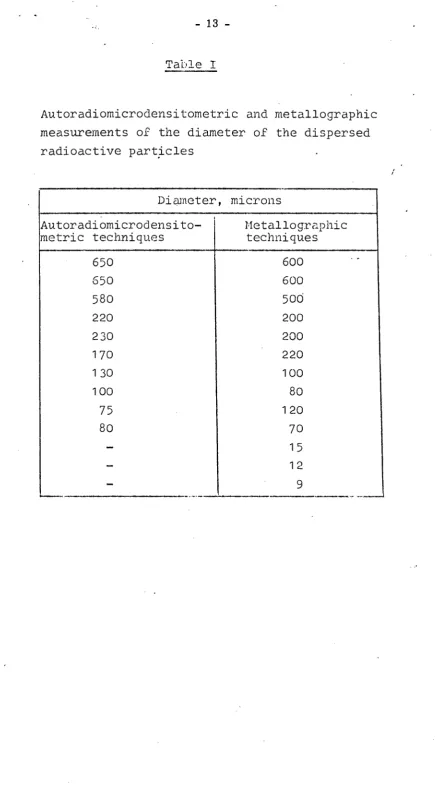
The data obtained from fig. 12 and 13 are.given in table I.
Fig.ld represents the autoradiograph, the micrograph and the
microdensitometric graph of an inhomogeneous solid solution.
The inhomogeneities still present in the matrix after a heat
treatment of A hours at 1650 C are caused by an imperfect
coprecipitation. The formula R = r25 cannot, in this case,
too small, too close to each other and interact. The value
for an αrange of 25/u </~1_7 is n°t realistic if the segre
gated particles are smaller than 10 microns. In this case
only the metallographic analysis is helpful for quantitative
determinations. Fig.14b represents the surface of an
inhomogeneous specimen: some segregated particles are iso
lated from the matrix by selective etching procedures ¿f~9_7·
The mean dimensions of the particles are measured with the
usual procedures of quantitative metallography (table ï ) .
The distance between two particles is determined by the
following formula L = 1 (R + R2) where 1 is the distance
between two peaks of the microdensitometric graphs, R. + R?
are the radii of the particles. The results of the measure
ments performed on specimens 12, 13 and 14 are given in
table II. If the radii of the segregated particles are
smaller than 10/u the values are incorrect for the reason
explained above.
3. Conclusion
It seems, according to our experiments, that the autoradio
microdensitometric method best suit the necessity of correct
and quick determination of plutonium concentration and
plutonium redistribution, especially with regard to the
fabrication processes. The use of standard curves makes the
measurements easy and the use of absolute density values is
avoided.
The reasons for using a comparative method are as follows:
the density limits depend on a number of condi tions such
as the optical magnification, the aperture width and area,
for a much smaller aperture the density limits are'extended,
if the optical magnification is reduced,
for a very small aperturewidth the density limit is lower
than for a relatively large one,
12
-few microns or if the density is greater than 2,7 D, the aperture width must be chosen carefully,
- density values are only accurate if the microdensitometric scanning is made under identical conditions.
The method can be used in any range of concentration.
The dimensions of the plutonium-rich-particles, dispersed in the matrix, are determined by using the geometry of the
sphere and assuming that a random assembly of these partie]es is cut by a plane section. The values are in general smaller than the true one's and the error increases with the decrease of the dimensions of the particles. If for instance the
Table I
14
-Table II
Autoradiometric and metallographic measurements of the distances between dispersed radioactive particles
Distances, microns
Autoradiomicrodensito-metric techniques
1400 350 230 200 150
-—
Metallographic techniques
[image:18.595.46.550.179.820.2]Ac know1ed g em en f s
The author wish to thank Dr.II.blank for his critisism and
Mr. J.Fi.net, N.Modery and V.Tebaldi for assistance with the
experimental work.
References
¿f~1__7 H.YAGODA, Radioactive measurements v/ith Nuclear
Emulsions, Wiley N.Y. 1949
¿f2_7 E.NAKOYIMA et al., Radioisotopes vol.17, No.9 (1968
¿~3_J
T.K.BIERLEIN, B.MASTEL, HU-56412 (1958)
/f4_7 M.R.H.HILL, C.E.MELLISH, J.Nucl.Mat. 1_6, 155 (1965)
¿f~5__7 S.KASHIMA et al, PNCPU-Report-027, Progress Report
Tokai Works (1967)
¿f"6_7 C.SARI et al., Praktische Metallographie, 5_,628(1968)
ClJ
M.BOBER et al., J.of Nucl.Mat., 39, 265 (1971)
¿f8__7 M.BOBER et al., J.of Nucl.Mat., to be published (1971)
16
-Θ©@
Fig. 1 Decontaminated plutonium compound to be handled out of glove box. (7) holder; (2) specimen;
Fig. 2 Mounting sequences of a decontaminated specimen,
a) holder, (Î) , covered with adhesive tape; (D the tape prevents contamination of the holder. The top of the central hole is free.
b) introduction of the specimen in the holder hole
o
c) pouring the metallic mounting material at 60 C
d) removing the adhesive tape from the holder. At the center the. decontaminated surface of the specimen.
e) wisck tests on the decontaminated surface of the_ specimen in order to determine the amount of loo.sec contamination (a loose contamination of 10~5
is allowed).
J. KJ\JO c '
18
li
Γ
1Ι
Ι hl
■ li
■f* V- ~* ^^—
^^^^^^^^
■ A
\W
íd
• ,
L ^ _ Ζ
Fig. 3 Device for autoradiography
a) side of the glove box connected with a PVC sack. A depression of 20 mm water existing in the box causes the inflation of the sack.
b) detail of the device: Φ specimen, (§) Hostaphan windox, (D^J?VC sack, @ photographic emulsion, © spring, © load, φ teflon support of the
specimen, (θ) to the noncontaminated side of the sack
Fig. 4 Example of microdensitometric graphs obtained from auto radiographs of mixed oxide specimen exposed for 20 seconds. Pu/U+Pu = 0."05, 0.10, 0.15, 0.25, 0.45, 0.5, 0.7· Aperture
O »
o »
η
η
6 0 η
90 »
F i g . 5a
010 ΟΙΟ Q3Û ΟΊΟ QS0 Q6o
υ.Ρ*
Density of the autoradiographs, represented in arbitrar]' units, plotted against plutonium concen tration. 20 ■fo 9 β ? 6 S Fig. 5b
©
©:
©·■
® =
Puυ+τ>„
lì 1>- Q.15
- o.ZS
=· o,*i5
lo Uo éo So ■too
¿frecj.
Density of the autoradiographs, represented ih
[image:23.595.32.575.19.796.2]co
o
υ* A/
©
X5
©
xS
'ig. 7
a) autoradiographs of tv/o oxide specimens exposed
simultaneously, (T) is the reference material
(
U0 85
PuO 15^°2
a n d© ^"
s tiie sP
e ci
m e nwith
unknown plutonium content.χ 5
22
Carbides
©·Α=°·*
Fig. 8 . Microdensitometric.scanning of autoradiographs
of carbide and nitride specimens. (ï) reference
material and (2) specimen with unknown plutonium
Fig. 9 Autoradiograph of a medianial mixture UO2-PUO2 white spots are plutonium-r i c h - p a plutonium-r t i c l e s . x5
xs
Fig. 10 {Vj microdensitometric graph of the autoradio-graph of fig.9
(2) microdensitometric graph of the autoradio-graph of a reference material with composition
24
-PuO¿
2cy
15
2JS0
*>υΟ,
(mo/%
X5"
» 'J η o u g a u Π O o Β o
2500
OJ
¿¿so
Ι 9· fa'»).
rte).
F i g . 11
Plutonium concentration profile of coprecipitated mixed oxide specimen ( U0 # ö 5P u0 > 1 5) o2 heated in athermal gradient
¿~7 J.
a) autoradiograph,χ5
b) concentration profile measured by αcounting techniques. Aperture 0.1 χ 1 mm
c) concentration profile measured by autoradio
[image:28.595.132.537.61.671.2]fmo/%)
(mo¿%)
¿o
mm.
Fig. 11 bis Plutonium concentration profile of coprecipi
tated mixed oxide specimen (U„ psPun . J o?
provided of a central well and heated in a
thermal gradient
£~8 _J.
a) autoradiograph χ 5
b) concentration profile measured by αcounting
techniques. Aperture 0.1 χ 1 mm.
c) concentration profile measured by autoradio
26
»Α.
C -V^Ät,
âí3*a»r·
0,10. .
Fig. 12 Mechanical mixture of UOp powder and (UQ „Q
Pu0 7n)0p spheres prepared by solgel.
a) autoradiograph, white spots represent the
plutoniumbearingparticles. x 5
b) microdensitometric graph. Aperture 1.5x10/u.
Optical magnification χ 44. Feedback setting
ratio 1 : 200
c) micrograph, roundshaped inclusions represent
Fig. 14 Coprecipiated (U„ O^PUQ -jr)Op mixed oxide.
In-homogeneous .
a) autoradiograph, white spots are plutonium-rich-particles, χ 5
b) micrograph, white regions are plutoni1..^ -rich
particles revealed by selective etching </~9'_7 χ 800
28
Fig. 13 Mechanical mixture of UOp powder and (UQ g5
PUQ ^)°2 sPh e r e s·
a) autoradiograph χ 10
All reports published by the Commission of the European Communities are on sale at the offices Usted below, at the prices given on the back of the front cover. When ordering, specify clearly the EUR number and the title of the report which are shown on the front cover.
OFFICE FOR OFFICIAL PUBLICATIONS OF THE EUROPEAN COMMUNITIES P.O. Box 1003 - Luxembourg 1
(Compte chèque postal N° 191-90)
BELGIQUE — BELGIË
MONITEUR BELGE
Rue de Louvain, 40-42 - B-1000 Bruxelles BELGISCH STAATSBLAD
Leuvenseweg 40-42 - B-1000 Brussel
DEUTSCHLAND
VERLAG BUNDESANZEIGER Postfach 108 006 - D-6 Köln 1
NEDERLAND
STAATSDRUKKERIJ-FRANGE
SERVICE DE VENTE EN FRANCE S r i ^ l ^ f i K ï F Î L
DES PUBLICATIONS DES Chnstoffel Plantijnstraat - Den Haag COMMUNAUTÉS EUROPÉENNES
UNITED KINGDOM
LIBRERIA DELLO STATO H. M. STATIONERY OFFICE Piazza G. Verdi, 10 - 1-00108 Roma P.O. Box 569 - London S.E.I
lommission
European Communities
D.G. XIII - C.I.D.
29, rue Aldringen o u r g
II
L u χ e m b