BIROn - Birkbeck Institutional Research Online
Mavrikis, M. and Zhu, Z. and Gutierrez-Santos, Sergio and Poulovassilis,
Alexandra (2015) Visualisation and analysis of students’ interaction data in
exploratory learning environments. In: UNSPECIFIED (ed.) Proceedings
of the 24th International Conference on World Wide Web.
New York,
U.S.:
Association for Computing Machinery, pp.
1419-1424.
ISBN
9781450334730. (Submitted)
Downloaded from:
Usage Guidelines:
Please refer to usage guidelines at
or alternatively
Visualisation and Analysis of Students’ Interaction Data in
Exploratory Learning Environments
Manolis Mavrikis
London Knowledge Lab UCL Institute of Education
[email protected]
Zheng Zhu
London Knowledge Lab Birkbeck, Univ. of London
[email protected]
Sergio Gutierrez-Santos
London Knowledge Lab Birkbeck, Univ. of London
[email protected]
Alexandra Poulovassilis
London Knowledge Lab Birkbeck, Univ. of London
[email protected]
ABSTRACT
Log files from adaptive Exploratory Learning Environments can contain prohibitively large quantities of data for visuali-sation and analysis. Moreover, it is hard to know in advance what data is required for analytical purposes. Using a mi-croworld for secondary algebra as a case study, we discuss how students’ interaction data can be transformed into a data warehouse in order to allow its visualisation and explo-ration using online analytical processing (OLAP) tools. We also present some additional, more targeted, visualisations of the students’ interaction data. We demonstrate the possi-bilities that these visualisations provide for exploratory data analysis, enabling confirmation or contradiction of expecta-tions that pedagogical experts may have about the system and ultimately providing both empirical evidence and in-sights for its further development.
Categories and Subject Descriptors
H.4 [Information Systems Applications]: Miscellaneous
Keywords
exploratory learning environments, analysis, visualisation
1.
INTRODUCTION
In recent years there has been much research and de-velopment work focusing on open-ended interactive educa-tional applications that encourage students’ experimenta-tion within a knowledge domain. These applicaexperimenta-tions range from simple games to complex simulators and microworlds [3]. These types of systems are becoming increasingly popular due to new forms of interaction afforded by hand-held de-vices and increasing ease of creation through related author-ing tools. In parallel with their increased adoption, there
Copyright is held by the International World Wide Web Conference Com-mittee (IW3C2). IW3C2 reserves the right to provide a hyperlink to the author’s site if the Material is used in electronic media.
WWW 2015 Companion,May 18–22, 2015, Florence, Italy. ACM 978-1-4503-3473-0/15/05.
http://dx.doi.org/10.1145/2740908.2743046 .
has developed an appreciation that in order for students to benefit from interaction with suchExploratory Learning
Environments(ELEs) there is a need for explicit
pedagogi-cal support to be provided to students [4]. This has led to research and development of intelligent techniques for pro-viding adaptive support to students in order to foster their productive interaction with ELEs [3].
The design and improvement of such adaptive ELEs is not a trivial task. Following a principled, evidence-based approach needs to rely on data gathered from students’ in-teractions with the ELE, in order to help educationalists un-derstand how students are interacting with the system and technical experts to develop enhanced or new intelligent sup-port features. However, typical log files from ELEs contain such large quantities of data that their interpretation for researchers, teachers and systems designers a difficult and expensive task (cf. [6]). In addition, it is not possible to always know in advance what data are relevant for analyt-ical purposes and therefore an exploratory analysis of the data gathered may be needed. Lastly, the logging of stu-dents’ interactions typically takes place in a manner that is optimal for recording and supporting students’ ongoing ac-tivities within the ELE but not necessarily for subsequent analysis and decision-making.
In this paper, we describe our approach to transform-ing students’ interaction data from an operational online database into a data warehouse, thereby enabling data vi-sualization and exploration based on online analytical pro-cessing and other visual tools that increase the speed of data retrieval and can allow stakeholders who have little technical expertise or training to explore such data. The main objec-tive of this approach is to support designers, researchers (and also potentially teachers) to conduct exploratory analysis of the data that includes visualising it in different ways and enabling decision-making.
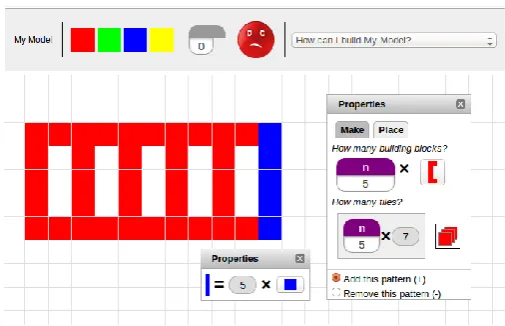
Figure 1: The eXpresser: Students create building blocks and use them to construct patterns, which
they subsequently colour. They need to use
vari-ables to specify how many tiles of each colour are needed in a generalised pattern.
In parallel, students are asked to formulate algebraic rules specifying the number of tiles of each colour that are needed to fully colour their models.
The MiGen system includes an intelligent component called
the eGeneraliser which provides both unsolicited and
on-demand personalised feedback to students, based on a three-layer architecture comprising Analysis, Reasoning and Feed-back Generation sub-components (see [3]). This intelligent support for students was designed through a detailed pro-cess of cognitive task analysis and Wizard-of-Oz studies and it relies on a set oftask-independent(TI) andtask-dependent
(TD) indicators being detected as students are interacting with the system. TI indicators occur when the eXpresser detects that specific actions have been undertaken by a stu-dent e.g. ‘stustu-dent has placed a tile on the canvas’, ‘stustu-dent has made a building block’, ‘student has unlocked a num-ber’. The detection of TI indicators is not dependent on knowledge specific to the task that the student is currently working on. TD indicators are detected by the analysis and reasoning sub-components of the eGeneraliser, based on the students’ actions and on knowledge specific to the current task, e.g. ‘student has made a plausible building block for this task’, ‘student has unlocked too many numbers for this task’, ‘student has achieved task goaln’. All the occurrences of TI and TD indicators are stored in the operational online MiGen database, leading to large volumes of such data.
Figure 2 (from [5]) illustrates the architecture of the Mi-Gen system. Shown in white are the components comprising the Student software running on the students’ computers, in light grey the components comprising the Teacher software running on the teacher’s computer, and in dark grey the Server components. Also shown is the information flow be-tween components. Each of the user-facing tools consists of a User Interface (UI) component and an Information Layer (IL) component. Each tool’s UI is responsible for interac-tion with the user, while its IL is responsible for managing the data structures and computation required to support
Figure 2: MiGen Architecture
the UI and for communicating with the Server software. The Server software in turn provides access to the MiGen database. ‘Act.Doc.’ denotes ‘Activity Document’, within which construction tasks are presented to students and they record their reflections as they undertake these tasks using eXpresser. The Act. & Task Design Tool is used to create tasks and activity documents. The TA (Teacher Assistance) Tools assist teachers in monitoring students’ activities, in-forming teachers’ interventions in the class and review of students’ achievements (see [2] for details of these).
In the initial implementation, all the tools were imple-mented in Java and integrated into a lightweight architec-ture based on REST, facilitating iterative prototyping and trialling. More recent development has ported the Student and Teacher tools to a Web environment (using XHTML, JavaScript and Ajax technologies) and the Server to Google’s App Engine, for greater ease of adoption in schools and greater scalability. Performance studies have shown the sys-tem’s ability to handle thousands of concurrent users (com-prising concurrently running classes of students and teach-ers, at a typical ratio of about 30 students to 1 teacher), typically generating 50 to 100 indicator occurrences per stu-dent per hour.
The question we address in this paper is: how might large volumes of interaction data from ELEs such as MiGen be visualised and explored in order to determine the effective-ness of the intelligent support being provided by the system to students and to improve this support as necessary? We have investigated several possible visualisations and we here report on those that we have found to be the most useful: (i) multi-dimensional data visualisation and exploration us-ing online analytical processus-ing tools, in Section 2; and (ii) additional, more targeted, visualisations of the frequency of occurrence of different types of indicators and the transitions between them, in Section 3. Section 4 gives our concluding remarks and directions of future work.
2.
MULTI-DIMENSIONAL VISUALISATION
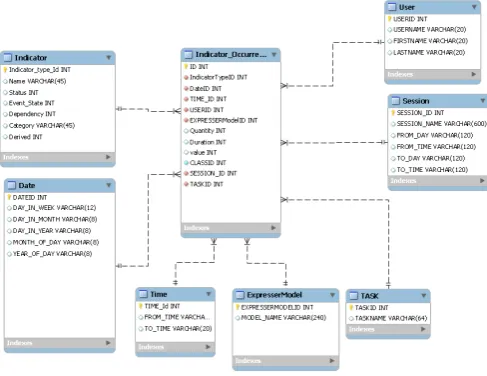
[image:3.595.320.561.61.198.2]mod-Figure 3: The Schema of the Data Warehouse
elling and visualisation from the data management field, known as Online Analytical Processing (OLAP). The aim of OLAP systems is to provide interactive tools for apply-ing filterapply-ing and aggregation operations to multi-dimensional data and viewing the results in a tabular or graph form. We used the Oracle data warehouse and Analytic Workspace Manager1.
The first step required developing scripts to extract and transform the data from the operational MiGen database holding the students’ interaction data into adata warehouse
— this is the so-called Extraction, Transformation, Load (ETL) process and has the aim of transforming day-to-day operational data from its original format into a form that is more efficiently and easily visualised and analysed by do-main experts. A data warehouse is typically designed to collect information on one or more numericmeasures, each measure depending on a set ofdimensions. Each dimension is described by a set ofattributes. Data warehouse schemas thus typically consist of one or morestar schemas. A star schema comprises a fact table and a number of dimension
tables. The fact table contains information regarding one
or more measures and its primary key is a concatenation of the primary keys of the dimension tables. Each dimension table contains information about the attributes of one of the dimensions relating to the measure(s) recorded in the fact table.
In the case of the MiGen interaction data, we identified two measures — the quantity and the duration of the in-dicator occurrences, and seven dimensions relating to each occurrence of an indicator: the Date and Time it occurred, the ExpresserModel and Task it relates to, the User who generated it, the Session in which it was generated, and its Indicator type (e.g. ‘tile placed’, ‘pattern made’, ‘num-ber created’, ‘num‘num-ber unlocked’, ‘value of unlocked num‘num-ber changed’, ‘correct local rule created’, ‘inactive student’ etc. — see the Appendix for the full list of indicator types).
Figure 3 illustrates the data warehouse schema that we de-signed, showing the table Indicator Occurrence as the
cen-1
[image:4.595.312.518.52.227.2]http://www.oracle.com/technetwork/database/enterprise-edition/index-087067.html
Figure 4: Indicators broken down by Status
tral fact table and the seven connected dimension tables. Additional data relating to an indicator occurrence is stored in the ‘value’ attribute of the Indicator Occurrence table. We note that the fact table is able to join with each of the dimension tables (because it contains their primary key at-tributes in its attribute list) but the dimension tables do not join with each other. Hence the ‘star’ shape of the schema. In the Indicator table, each type of indicator has asso-ciated with it a Status. This may have value -1, 0 or 1 indicating, respectively, that an occurrence of this type of indicator is regarded as showing that the student is making negative, neutral or positive progress towards achieving the task goals. An additional Status value of 2 indicates that this indicator type relates to an intervention generated by the system: this may be an explicit request for feedback by the student, or the generation and presentation of feedback by the system.
There are several interesting visualisations provided by standard OLAP tools that, with little training, can be made accessible to non-technical domain experts. For example, Figure 4 shows a breakdown of the number of indicators oc-curring by Task ID, Status and Year. Task ID is an attribute of the Task dimension, Year is an attribute of the Date di-mension, and Status is an attribute of the Indicator type dimension. In Figure 4 there has also been some filtering of the data, so that data relating only to year 2010 and Task 1 has been selected to be viewed. There has also been a ‘drilling down’ into the data relating to Status -1, to break it down into the specific indicator types that have this Sta-tus value (namely, Incorrect Local rule created, Inactive stu-dent, Incorrect local allocation detected). This kind of view allows us to see what kinds of positive, neutral and negative behaviours are commonly occurring as students are under-taking a task, in order to gauge, for example, students’ level of engagement and productive interaction with the task.
[image:4.595.57.301.54.242.2]Figure 5: Indicators by Status and Model
3.
MORE TARGETED VISUALISATIONS
In our efforts to analyse students’ interaction data and to identify which aspects of MiGen’s intelligent support re-quire further research and design work, the above multi-dimensional visualisations allowed the MiGen team to teract with each other and with other experts providing in-sights to support our decision-making. However, beyond these standard visualisations provided by OLAP tools, we have also developed several other ad-hoc visualisations that help us to further explore students’ interactions. We present here two of the most useful ones, relating to the frequency at which different indicator types occur and to the transitions between different types of indicator.
3.1
Frequency of indicator type occurrences
For analysing frequency of occurrence of different indica-tor types we have found visualisations such as the one shown in Figure 6 very useful. The heights of the bars correspond to the conditional relative frequencies of indicator types with Status -1, 0, 1, 2 in each of the classroom sessions being anal-ysed (the analysis here relates to three successive classroom sessions: Session 1, Session 2, Session 3). The widths of the bars correspond to the relative frequencies of indicator occurrences between the sessions.
Having a way to visualise this information quickly for re-searchers and teachers is useful. In this example, we can see that the number of indicator occurrences grows with each successive session and that the frequency of occurrence of negative indicator types is decreasing with each successive session. This may be because students are becoming more familiar with using the system — a hypothesis that would warrant further investigation.
3.2
Transition of indicator type occurrences
The occurrence of sequences of indicator types can present patterns that may also provide insights. Standard sequence analysis, however, provides patterns that are difficult to in-spect. In order to facilitate the involvement of pedagogical experts, we therefore investigatedtransition matrices, which are used to describe the transitions of a Markov chain:
Given a finite space of indicator types,Pij=P(j|i) is the
probability of moving from indicator typeito indicator type
j in one time step. Transition matrices can be normalised to quantify the transition probability from indicatori to any other indicator. We can also normalise the matrix to
mea-Session 1 Session 2 Session 3
−1
0
1
2
[image:5.595.317.517.70.182.2]0 0.2 0.4 0.6 0.8 1 The Proportion of Status of Indicator Type (Mean) in Sessions
Figure 6: Proportion of negative (-1), neutral (0), positive (1) or intervention (2) indicators
sure the incoming transition probability to indicatorj from other indicators. In addition, we add artificial points to the system to capture the start and end of the student’s inter-actions relating to each model. Accordingly, for each model,
sindicates the first indicator before the student begins con-struction of the model andethe last indicator at the end of the model’s construction.
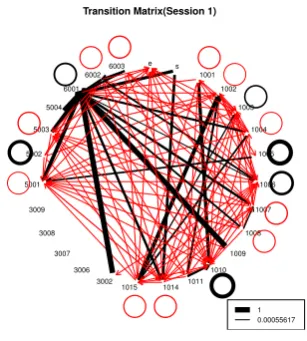
Transition matrices can be visualised using graphs such as those shown in Figures 7 to 10. Indicators shown with a circle round them indicate that there are transitions in the data where this indicator occurs repeatedly in succession. The thickness of each line or circle indicates the value of the transition probability: the thicker the line, the higher the probability. The red (light grey) lines are associated with a probability less than 0.2 and the black lines with a probability greater than or equal to 0.2.
Transition Matrix(Session 1)
s 1001
1002 1003
1004 1005
1006 1007 1008 1009 1010 1011 1014 1015 3002 3006 3007 3008 3009 5001
5002 5003
5004 6001
6002 6003 e
[image:5.595.342.496.424.595.2]1 0.00055617
Figure 7: Incoming Transition Matrix (Session 1)
Transition Matrix(Session 2) s 1001 1002 1003 1004 1005 1006 1007 1008 1009 1010 1011 1014 1015 3002 3006 3007 3008 3009 5001 5002 5003 5004 6001 6002 6003 e 1 0.00030012
Figure 8: Incoming Transition Matrix (Session 2)
but no such transition in Figure 8, which indicates that feed-back received from the system in Session 1 was carried over to students’ interactions in Session 2. Such an observation helps us raise a hypothesis for more detailed analysis, or further student observations and data gathering: “are stu-dents internalising the system’s feedback and thus avoiding the same error in subsequent sessions, or is this simply an artefact of their increasing familiarity with the system?”
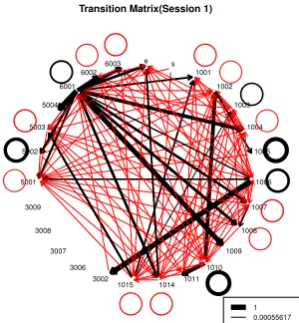
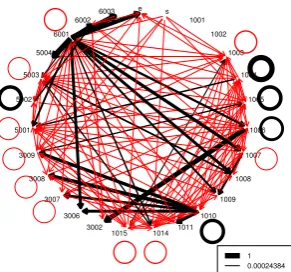
Equally interesting is the comparison of outgoing transi-tions. In Figure 9 relating to Session 1 we see a predom-inance of transitions from a system-generated intervention (6001) to the student’s naming of a number (1009) and to other indicators relating to numbers (1006–1009). This be-haviour is repeated in Session 2 (not shown here). In Fig-ure 10 relating to Session 3, the likelihood of such transitions is less, indicating that such system-generated interventions are needed fewer times. This is confirmed by the increased likelihood of a direct transition between a number being un-locked (1007) and being named (1009) without requiring an intervention by the system (this was confirmed by further analysis and empirical observations in the classroom).
However, in Figure 10 there is a higher probability of in-dicator 1004 (corresponding to an unlocked number being changed) transitioning to itself. This is an example of an unexpected behaviour, and may indicate trial-and-error by students starting to take advantage of the affordances of the eXpresser (i.e. ‘gaming’ the system [1]) after having been prompted in the first Session. This behaviour is something beyond the intentions of the designers and demonstrates how our analysis and visualisation approach allows us to make informed decisions and identify areas of further development of the intelligent support provided by the system.
Of course, visual inspection is generally not sufficient and may indeed be misleading depending on the total number of indicators. Generally, we need to know whether there is a statistically significant difference between a transition across different sessions. To do that, we run the 2 samplet-test as follows: Given a transition fromatob, we count the number of times such transitions happen for each session and each student, denoting this byNij, whereiis the student num-ber (i= 1. . . n) andjis the session number. We form one vector for each sessionj with iranging from 1 to n. The
elements of the vector are the number of times such a tran-sition happens for a student. Continuing with the examples before, and focusing on indicator 6001, we found that a sig-nificant difference occurs (among other places) in the tran-sition 6001→1014 between Session 1 and Sessions 2 and 3 (but not between Session 2 and Session 3). For Session 1, the transition probability is 0.278, while for Sessions 2 and 3, it is 0.472 and 0.493, respectively. In this case, this indi-cates the effectiveness of the system-generated feedback in helping students to formulate a correct rule (indicator 1014).
4.
CONCLUSIONS
The volumes of data gathered from students’ interactions in Exploratory Learning Environments (ELEs) makes inter-pretation of such data a difficult and costly task. The data is typically logged and stored in a manner that facilitates users’ interactions with the ELE, but not necessarily subsequent analysis and decision making. Moreover, domain experts may not know in advance which data is relevant for analy-sis and decision making. In this paper we have addressed the question of how large volumes of student’s interaction data gathered by an adaptive ELE can be visualised and explored in order to determine the effectiveness of the intel-ligent support being provided by the system and to improve this support. We have presented several possible visualisa-tions of such data. We have discussed insights derived from these and how they can inform decisions with respect to fur-ther research and development. Although developed in the context of the MiGen system and its eXpresser microworld, our approach and visualisations are generic and could be applied to any ELE in which key indicators relating to stu-dents’ interactions are detected or inferred by the system.
Currently, our visualisations require the support of a tech-nical expert in order to create them, using either standard OLAP tools or ad-hoc visualisations (mostly generated us-ing R scripts). We plan to improve both their interactivity and their ease of use in order to allow stakeholders with less technical expertise to be able to create such visualisations for themselves [7], to explore the data from their perspectives, and to formulate hypotheses for further investigation.
Acknowledgements.
This work has been funded by the ESRC/ EPSRC TEL Pro-gramme, with co-funding by the EU FP7 projects iTalk2Learn (#318051) and M C Squared (#610467). We thank all the mem-bers of these projects for their help and insights.
Transition Matrix(Session 1)
s 1001 1002 1003 1004 1005 1006 1007 1008 1009 1010 1011 1014 1015 3002 3006 3007 3008 3009 5001 5002 5003 5004 6001 6002 6003 e 1 0.00055617
[image:6.595.344.494.542.704.2]Transition Matrix(Session 3)
s 1001
1002 1003
1004 1005
1006 1007 1008 1009 1010 1011 1014 1015 3002 3006 3007 3008 3009 5001 5002 5003
5004 6001
6002 6003 e
[image:7.595.84.230.81.217.2]1 0.00024384
Figure 10: Outgoing Transition Matrix (Session 3)
5.
REFERENCES
[1] R. Baker, J. Walonoski, N. Heffernan, I. Roll, A. Corbett, and K. Koedinger. Why Students Engage in ”Gaming the System” Behavior in Interactive Learning Environments.Journal of Interactive Learning
Research, 19(2):185–224, Apr. 2008.
[2] S. Gutierrez-Santos, E. Geraniou, D. Pearce-Lazard, and A. Poulovassilis. Design of Teacher Assistance Tools in an Exploratory Learning Environment for Algebraic Generalization.IEEE Transactions on
Learning Technologies, 5(4):366–376, 2012.
[3] S. Gutierrez-Santos, M. Mavrikis, and G. D. Magoulas. A Separation of Concerns for Engineering Intelligent Support for Exploratory Learning Environments.
Journal of Research and Practice in Information
Technology, 44:347–360, 2013.
[4] R. E. Mayer. Should there be a three-strikes rule against pure discovery learning? The case for guided methods of instruction.American Psychologist, 59(1):14–19, 2004.
[5] R. Noss and et al. The design of a system to support exploratory learning of algebraic generalisation.
Computers and Education, 59(1):63–82, 2012.
[6] C. Romero, P. Gonzalez, S. Ventura, M. Del-Jesus, and F. Herrera. Evolutionary Algorithms for subgroup discovery in elearning: A pratical application using Moodle.Expert Systems with Applications, 39, 2009. [7] J. Steele and N. Illinsky.Beautiful Visualization:
looking at data through eyes of experts. O’Reilly, 2010.
APPENDIX
Indicator Type Name
1001 Building block made 1002 Pattern made 1003 Tile placed
1004 Unlocked Number changed 1005 Model Rule modified 1006 Number created 1007 Number Unlocked
Indicator Type Name
1008 Number Locked 1009 Number Named 1010 A shape deleted 1011 All shapes deleted 1012 Task done 1013 Start task
1014 Correct Local rule created 1015 Incorrect Local rule created 1016 Correct Model Rule created 1017 Incorrect Model Rule created 2001 All Local Allocations correct 2002 Model is animated
2003 Inactive student
2004 Model consists only of Single Tiles 2005 Model consists only of Patterns 2006 Model has at least one Pattern 2007 Model has at least one uncorrected
overlap
2008 All negative tiles used 2009 All variables named
2010 One or more variable named 2011 One or more constant named 2013 Last shape modified
3001 Construction evaluation 3002 Activity document answer right 3003 Activity document answer wrong
-unknown reason
3004 Activity document answer wrong -scaling
3006 Building block made - plausible 3007 Building block made - implausible 3008 Pattern made
-plausible building block 3009 Pattern made
-implausible building block 4001 Task pattern built with unit tiles 4002 Plausible building block in use 4003 Animated unmessable pattern 4004 Animated apparent solution pattern 4005 Rhythm detected
4006 Spurious Title
4007 Pattern structure general -no shape detected
4008 Correct general allocation 4009 Pattern coloured generally 4010 Apparent solution on canvas 4011 Right amount of unlocked numbers 4012 Too many unlocked numbers 4013 No unlocked number
4014 Incorrect local allocation detected 5001 Goal checked by system