On the Choice of an Appropriate Software Reliability
Growth Model
Neha Miglani
Assistant Professor, Department of Computer Science and Engineering, JMIT, Radaur, Kurukshetra University, Kurukshetra, Haryana-136119, India
ABSTRACT
Software reliability is an active field of research over the past 35 years. Software developers often feel the necessity of selecting an appropriate software reliability model that not only best depicts the past history but also can predict reasonably well the future behavior of the software being developed in respect of detected bugs and errors. This helps in estimating in advance the time of delivery as well as the overall cost of the software project. Several models have been proposed in literature for estimating software reliability under different environments. However from amongst the models developed thus far, there is not a single model that best fits all or even a majority of the real life situations and so can be universally recommended.
In this study, a technique is proposed to serve as a guide for the selection of an appropriate software reliability model for an ongoing software development project. The proposed technique has been tested on various sets of available software development project datasets and it has been observed that model recommended on the basis of proposed technique is better in comparison with models recommended on the basis of other models proposed.
General Terms
Curve fitting technique, Goodness-Of-Fit, Non-Homogeneous Poisson process, Software reliability, Software reliability growth models.
1.
INTRODUCTION
Software plays an important role in today’s life. It is embedded in commonly used appliances such as computers, automobiles, and televisions etc, which are widely used. There is an exponential boom in the software industry. As a result, there is greater competition among software producers. Software customers are now more conscious about the quality of the products and services which these can provide.
Software is essentially an instrument for transforming discrete sets of inputs into discrete sets of outputs [2]. A software controls functions of the entire system. The faults in the software may cause critical problems leading to financial losses, human injury and even death. It is, therefore, important to develop robust and reliable softwares and for this techniques are needed, which can measure and predict the reliability of the software being developed during development stage itself.
During the last two decades there has been enormous growth of literature on software reliability theory. Statistical models have been developed that can be used to evaluate the reliability of a software system. For development of an effective software reliability model, one needs to understand how software is produced and tested, the types of errors that
can occur, and how these errors get introduced.
More than 50 software models have been proposed in literature [2], [3], [8], [9], [13], [14]. However none of these is effective in even types of situation. The problem therefore is as to how to make choice of an appropriate software model for a given practical situation. Certain methods have been proposed in literature for this [4], [6], [7], [10], [11]. However none proves equally effective in all the circumstances. In this paper, a method is proposed for the choice of an appropriate Software Reliability Growth Model which can be effective in majority of the situations.
The remainder of the paper is organized as follows: Section 2 reviews in brief the available literature on ranking and selection of different Software Reliability Growth Models and the recommended criteria for selection of an appropriate model. In Section 3 a method for selecting an appropriate reliability model is proposed. Effectiveness of the proposed method is next demonstrated in Section 4 with the help of certain case studies Conclusions based on the present study are finally presented in Section 5.
2.
CHOICE OF APPROPRIATE
SOFTWARE RELIABILITY MODEL
Software reliability is an important attribute of software. It is of prime importance for mission critical systems, which demand high reliability. In safety related applications and in products with long lifetime, reliability is a must. Counter-measures need to be taken to ensure product level reliability [1]. Thus reliability modeling of software products and predicting reliability via such models at different phases of the software life cycle is of prime importance. Methods that estimate remaining defects (or failures) in software can help test managers make release decisions during testing stage itself. Various estimation models exist to estimate the expected number of total defects (or failures) and the expected number of remaining defects (or failures) [11].
Most of the available techniques for predicting software reliability are based purely on the observation of software product failures. These methods generally require a considerable amount of failure data to achieve an accurate reliability prediction. In these methods, information concerning the development of software product, the method of failure detection, environmental factors, etc, is generally not used.
A large number of software reliability models have been proposed in the literature to predict the reliability. Sixteen most commonly used software reliability growth models (categorized as Non-Homogenous Poisson Process Models(NHPP)) are Generalized Goel Model[2], Goel-Okumoto Model[3], Gomperts Model[13], Inflection S-Shaped Model[13], Logistic Growth Model[13], Modified Duane Model[5], Musa-Okumoto Model[8], Yamada imperfect debugging Model1[14], Yamada Rayleigh Model[14], Delayed S-Shaped Model[13], Yamada imperfect debugging Model2[14], Yamada exponential Model[13], P-N-Z Model[9], P-P-N-Z Model[9], Pham P-N-Zhang IFD Model[15] and Zhang-Teng-Pham Model[15].
Following assumptions have generally been made in developing these models [15]:
i. A software program can fail during execution.
ii. The occurrence of software failures follows NHPP with mean value function m (t).
iii. The software failure detection rate at any time is proportional to the number of faults remaining in the software at that time.
iv. When a software failure occurs, a debugging effort occurs immediately. This effort removes the fault immediately with the probability p, (where p>>1-p).
v. At each debugging, whether the detected fault is successfully removed or not, some new faults may get introduced into the software system with probability
β (t) (β (t) <<p).
Alongwith NHPP models, certain other categories of models also exist on the basis of different phases of software development life cycle (SDLC).
Takmasa et. al [12] reported the suitability and stability of the NHPP and trend curve software reliability growth models. The study showed that NHPP model fitted well the software development projects, which they considered (mainly custom-made application programs) of Hitachi Ltd. consisting of several sub-systems with several test phases individually. Quality control limit curves have also been recommended for more effective application of these models.
Efforts have been often made to decide about the model from amongst the existing models (as listed in Sharma et. al [6]), that best fits the software under study. No model available thus far, proves best for all the situations. Techniques have, therefore, been proposed to decide about the effectiveness of various models in a given context and to choose the best one.
Stringfellow and Amschler [11] proposed an empirical method for selecting Software Reliability Growth Models (SRGMs) to make release decisions. The method provides guidelines on how to select among the SRGMs the best model to use as failures are reported during the test phase of the software being developed. Kharchenko [7] designed a method for the choice of the software reliability model based on the analysis of assumptions and compatibility of input and output parameters. For choice of SRGM an assumptions matrix is developed taking into account the features of software engineering and testing processes. Sharma et. al [6] proposed a deterministic quantitative model based on distance based approach (DBA) and applied it for selection and ranking of SRGMs. This method incorporates both quantitative and qualitative factors. Garg et al [10] presented a computational methodology based on matrix operations for a computer based
solution to the problem of performance analysis of software reliability models (SRMs). A set of seven comparison criteria have been formulated to rank various non-homogenous Poisson process software reliability models proposed during the past 30 years Duygulu and Tosun [4] focused on selecting the reliability model that best describes the collected failure data. The proposed algorithm was aimed to be a guideline for the potential user who wants to evaluate the reliability of the developed software.
Some of the points that need to be kept in mind while developing a software reliability model selection are [11]:
• As no model is expected to match company’s development and test process exactly, the selected model should yield a curve fit that shows Goodness-Of-Fit value as high as possible.
• Data is usually grouped by weeks and it takes longer for the predicted total number of failures to stabilize.
• Testing effort may vary from week to week. This is a problem with a small dataset, when data is only for a few test weeks.
• Models are usually based on execution time whereas most of the information available is based on calendar time.
A careful study of the available literature shows that when a software has been reasonably developed one should choose a model that
• gives as far as possible reasonably accurate estimate of known past defects.
• is able to predict reasonably accurate future defects expected.
• provides a mechanism for estimating the earliest possible release date of the software.
(If the software is released earlier, it may contain bugs which may start appearing in a very short span of time and thus, lower acceptance of product by the users. On the contrary, if one takes too long to make release decision, it may results in wastage of time, money as well as resources).
In the next section, a method is proposed for choosing an appropriate software reliability model.
3.
THE PROPOSED METHOD
Keeping in view the above facts, a method is proposed for selecting software reliability model that best fits the available data and can be used to make predictions about the date of release. It tries to take care of the issues listed above in an appropriate way. The proposed method works as under:
1. Keep a periodic record of the cumulative number of failures observed in the software project till the decided date of testing.
2. Use appropriate software (such as one available in MATLAB for curve fitting) to determine the values of the parameters of the probable models for which these best fit the data available thus far in the sense of least square error curve fitting and use these to compute for these models the values of parameters:
Rsq: that measures how appropriate the model fits the available data. (A value closer to 1 indicates a better fit.)
with which the model predicts the observation. (A value closer to 0 indicates a better fit.)
3. From amongst the models under consideration choose the models for which
Rsqspecified value (it was chosen as 0.90 for early
stages of testing and 0.95 for later stages) (1)
and
RMSE specified value (it was chosen 15 for early
stages and 10 for later stages) (2)
4. For each of the models satisfying the above two criteria, compute the currently predicted number of errors (mean value function m(t)), denoted by PREDF and compare these with their actual values from the actual data, to computeAPF. Thus, the relation between the two can be represented as:
(3) | APF)) PREDF, APF)/(max(
-(PREDF | 1-= PRED
where
PREDF represents current value of predicted number of errors using the selected model and APF denotes the actual errors observed in the dataset.
Next, using the selected model, compute the total number of expected errors ‘a’ and remaining errors a-m(t) and the estimated time EST by which 95% confidence limit i.e. 95% of total errors (or 95% reliability) is expected to be achieved using
EST=1-|(ESTR-ACR)/(max(ESTR,ACR))| (4) where ESTR denotes the estimates of number of
errors detected till date (m(t)) and ACR is the actual number of errors detected thus far.
5. The model which gives value of EST closest to one is the most appropriate model. Using computed data, models
may be ranked as:
Rank=(Rsq+PRED)*0.3+(RM+EST)*0.2 (5) where
C RMSEM/RMSE
RM ( RMSEM represents the
minimum value amongst all the values of RMSE from selected models and RMSEC represents the calculated value of RMSE for that specific model.)
6. Select suitable model from amongst the top ranked models which gives best future predictions.
4.
VALIDATION ON TEST DATA
Proposed technique has been tested on the following datasets.
Dataset -1: A dataset having 100 reported defects has been taken from the open literature [6] for evaluation, optimal selection and ranking of these sixteen NHPP software reliability growth models. The data set consists of weeks, CPU Hours and Defect values.
Dataset-2: For testing the effectiveness of proposed method, dataset considered by [10] is used in the research paper. This data set is from the testing process on a middle-size software project. Failure data consisting of failure time in weeks and cumulative number of failures. The dataset comprises of 192 reported defects corresponding to 21 weeks.
Dataset -3: For next dataset, the failure data from [11] is taken. The failure data set comes from three releases of a large medical record system, consisting of 188 software components. Each component contains a number of files. Initially, the software consisted of 173 software components. All three releases added functionality to the product. Over the three releases, 15 components were added. Between three and seven new components were added in each release. Many other components were modified in all the three releases as a side-effect of the added functionality. In this paper, we have considered all the three releases (Release-1, Release-2 and Release-3)
In case of each dataset, sixteen NHPP Software Reliability Growth Models listed in Sharma et. al [6] were considered and in each case ranks of these models were obtained Eventually, four top ranked models were selected in each case and the best model was chosen from amongst these which gives the best future predictions.
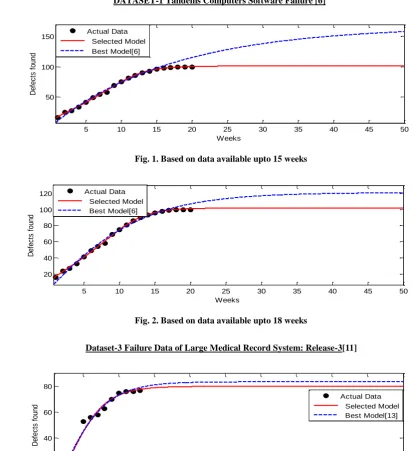
The results are listed in Table I - Table III. Earlier results of authors are given for comparison. Results of two datasets are also depicted graphically in Fig. 1 - Fig.3.
5.
CONCLUSIONS
Use of the proposed technique for deciding the choice of an appropriate reliability model that best fits available data of an ongoing software project has shown that the proposed approach provides a better choice of the model as compared with models using available approaches in literature.
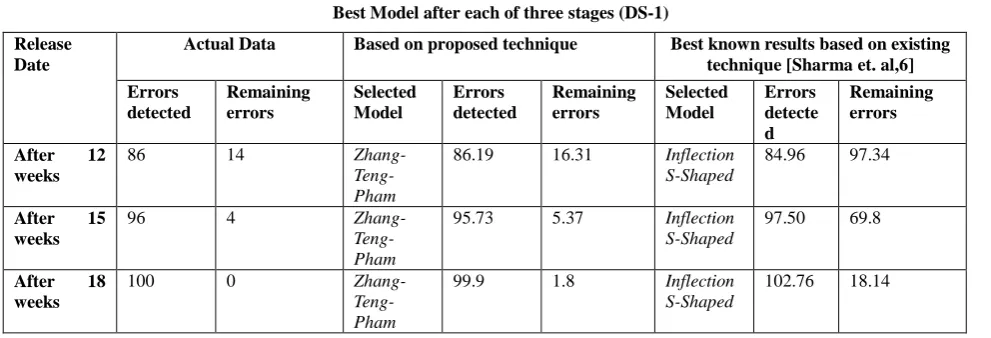
[image:3.595.47.543.603.772.2]DATASET-1 Tandems Computers Software Failure [6] TABLE I
Best Model after each of three stages (DS-1)
Release Date
Actual Data Based on proposed technique Best known results based on existing technique [Sharma et. al,6]
Errors detected
Remaining errors
Selected Model
Errors detected
Remaining errors
Selected Model
Errors detecte d
Remaining errors
After 12 weeks
86 14
Zhang- Teng-Pham
86.19 16.31 Inflection S-Shaped
84.96 97.34
After 15 weeks
96 4
Zhang- Teng-Pham
95.73 5.37 Inflection S-Shaped
97.50 69.8
After 18 weeks
100 0
Zhang- Teng-Pham
99.9 1.8 Inflection
S-Shaped
DATASET-2 Middle Size Software Project Failure Data [10]
TABLE II
Best model after each of three stages (DS-2)
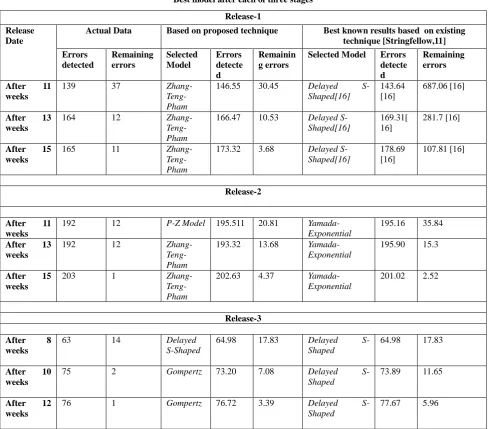
[image:4.595.54.543.330.759.2]DATASET-3 Failure Data of Large Medical Record System [11]
TABLE III
Best model after each of three stages Release
Date
Actual Data Based on proposed technique Best known results based on existing technique [Garg et. al,10]
Errors detected
Remaining errors
Selected Model
Errors detected
Remaining errors
Selected Model
Errors detecte d
Remaining errors
After 13 weeks
157 35 P-N-Z
Model
155.25 11.05 P-Z Model 155.32 11.18
After 16 weeks
182 7 Generalized
Goel
178.07 27.73 P-Z Model 182.18 1.58 * 104
After 19 weeks
187 5 Generalized
Goel
187.88 19.12 P-Z Model 185.51 14.29
Release-1
Release Date
Actual Data Based on proposed technique Best known results based on existing technique [Stringfellow,11]
Errors detected
Remaining errors
Selected Model
Errors detecte d
Remainin g errors
Selected Model Errors detecte d
Remaining errors
After 11 weeks
139 37
Zhang- Teng-Pham
146.55 30.45 Delayed S-Shaped[16]
143.64 [16]
687.06 [16]
After 13 weeks
164 12
Zhang- Teng-Pham
166.47 10.53 Delayed S-Shaped[16]
169.31[ 16]
281.7 [16]
After 15 weeks
165 11
Zhang- Teng-Pham
173.32 3.68 Delayed S-Shaped[16]
178.69 [16]
107.81 [16]
Release-2
After 11 weeks
192 12 P-Z Model 195.511 20.81
Yamada-Exponential
195.16 35.84
After 13 weeks
192 12
Zhang- Teng-Pham
193.32 13.68 Yamada-Exponential
195.90 15.3
After 15 weeks
203 1
Zhang- Teng-Pham
202.63 4.37 Yamada-Exponential
201.02 2.52
Release-3
After 8 weeks
63 14 Delayed
S-Shaped
64.98 17.83 Delayed
S-Shaped
64.98 17.83
After 10 weeks
75 2 Gompertz 73.20 7.08 Delayed
S-Shaped
73.89 11.65
After 12 weeks
76 1 Gompertz 76.72 3.39 Delayed
S-Shaped
DATASET-1 Tandems Computers Software Failure [6]
[image:5.595.76.491.77.529.2]Fig. 1. Based on data available upto 15 weeks
Fig. 2. Based on data available upto 18 weeks
Dataset-3 Failure Data of Large Medical Record System: Release-3[11]
Fig. 3. Based on data available upto 12 weeks
6.
ACKNOWLEDGEMENTS
The author would like to thank Dr. C.Mohan, Prof Computer Science, Ambala College of Engineering and Applied Research for his critical review. Constructive comments made by him were helpful in improving the quality of the paper.
7.
REFERENCES
[1] Aitken Robert , Fey Gorschwin , Kalbarczyk Zbigniew T. , Reichenbach Frank , Sonza Reorda, Matteo, “Reliability analysis reloaded: How will we survive?” Design, Automation & Test in Europe Conference & Exhibition (DATE), pp.358 – 367, March 2013.
[2] Goel, A.L. “Software Reliability Models: Assumptions, Limitations, and Applicability,” IEEE Trans. Software Engg. Vol SE-11, No 12, 1985 Dec, pp 1411-1423
[3] Goel A. L and Okumoto K., "Time-dependent error-detection rate model for software reliability and other performance measures," IEEE Trans. Rel., vol. R-28, pp. 206-211, Aug. 1979.
[4] Hakan Burak Duygulu, Oğuz Tosun, “An Algorithm for Software Reliability Growth Model Selection” IADIS International Conference Informatics 2008.
[5] Huang C. Y., Lyu M. R., and Kuo S. Y., “A unified scheme of some non-homogenous Poisson process models for software reliability estimation,” IEEE Trans.
Weeks
D
e
fe
c
ts
f
o
u
n
d
YT20 vs. XT20 Present Model Author's Model[6]Weeks
D
e
fe
c
ts
f
o
u
n
d
YT20 vs. XT20 Present Model Author's Model[6]Weeks
D
e
fe
c
ts
f
o
u
n
d
YT20 vs. XT20 Present Model Author's Model[6]Weeks
D
e
fe
c
ts
f
o
u
n
d
YT20 vs. XT20 Present Model Author's Model[6]
5 10 15 20 25 30 35 40 45 50
50 100 150
Weeks
D
e
fe
c
ts
f
o
u
n
d
Actual Data Selected Model Best Model[6]
5 10 15 20 25 30 35 40 45 50
20 40 60 80 100 120
Weeks
D
e
fe
c
ts
f
o
u
n
d
Actual Data Selected Model Best Model[6]
5 10 15 20 25 30 35 40 45 50
20 40 60 80
Weeks
D
ef
ec
ts
f
ou
nd
on Softw. Engineering, vol. 29, no. 3, pp. 261-269, March 2003.
[6] Kapil Sharma, Rakesh Garg, C. K. Nagpal, and R. K. Garg, “Selection of Optimal Software Reliability Growth Model using Distance Based Approach”, IEEE Transactions. June 2012, Volume 59, Issue: 2, Pages: 266-276.
[7] Kharchenko, V.S. et al, 2002, “The Method of Software Reliability Growth Models Choice Using Assumptions Matrix” Proceedings of the 26th Annual International Computer Software and Applications Conference (COMPSAC’02).
[8] Musa J. D., and Okumoto K., “A logarithmic Poisson execution time model for software reliability measurement,” Conf. Proc. 7th International Conf. on Softw. Engineering, 1983, pp. 230-237.
[9] Pham H., Nordmann L., and Zhang X., “A general imperfect software debugging model with s-shaped fault detection rate,” IEEE Trans. Reliability, vol. 48, June 1999, pp. 169–175.
[10]RajPal Garg, Kapil Sharma, Rajiv Kumar, R. K. Garg,” Performance Analysis of Software Reliability Models
using Matrix Method” World Academy of Science, Engineering and Technology 71 2010.
[11]Stringfellow, C., and Amschler, A.A., 2002,”An Empirical Method for Selecting Software Reliability Growth Models” Empirical Software Engineering, 7, 319-343.
[12]Takmasa Nara Masahiro Nakata Akihiro Ooishi, “Software Reliability Growth Analysis- Application of NHPP Models and Its Evaluation “1995 IEEE.
[13]Yamada S., Ohba M., and Osaki S., "S-shaped reliability growth modeling for software error detection," IEEE Trans. Rel., vol. R-32, pp. 475-478, 484, Dec. 1983
[14]Yamada S., Tokuno K., and Osaki S., “Imperfect debugging models with fault introduction rate for software reliability assessment, “International J. Syst. Science, vol. 23, no. 12, 1992.