Implementation of a New Visualization Framework of Job
Scheduling in Grid Computers
M. A. Awad
El-bayoumy
Faculty of Computer& Information Mansoura University,
Egypt
M. Z. Rashad
Faculty of Computer& Information Mansoura University,
Egypt
M. A. Elsoud
Faculty of Computer& Information Mansoura University,
Egypt
M. A. El-dosuky
Faculty of Computer& Information Mansoura University,
Egypt
ABSTRACT
Job scheduling is one of important topic in grid computing field the goal of scheduling is that it achieves the highest possible level of productivity and the need for matching system application with the computing resources available. The proposed is an implementation for imagination to fish swarm, job dispatcher and Visualization gridsim to execute some jobs.
KEYWORD
AFSA, Grid computing, scheduling, visualize, simulate, dispatcher, fish swarm.
1.
INTRODUCTION
Grid computing [1] [2] has become clear as the next generation parallel and distributed computing methodology. Example is to provide SOA infrastructure to enable easy access to the coordination and sharing of resources geographically distributed in solving various types of parallel applications on a large scale. Now days, grid computing has been accepted widely, study, and pay attention to by researchers [3]. Unlike traditional file sharing, and support from the Web or peer- to -peer systems, users in the network can access resources or services required in a transparent manner as if they were in the use of resources or local services. However, it leads to any two or more of the ideas of conflict between users and providers of network resources usage policy of local resources. Users , in addition to the simplicity and ease , to get the service functions desirable , and some of the quality of Service (QoS) targets associated with the service, such as reliability, service network [4] , the financial cost of the resource , and the efficiency of the network service , you can specify when the service is provided . On the other hand, resource providers and receive compensation from the users of the network resources consumed at the price of sacrificing the local task execution [5].
2.
ARTIFICIAL
FISH SWARM
ALGORITHM
Mathematical models imitate the fish swarm [6] [7] series of behavior in nature which can be defined as:
1. Random behavior 2. Searching behavior 3. Swarming behavior 4. Chasing behavior 5. Leaping behavior
The next behavior of artificial fish depends on its current state and environmental state. Random behavior can be presented as the initialization phase of the algorithm. The crucial step in
the AFS algorithms is a “visual scope”. A basic biological behavior of any animal is to discover a region with more food, by vision or sense. Depending on the current position of the individual in the population, marked as , three possible
situations may occur [8]:
1. When the “visual scope” is empty, and there are no other individuals in its neighborhood to follow, individual moves randomly searching for a better region
2. When the “visual scope” is crowded, the individual has difficulty to follow any particular individual, and searches for a better region choosing randomly another location from the “visual scope”.
3. When the “visual scope” is not crowded, the individual can choose between two options: to swarm moving towards the central or to chase moving towards the best location. The condition that determines the crowd issue of individual in the ‘visual scope’ is given in
Equitation 1:
Where is the crowd parameter, is the number of individuals in the population and is the number of individuals in the “visual scope”. In the searching behavior phase, an individual is randomly chosen in the “visual scope” of and a movement towards it is carried out if it improves current location. Otherwise, the individual moves randomly. The swarming behavior is characterized by a movement towards the central point in the “visual scope” of . The swarming behavior is progressive stage that is activated only if the central point has a better function value than the current . Otherwise, the point follows the searching behavior. The chasing behavior presents a movement towards the point that has the last function value, . The swarm and chase behavior can be considered
as local search. Leaping behavior solves the problem when the best objective function value in the population does not change for a certain number of iterations. In this case the algorithm selects random individual from the population. This process empowers algorithm for obtaining better results in solving numerous problems.
3.
DEFINITION OF LEVY FLIGHT
Figure 1 : Levy Flight
Definition:
The probability density function of the Levy distribution over the domain is
(1)
Where µ is the location parameter and is the scale
parameter. The cumulative distribution function is
(2)
Where is the complementary error function? The shift parameter µ has the effect of shifting the curve to the right by an amount µ, and changing the support to the interval . Like all stable distributions, the Levy distribution has a standard form which has the following property:
Where y is defined as
(3)
4.
PREVIOUS WORK
4.1. GridSim
[11]:GridSim is a software platform which enables users to model and simulate the properties of network resources and networks with different configurations. GridSim is of great value to both students and experienced researchers who wish in the study of networks, or algorithms and test new strategies in a controlled environment. Using GridSim, they are able to perform experiments and studies that are not possible in the real dynamic network environment for replication.
4.2.
SimGrid
[12]:SimGrid is a toolkit that provides core functionalities for the simulation of distributed applications in heterogeneous distributed environments. The specific goal of the project is to facilitate research in the area of distributed and parallel application scheduling on distributed computing platforms ranging from simple network of workstations to Computational Grids.
4.3.Fast artificial fish swarm algorithm
[14] In the AFSA, there are many parameters that have impacts on the final optimization result, in this paper; we only consider the parameter we will use Brownian motion and Levy flight AlgorithmsThere is a recent study that analyzes job scheduling in grid computing [13]
5.
PROPOSED FRAMERORK
5.1.
Fish swarm
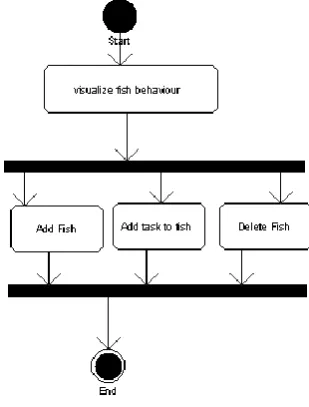
A lot has been heard about fish swarm algorithm, but so far, no application shows how the fish moves. The proposed application is to visualize a number of fish that swarm in random way and can add fish and each fish carries a task to execute.
Figure 2 : Fish swarm simulator diagram
Fish number can be specified, also fish task and ability to delete fish or add new fish with a new task
5.2.
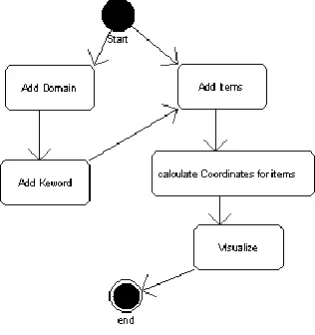
Dispatcher
The dispatcher will work with other members of the distribution team to increase company profitability and customer satisfaction by efficient and cost-effective scheduling of deliveries and routing of trucks.
The dispatcher determines the coordinates of each task based on keywords and this will reduce dimensionality which saves the time for clustering and classification tasks.
Input: There will be a folder known as Fields, and inside the folder for each field (Math, texts, etc.) and within each field of text files (notepad). The name of text file is a keywords or operations and there is another folder named Item, inside the item folder there are text files, each file is a task, and contains a set of keywords names and the domain name which specializes the task.
Output: Software is required to calculate each item Coordinates (x, y) based on the names of the keywords
Example: Assuming that keywords in the field are:
a b c d e f j h i j
Assuming that keywords in the message are:
[image:2.595.346.501.210.414.2]A value of 1 to express a word and a value of 0 for their absence:
a b c d e f j h i j
1 1 1 0 0 1 0 1 0 0
Because the number of words will be very large, a division for the previous matrix into two or four matrixes is proposed as the following:
First part (lower):
a b c d e
1 1 1 0 0
1+2+4 = 7
Second part (upper):
f j h i j
1 0 1 0 0
1+4=5
Calculated values will be transferred from binary to decimal system for each matrix.
(00111) binary= (7) decimal
[image:3.595.352.472.208.539.2]The remaining two digits could be used as the circle center coordinates that represents the task(x,y) .
Figure 3 : Dispatcher Diagram
5.3.
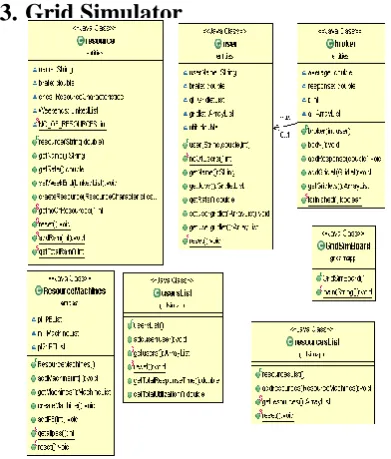
Grid Simulator
The Grid Simulator toolkit allows modeling and simulating of entities in parallel and distributed computing (PDC) systems-users, applications, and resource broker (schedulers) for design and evaluation of scheduling algorithms. A resource can be a single processor or multi-processor with shared or distributed memory and managed by time or space shared schedulers. The processing nodes within a resource can be
heterogeneous in terms of processing capability, configuration, and availability.
The idea of this software is to visualize simulate grid and make easy to add resources and number of jobs and show the Statistics about each job and resources.
First: the number of users and the number of resources to work with should be specified.
Second: number of machines should be specified for each resource and number of P.E for each machine, also P.E rating and number of jobs for each user.
Figure 4 : Grid Simulator
6.
IMPLEMENTATION
6.1.
Fish swarm
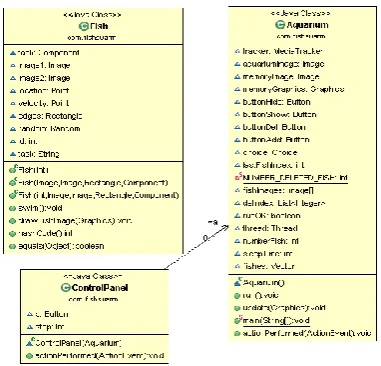
[image:3.595.88.246.454.622.2]Figure 5 : Class diagram for fish swarm
Figure 6 : Fish swarm Screen Shot for fish simulator
[image:4.595.320.537.75.292.2]6.2.
Dispatcher
[image:4.595.316.555.343.522.2]
Figure 7 : Class diagram for dispatcher
Figure 8 : Dispatcher main Screen
[image:4.595.315.556.556.718.2]6.3.
Grid Simulator
[image:5.595.64.260.73.303.2]Figure 10 : Grid Simulator calss diagram
Figure 11 : Grid Simulator Setting
Figure 12 : Grid Simulator result
Table 1. Comparison between simgrid, gridsim and proposed system
SimGrid GridSim Proposed system
CPU coarse d.e.s. coarse d.e.s. coarse d.e.s.
Disk - fine d.e.s. fine d.e.s.
Network math/d.e.s. fine d.e.s. fine d.e.s. Application d.e.s./emul coarse d.e.s. coarse
d.e.s. Requirement C or JAVA JAVA JAVA Setting controlled controlled controlled Scale few 10 000 few 100 few 100
GUI - - yes
7.
CONCLUSION
This paper presents three frameworks, one for visualizing the behavior of fish swarm (The basic idea of AFSA is simulated fish behaviors such as swarming, preying, following with local search of fish individual for reaching the global optimum; it is random and parallel search algorithm). The second for visualizing grid simulator that uses gridsim framework as grid simulator (the ability to add resource, user and number of tasks has been added, and represent information about each task such as execution time, waiting time ,.. Etc.), also comparison between this and girdsim and grid simulator. The third framework is dispatcher that determine the coordinates of each task Based on keywords and that will reduce dimensionality which saves time for clustering and classification tasks.
8.
FUTURE WORK
Future work has many dimensions. One dimension is to consider the application of the proposed framework on data from real world tasks such as from distributed systems as banks. Another dimension is extending the scope of the framework to cloud based environment. Another dimension is to enhance the accuracy of the framework by enhancing the underlying algorithms. This may be done by combining the fish swarm with any other heuristics.
9.
REFERENCES
[1] Reed, D.A. “Intelligent Monitoring for Adaptation in Grid Applications” Mendes, C.L.; Proceedings of the IEEE Volume 93, Issue 2, Feb 2005 , PP: 426 – 435.
[2] SaeedParsa and Reza Entezari-Maleki , "RASA: A New Grid Task Scheduling Algorithm", International Journal of Digital Content Technology and its Applications,Vol. 3, pp. 91-99, 2009.
[3] P. Brucker, Scheduling Algorithms, Fifth Edition, Springer Press, 2007.
[4] Joshy Joseph and Craig Fellenstein, Grid Computing, Prentice Hall Professional, 2004.
[5] D.I. George Amalarethinam and P. Muthulakshmi, "An Overview of the scheduling policies and algorithms in Grid Computing ", International Journal of Research and Reviews in Computer Science, Vol. 2, No. 2, pp. 280-294, 2011.
[image:5.595.72.283.480.699.2][7] Xiao, J.M., Zheng , X.M., Wang , X.H.: A Modified Artificial Fish-Swarm Algorithm. Proc. of IEEE the 6th World Congress on Intelligent Control and Automation, Dalian China, 2006, pp.3456-3460.
[8] Jiang, M.Y., Yuan, D.F.: Wavelet Threshold Optimization with Artificial Fish Swarm Algorithm. Proc. of IEEE International Conference on Neural Networks and Brain, Beijing China, 2005,pp.569 -572.
[9] Li, X.L.: A New Intelligent Optimization-Artificial Fish Swarm Algorithm. Doctor thesis, Zhejiang University of Zhejiang, China , 2003.
[10] Mr Saeed Farzi “Efficient Job Scheduling in Grid Computing with Modified Artificial Fish Swarm Algorithm” International Journal of Computer Theory and Engineering, Vol. 1, No. 1, April 2009 1793-821X.
[11] R. Buyya, and M. Murshed, "GridSim: A toolkit for the modeling and simulation of distributed resource
management and scheduling for grid computing," Journalof Concurrency and Computation Practice and Experience, pp 1175–1220, 2002.
[12] Wagner Kolberg, Julio C.S. Anjos, Pedro de B. Marcos, Alexandre K.S. Miyazaki, Claudio R. Geyer, and Luciana B. Arantes. MRSG - A MapReduce simulator over SimGrid. Parallel Computing. 2013.
[13] M A Awad, M Z Rashad, M A Elsoud and M A El-dosuky. Article: Visualization of Job Scheduling in Grid Computers. International Journal of Computer Applications 74(8):37-40, July 2013. Published by Foundation of Computer Science, New York, USA.