Static vs Dynamic Techniques for Selectivity Evaluation
in Distributed Query Optimization
Surbhi Bansal
Research Scholar Department of Computer Science and Engineering Guru Nanak Dev University,
Amritsar, Punjab
Rajinder Singh Virk
Assistant Professor Department of Computer
science and engineering Guru Nanak Dev University,
Amritsar, Punjab
ABSTRACT
In distributed database query optimization, query optimizers have traditionally relied upon statically estimated table cardinalities when evaluating the cost of the query plans. This paper analyses static vs. dynamic calculation for selectivity of intermediate relations generated in query processing. The objective of this research is to overcome the disadvantages of previously formulated static methods which are relatively inaccurate in a distributed database environment. A Dynamic selectivity evaluation tool (DSET) has been proposed to optimize cost for a distributed database query processing environment. The results have shown that dynamic evaluation of selectivity factor of sub query operation is feasible and can significantly reduced the total query cost than its static estimation.
Keywords
Distributed database, query optimization, cardinality, database statistics, selectivity factor, static Model, DSET etc
1.
INTRODUCTION
For the past twenty years, Distributed database systems design and query optimization has been an active studied area of database system research [1]. Query optimization refers to the process of ensuring that either the total cost or the total response time for a query is minimized. Most modern cost-based optimizers decide between execution plans by minimizing the estimated cost of executing the query. A basic technique used in cost estimation is pre-estimation of Selectivity factor. Optimizers take the cardinalities of base tables along with their instances at the leaves of a query tree as an input and then use pre-computed selectivities of operators in the tree to estimate the cardinality of the input to operators further up in the tree [2][3]. The base relations involved in a distributed query may be fragmented and/or replicated, thereby inducing communication overhead costs.
2.
RELATED WORK
Stratis D. Viglas et al. have proposed shifting from a cardinality-based approach to a rate-based approach, and give an optimization framework that aims at maximizing the output rate of query evaluation plans. This approach can be applied to cases where the cardinality based approach cannot be used[2].
Faiza and Yahya have proposed a statistical technique for estimating the size of the resulting relation obtained by relational operator by using sample based estimation that
execute the query to be optimized on small samples of real database and use the results obtained by these trials to determine cost estimates [4].
Gurvinder Singh et al. have proposed a stochastic model simulating a Distributed Database environment and shown benefits of using innovative Genetic Algorithms (GA) for optimizing the sequence of sub-query operations allocation over the Network Sites. Also, the effect of varying Genetic Parameters on Solution’s quality is analyzed [6].
Fan and Mi Xifeng have designed a new algorithm based on the heuristic optimization that can significantly reduce the amount of intermediate result data. The basic idea of this algorithm is based on relational algebra equivalence transformations to raise the connecting and merging operations in the query tree [7].
Rajinder singh et al. has highlighted a design of a probabilistic solution to the operation allocation problem of Distributed Databases. They highlight the design and implementation of one such model, Genetic Algorithm for sub query Allocation (GA_SA), which is modest effort to stochastically simulate optimization of retrieval transactions for a distributed database query [8].
William I.Grosky et al .uses an adaptive selectivity estimation scheme for multidimensional queries which performs better than non-adaptive methods when the distribution of the data is not known. This research overcomes the disadvantages of previously formulated non-adaptive, static methods which are relatively inaccurate in a dynamic database [9].
Manik Sharma et al. performed the comparative analysis of static and dynamic metric for structured programming environment. With the help of conventional static metrics its not able to analyze various facts of software’s. It is very important to understand the dynamic behaviour of the program or an application in developing new effective strategies in computer science. This becomes the basis for working on dynamic metrics in place of traditional static metrics. [10].
Ridhi kapoor has described the selectivity and cost estimates in query optimization in distributed databases. They have discussed the various cost formulations to evaluate the cost of execution plans and then executing the plan with the minimum cost to the objective function [12].
Carlo et.al has proposed a method for estimating the size of relational query results. The approach is based on the estimates of the attribute distinct values. In particular, the capability of analytic method to estimate selectivity factors of relational operations is considered. They also presented some experimental results on real databases which show the promising performance of analytic approach [13].
3.
DISTRIBUTED QUERY
OPTIMIZATION
In distributed query optimization, one of the major components is generation of sub-query allocation plan. A complex, high level distributed query is divided into a sequence of smaller, simpler sub-queries. Original query and low level query should have the same syntax that is producing the same results. In order to reduce total cost of the query, these sub-queries need to be executed on various different sites of distributed database. The total cost that will be occurred in processing the query is a good measure of resource consumption. In a distributed database system, the total cost includes CPU, I/O and communication cost that needs to be minimized. An optimizer’s cost model includes cost functions to predict the cost of operators, statistics, base data and formulas. The cost is in the terms of execution time, so a cost function represents the execution time of a query [1][5]. A good query execution strategy generated by query optimizer involves three phases. First is to find a search space which is a set of alternative execution plans for query. Second is to build a cost model that compares costs of different execution plans. Finally, it explores a search strategy to find the best possible execution plan among all alternative execution plans using cost model [1].
Query optimization provides an immediate way of answering queries for which the size of answer is of interest in its own right. The size of the intermediate relations that are produced during the execution is the main factor affecting the performance of a query execution strategy [5]. The size of the intermediate relations is based on the evaluation of selectivity factor of sub-operations. Selectivity factor tells number of tuples remains in the resultant relation.
4.
SELECTIVITY ESTIMATION OF
SUB-QUERIE OPERATIONS
Selectivity estimation is the main part of query optimization. The selectivity factor of an operation is the number of tuples of an operand relation that participate in the result of that operation. It is denoted by SFOP, where OP represents the operation. The selection of the plan is usually based on the cost estimates of alternative plans, which in turn are based on the selectivity estimates of relational operators. Selectivity evaluation depends on cardinality of intermediate fragments generated in the query. The selectivity estimation is based on statistical information about the base relations and formulas to estimate the cardinalities of the results of the relational operations [4]. There is a direct relationship between the precision of the statistics and the cost of managing them.
4.1
Selectivity formulations
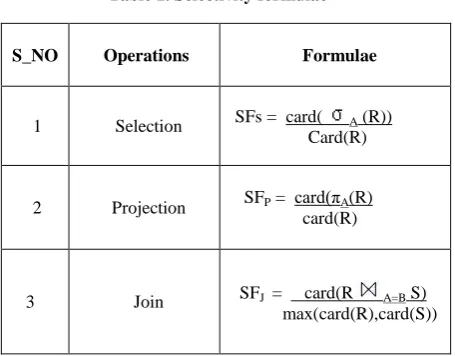
The following formulae for relational operations were used to evaluate selectivity factor of various sub-query operations
[image:2.595.321.549.138.316.2]like selection, projection and join as per Ozsu’s Model [1]. Here ‘SF’ and ‘A’ , represents selectivity factor and attribute respectively, ‘card’ represents cardinality of result and ‘R’ and ‘S’ represent two relations[5].
Table 1. Selectivity formulae
4.2
Database Statistics
The estimation of size of intermediate results of relational algebra is based on statistical information about the base relations and formulae to predict the cardinalities of the result of relational sub operations. Sequence of operations is pre-fixed before computing cardinality of relations.
No of base relations = 3
No of operations = 9
Site of query=3rd
No of fragments (B1,B2, B3…………F11)=11.
No of sites =3
The size of each tuple of the relation is presumed to be 1KB.Size of the relation is calculated as:
Size of a relation = tuple size * number of tuples in a relation.
Size of B1, B2 and B3 base relations = 150 KB, 150 KB and 100 Kb respectively.
I/O, CPU and communication coefficients are relative coefficients.
I/O speed coefficients = [1, 1.1, 1.2]
CPU speed coefficients = [1.1, 1, 1]
Communication speed coefficients= [0 20 10; 20 0 30; 30 20 0]
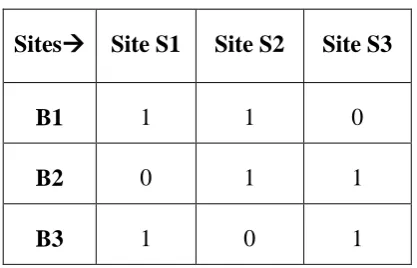
Data allocation matrix represents allocation of 3 base relations to different sites.’1’ represents that table is allocated to the site and ‘0’represents absence of table on that particular site. Replication of data is considered.
S_NO Operations
Formulae
1 Selection SFs = card( A (R))
Card(R)
2 Projection
SFP = card(πA(R) card(R)
3
Table 2. Data Allocation Matrix
Table5. B3 Relation
4.4 Query
4.3
Database example
These three base relations are created in MS-ACCESS database. Each table has 5 columns in which S_NO is taken as a primary key and number of tuples on which query is executed to evaluate results.
Table 3. B1 Relation
Table4. B2 Relation
S_NO Product_cod e
Book_name Subject Price
151 10000377 Circuit
Theory Engineering 250
152 10000312 Civil Engg Engineering 360
153 10000512 Commn
skills Engineering 565
154 . . 300
10000546
10A00251
Electrical machines
Electronic devices
Electrical
Engineering 391
. . 410
Price ((( Subject, Price ( Price>180 AND Price<950 (B1))) XPrice=Price( Subject, Price( Price>230 (B2))))XPrice=Price((
Price( Price>150(B3)))
4.5 Operator Tree Representing
Fragments and Operators
The set of operations (sub-queries) generated in response to a query can be represented by an operator tree. Leaves of the tree represents base relations B1, B2 and B3 created in MS-ACCESS. Nodes of operator tree represent various operations and lines represent cost (based on size of fragment) of operation sequence. A site’s Local CPU and I/O costs are proportional to the size (in bytes) of data processed and communication costs depend on communication coefficients between a pair of sites and bytes of blocks moved between the sites [5].
No of Operations: O1, O2…O9
Last operation is to move the fragment to site of query.
Total no of fragments: B1, B2….F11.
Base relations: B1, B2, B3.
Sites
Site S1
Site S2
Site S3
B1
1
1
0
B2
0
1
1
B3
1
0
1
S_NO Product_code Book_name Subject Price
301 10A00045 Commn engg Engineering 325
302 10000184 Robotics Engineering 400
303 10000261 Eng sem1 English 300
304 .
. 400
10C00425
14000569
Discrete maths
BSC maths
Mathematics
Mathematics
450 . .
525
S_NO Product_code Book_name
Subject Price
1 03C0033 Microbiology Biology 575
2 04000263 Remedial
Biology Biology 110
3 04000264 Polymers Chemistry 391
4 . . 150
04000265
10A00344
Applied Chemistry
Business Studies
Chemistry
Commerce 400
[image:3.595.47.256.108.242.2]5.
STATIC MODEL FOR SELECTIVITY
ESTIMATION
Many traditional query processing strategies in distributed databases are static in nature i.e., cost of the query is completely determined on the basis of a priori estimates of the selectivity factor of sub query operations and it remains unchanged throughout its execution [6]. Due to this, the cardinality of intermediate fragments is large.
The main task of the pre-existing simulator is to allocate sub operations to sites based on the database statistics assuming a set ‘S‘ of data distribution sites, a set ‘R‘ of relations/fragments stored on those sites[8]. In this simulator, the following array of selectivity factor of sub-operations of the query is statically fed to the simulator as an input data file.
Selectivity factor of various sub-query operations = [0.76, 0.76, 0.76, 0.88, 0.88, 0.88, 0.35, 0.22].
For each operation, the size of intermediate fragment is calculated by use of prefixed selectivity values for those operations [8].
B1,B2 and B3 are first three fragments on which operations are applied.
Operation 1:
( Price>180 AND Price<950 (B1))→F4, Tuples: 150 x 0.76(Ps) = 114
Operation 2:
( Price>230 (B2)) →F5, Tuples: 150 x 0.76(Ps) = 114
Operation 3:
( Price>150(B3))→F6, Tuples: 100x 0.76(Ps) = 76
Operation 4:
( Subject, Price (F4)) →F7, Tuples: 114x 0.88(Pp) = 100
Operation 5:
( Subject, Price (F5)) →F8, Tuples: 114 x 0.88(Pp) = 100
Operation 6:
( Price (F6)) →F9, Tuples: 76 x 0.88(Pp) = 67
Operation 7:
(F7 F8) (Price=Price) → F10, Tuples: 100x 0.40 (Pj) = 40
Operation8:
(F10 F9) (Price=Price) →F11, Tuples: 67x 0.25(Pj) = 17
6.
DYNAMIC SELECTIVITY
ESTIMATION
Dynamic selectivity estimation tool (DSET) is a small proposed simulator which feeds to the main pre-existing simulator that allocates sub-queries to various sites. The major aim of the DSET is to evaluate selectivity factor of sub-query operations at run time that can further estimate the intermediate fragment sizes of the similar kind of queries and thus can also reduce the response time of that queries.
Steps involved are:
This simulator created three base relations B1, B2 and B3 in MS ACCESS, populated them with instance data. Number of rows are inserted to the relations in order to calculate size of the base relations and to perform sub-operations to calculate cardinality of the resultant relations.
Then, MATLAB-ACCESS interface is created by using a connection string in MATLAB.
s=adodbcnstr ('Access',[ cd 'path of database']);
cn = adodbcn(s);
After creating a connection, SQL code is embedded for selection, projection and join operations and estimated the size from generated fragments. SQL code for selection operation and also evaluating cardinality of the resultant relation and thus selectivity factor at run time.
x='SELECT * FROM B1 where Price>180 AND Price<950';
F4 = adodbquery (cn, x);
card4=length (F4);
SF4 = card4/B1;
A matrix is created representing operations executing on various fragments.’1’ represents particular operation is applied on fragment and ‘0’ represents vice versa.
Then selectivity factor for all sub-query operations is used to evaluate the total cost of the query.
Total cost of the query = local (I/O and CPU) cost + communication cost.
IO_cost is calculated as:
Here, io_speed (s) represents I/O speed coefficient of particular site where operation is performed and ‘i’ represents particular fragment generated after applying operation. This I/O cost is calculated for every fragment generated while executing query. Similarly, CPU_cost is calculated.
unary_io = unary_io + io_spd(s)* frag_size (i);
IO_cost for join operations:
join_io = join_io + io_spd(s)* frag_size(i)+ io_spd(s)* frag_size(i+1)+ io_spd(s)* frag_size(i)* frag_size(i+1) ;
total_io_cost= (unary_io + join_io);
Communication_cost is calculated as:
commn_cost = commn_cost + frag_size (i) * comm_speed (site1, js) + frag_size(i+1)* comm_speed(site2,js);
In case of DSET, cardinality is evaluated for intermediate results of the query by calculating selectivity factor at run time using selectivity formulae in table1. The overall cost of the query is directly proportional to the cardinality of the intermediate results [5]. This approach can evaluate the cost of the query more accurately.
The fundamental difference from static model was that instead of feeding input data file giving intermediate fragment sizes, the operations are implemented in MATLAB/SQL code created intermediate relations and cardinality of those relations are used to calculate the selectivity factor of operations. Then this selectivity is dynamically fed to the operation allocator main simulator.
6.1
Experimental data
[image:5.595.314.546.488.643.2]After applying sub-operations (selection, projection and join) on B1, B2 AND B3 relations mentioned above, sizes of intermediate relations found to be:
Table 6: Size of intermediate relations Relations Size(KB)
B1 150
B2 150
B3 100
F4 91
F5 93
F6 63
F7 73
F8 67
F9 50
F10 23
F11 9
Operation 1:
Selectivity factor of selection operation on relation B1 generating fragment F4
SFs (B1) = card (F4)
Card (B1)
SFs = 91/150 =0.60
Operation 2:
Selectivity factor of selection operation on relation B2 generating fragment F5
SFs (B2) = 93/150 =0.62
Operation 3:
Selectivity factor of selection operation on relation B3 generating fragment F6
SFs (B3) = 63/100 =0.63
Operation 4:
Selectivity factor of projection operation on fragment F4 generating fragment F7
SFP (F4) = card (π Subject, Price (F4)
Card (F4)
SFp = 73/114 = 0.80
Operation 5:
Selectivity factor of projection operation on fragment F5 generating fragment F8
SFp (F5) = 67/114= 0.72
Operation 6:
Selectivity factor of projection operation on fragment F6 generating fragment F9
SFp (F6) = 50/63= 0.79
Operation 7:
Selectivity factor of join operation on fragments F7 and F8 generating fragment F10
SFJ (F7, F8) = card (F7 Price=Price F8)
Max (card (F7), card (F8))
SFJ = 23/max (73, 67) = 0.31
Operation8:
Selectivity factor of join operation on fragments F10 and F9 generating fragment F11
SFJ = 9/max (23, 50) = 0.18
7.
EXPERIMENTAL RESULTS
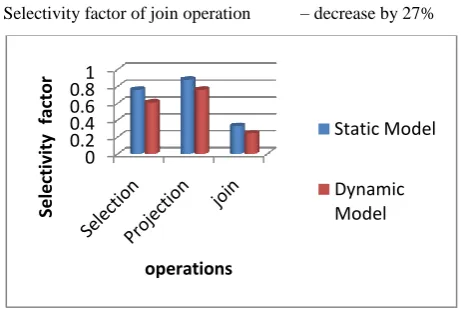
It highlights the fact that dynamic selectivity evaluation tool(DSET) reduces the overall cost of the query by dynamically calculating the cardinality of intermediate relations more accurately. It is observed that dynamic model overcomes the drawbacks of the static method. Experimental results have shown that evaluation of selectivity factor at run time is more accurate as compare to the static estimation of selectivity factor. The result shows a difference of 20%, 14%, 27% approximately.
Selectivity factor of selection operation – decrease by 20%
Selectivity factor of projection operation – decrease by 14%
Selectivity factor of join operation – decrease by 27%
Fig1: Static vs. Dynamic model for selectivity evaluation
8.
CONCLUSION
The objective of the experimental work was to analyze the effect of dynamic method for selectivity evaluation on the reduction of overall cost of the query. The benefit of using DSET was that size of intermediate relations evaluated more accurately than static method. Therefore, it resulted into lesser cost of sub-query. Finally, when cost of all sub-query operations on the various sites are added, the benefits
0 0.2 0.4 0.6 0.8 1
Sele
ct
ivit
y
fa
ct
or
operations
Static Model
achieved in the range of fourteen to twenty seven percent for various sub-operations like selection, projection and join.
9.
REFERENCES
[1] M.Tamer ozsu, Patric Valduriez ”Principles of Distributed Database Systems”, springer, 2010.
[2] Stratis D. Viglas, Jeffrey F. Naughton “Rate-Based Query Optimization for Streaming Information”, ACM, 2002 .
[3] Danh Le-Phuoc1, Josiane Xavier Parreira, Michael Hausenblas, Manfred Hauswirth” Continuous Query Optimization and Evaluation Over Unified Linked Stream Data and Linked Open Data”,DERI,2010.
[4] Faiza Najjar and Yahya slimani” Cardinality estimation of distributed join queries”2002.
[5] Surbhi bansal, sofia gupta and Rajinder singh virk, “Selectivity Evaluation in Distributed Database Query Operations: Static vs Dynamic techniques”,IJCAIT,2014.
[6] Rajinder Singh, Gurvinder Singh, Varinder Pannu virk, ”A Stochastic Simulation of Optimized Access Strategies
for a Distributed Database Design”, IJSER, November2011.
[7] Fan Yuanyuan, Mi Xifeng”Distributed database System Query Optimization Algorithm Research”, IEEE, 2010.
[8] Rajinder Singh, Gurvinder Singh, Varinder Pannu virk” Optimized Access Strategies for a Distributed Database Design”, IJDE, 2011.
[9] William I. Grosky, Junping Sun, Farshad Fotouhi “Dynamic selectivity estimation for multidimensional queries”,springer, 1993.
[10] Manik Sharma and Dr. Gurdev Singh, “Analysis of Static and Dynamic Metrics for productivity and Time Complexity”,IJCA, 2011.
[11] Areerat Trongratsameethong, Jarernsri L. Mitrpanont,” Exhaustive Greedy Algorithm for Optimizing Intermediate Result Sizes of JoinQueries”, IEEE, 2009.
[12] Ridhi kapoor,” Cost Estimates & Optimization of Queries Distributed Databases”, IJERT, June 2013.