Pattern Synthesis of Linear Array with Position and
Position-Amplitude Control using Firefly Algorithm
T Pavani
Department of ECE AU College of Engineering (A)
Andhra University Visakhapatnam, India
G S N Raju,
Ph.D Department of ECE AU College of Engineering (A)Andhra University Visakhapatnam, India
P V Sridevi,
Ph.D Department of ECE AU College of Engineering (A)Andhra University, Visakhapatnam, India
ABSTRACT
It is well known that several methods are reported to design array antennas for the generation of radiation patterns. It is found that none of them are optimum. However, in the present work, a new swarm intelligence method Firefly algorithm is applied for their optimization. Both uniform and non-uniform arrays are considered. The power patterns are numerically computed for different arrays and they are presented in θ-domain.
Keywords
Linear array, pattern synthesis, Firefly algorithm
1.
INTRODUCTION
Array antenna is one of the best choices to meet the requirements of gain, directivity and radiation pattern shapes. It can be linear, circular, rectangular and spherical etc. In addition to these geometrical configurations, the radiation pattern can be controlled by optimizing amplitude excitation of individual elements, phase excitation, relative displacement between elements and element pattern. Most array antennas employ equal and resonant spacing between adjacent elements. It is possible however, to operate array antennas with non-uniform (or) unequal spacing between adjacent elements [1].
Synthesis of nonuniformly spaced arrays has become an interesting problem in recent years compared with uniformly spaced arrays. A nonuniformly spaced array can be used to reduce the size, weight and number of elements in the array also to reduce complexity and cost. They have wide range of applications in radar, sonar, wireless communication and other areas. One example of using an unequally spaced array is to prevent grating lobes or to obtain a better performance than a uniform array.
The analysis of nonuniformly spaced arrays was first presented by Unz [2], who employed a matrix formulation to evaluate current distribution necessary to generate a prescribed radiation pattern. R.F Harrington [3] reported perturbation procedure to reduce the sidelobe level down to 2/N times of the field intensity of the main lobe, N being the total number of elements.
Ishimaru [4] used the Poisson’s sum expansion to design an unequally spaced uniform amplitude array with any desired sidelobe level, resulting in grating lobe suppression. Skolnik proposed a technique based on dynamic programming approach that shows the density of elements located within a given array length is made proportional to the conventional equally spaced array [5]. In [6], non-resonant spacing is proposed to produce sector beams from thick arrays. In
addition to these methods, many numerical, analytical, and optimization methods of pattern synthesis of antenna arrays have been reported by several authors in the literature.
Many techniques have been proposed for pattern synthesis by optimizing the amplitudes alone [7 – 8] or by optimizing position of the elements alone [9 – 11]. In [12– 13], both the amplitude coefficients and position of the elements are optimized separately.
To reduce the design complexity, many researchers focused on symmetrical arrays [14 – 17] and techniques confined to inter-element spacing for a finite set of values [18-19]. But, the constraint on the array being symmetrical reduces the degree of freedom of the optimization process. Optimization of amplitude alone and position of the elements alone [20], phase and position [21] were also reported in the literature.
The distribution and height of the sidelobes in a beam pattern of nonuniformly spaced array depends on the position of the elements and on amplitude excitation coefficients of each element. Hence, it is necessary to select best position and best amplitude coefficient for each element of nonuniformly spaced array to obtain the desired shape of the pattern. Sometimes, it becomes difficult to improve performance with these traditional methods. Therefore, in the present work, an attempt is made to optimize the amplitude and position of elements simultaneously so as to reduce the sidelobe level.
A new evolutionary optimization method, Firefly algorithm
(FA) is used for the synthesis of linear array to obtain the lowest relative side lobe level. The algorithm is based on flashing behavior of tropic Firefly swarms. The merit of the algorithm is that it can deal with continuous variables in multi dimensional spaces [22].
models, numerical results are provided in section 4 and finally the paper is concluded in section 5.
2.
PROBLEM FORMULATION
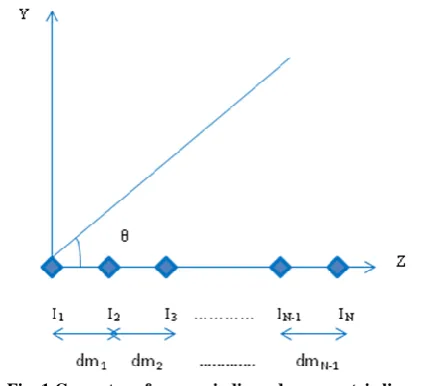
Assume an aperiodic and asymmetrical linear array with N isotropic elements as shown in Fig 1. The array factor AF
[image:2.595.58.280.149.342.2]can be characterized as
Fig. 1 Geometry of an aperiodic and asymmetric linear array
1 N
0 n
n n
F
I
exp
jkd
cos
A
(1)
Where I= [I1,I2,……IN], Ii represents the amplitude excitation
of the ith element of the array, dm=[dm1,dm2,……dmN-1], dmi
represents the distance from element i to element i+1, i.e., d1=0; d2=dm1; d3=d2+dm2; d4=d3+dm3; …… dN = dN-1+dmN-1,
k = 2π/λ= phase constant,
θ = angle of incidence of a plane wave, λ = signal wavelength,
N = total number of elements in the array.
Normalized power pattern in dB can be expressed as follows
max F
F 10
A A log 20 P
(2)
The objective of optimization is to minimize the sidelobe level of the array pattern by adjusting the parameters. Thus the cost (or fitness) function is defined as follows.
o FF S
A A max f
(3)
Here S is the space spanned by the angle θ excluding the main lobe and represents the parameter vector such as element positions and amplitudes. Therefore can be written as follows:
d
n,
I
n
,
0
n
N
1
(4)The objective function described above minimizes all the sidelobe levels and maximizes the power in the main lobe located at o.
3.
FIREFLY ALGORITHM
Firefly algorithm is one of the newest meta-heuristics, developed by Yang in 2008. FA uses the following three idealized rules [23].
Fireflies are unisex, so that one firefly will be attracted to other fireflies regardless of their sex.
Attractiveness is proportional to firefly brightness. For any couple of flashing fireflies, the less bright one will move towards the brighter one. The attractiveness and brightness decreases as their distance increases. If there is no brighter firefly than a particular one, it will move randomly in the search space.
The brightness or light intensity of a firefly is influenced by the landscape of fitness function.
The algorithm uses swarm of N, D dimensional parameter vectors as a population for each generation. For the current problem, each swarm in general represented by two vectors of real numbers restricted to be on the range [0,1], i.e. I = [I1,I2,I3,……..IN] and another one restrained on the range
[0.5λ,1λ], i.e. d = [d1,d2,d3,…..dN].
The position of ith firefly is denoted by a vector
D
n d i 3 i 2 i 1 i
i
x
,
x
,
x
,...,
x
,...
x
x
here, I = 1,2,3,……N and d = 1,2,3,……N.
(5)
The search space is limited in Dth dimension by the following
in equality
d high d i d
low
x
x
x
(6)The value of the variables
x
dlow andx
dhigh depends on the optimization problem. Initially, the positions of the fireflies are generated from a uniform distribution using the following equation:
x x
*rand xxdi dlow dhigh dlow (7)
In order to design FA, two important issues need to be defined: (a). the variation of light intensity, (b). Formulation of attractiveness. In the FA, the light intensity I of a firefly is proportional to the value of fitness function I(s) α f(s), where s denotes solution.
The light intensity I(r) varies according to the following equation:
2o
exp
r
I
r
I
(8)Where Io represents the light intensity of source and γ is the
light absorption coefficient which can be taken as constant. The firefly’s attractiveness is proportional to the light intensity seen by adjacent fireflies. Therefore, the attractiveness β of a firefly is defined by
2 ij o*exp rr
(9)
The distance between any two fireflies xi and xj are expressed
as the Cartesian distance
n
1 k
2 jk ij j
i
ij x x x x
(10)
The movement of a firefly i is attracted to another brighter firefly j is given by the following equation:
r *
x x
*
rand 1/2
exp * x
x j i
2 ij o
i
i (11)
In the above, the first term is the current position of ith firefly. The second term is due to the attraction to another more attractive firefly and in the third term is randomization parameter controlling the step size. Here, rand is a random number generator uniformly distributed in between 0 and 1. The brightness and the attractiveness of each firefly are calculated at each iterative step. Based on these values the positions of the fireflies are updated. All fireflies converge to the best possible position on the search space after a sufficient amount of iterations.
4.
RESULTS
In the present work, FA is applied for the synthesis of linear array using position only synthesis and the position -amplitude synthesis. For both cases, the prior limits assumed in the minimum and maximum distance between the elements are dmin = 0.5λ and dmax = 1λ. The number of elements
considered for the FA based synthesis is 20; thus the number of parameters to be optimized is 20 for position only synthesis and 40 for position-amplitude synthesis.
In the position only synthesis, For the FA, population size is set to 30 and the number of generations is 200. Amplitudes are fixed as the case of λ/2 spaced conventional array (In=1)
and the positions are adjusted by the FA. The optimum element positions obtained from FA are traced in Fig.2.The lowest sidelobe level obtained for the position only synthesis is -20.60dB.
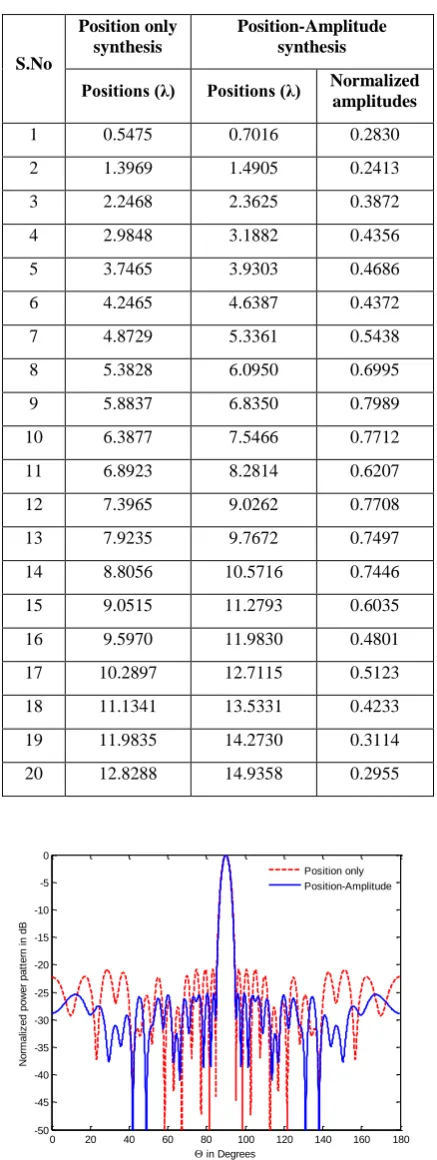
For the position-amplitude synthesis, the population size is 40 and the number of generations is 200.In this case, the amplitude coefficients and the element positions are determined simultaneously using FA. The amplitude coefficients are restricted to take on only real values. The normalized amplitudes and positions derived using FA are given in Table 1. The corresponding normalized power patterns are shown in Fig.2. From the Fig.2, it can be seen that the lowest sidelobe level for the position-amplitude synthesis is -25.27 dB, which is 4.67dB lower than that for position only synthesis without any significant difference in the beam width.
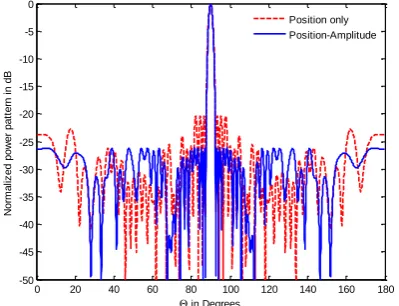
Similarly for N=40, element positions obtained for position only synthesis are traced in Fig.3. Amplitudes and positions obtained for the case of position-amplitude synthesis are traced in Fig.4. The resultant normalized power patterns are compared in Fig.5.
[image:3.595.319.538.106.687.2]Table 2 gives the achieved lowest sidelobe level and null to null beam width (FNBW) of the array for the different number of elements. From figures. 6 and 7, it can be observed that the lowest sidelobe level of the FA-based position-amplitude synthesis is lower by about 5dB compared to position only synthesis without deteriorating the beam width.
Table 1: Element positions and normalized amplitudes of 20-element array derived using the FA based position only
synthesis and position-.amplitude synthesis.
S.No
Position only synthesis
Position-Amplitude synthesis
Positions (λ) Positions (λ) Normalized amplitudes
1 0.5475 0.7016 0.2830
2 1.3969 1.4905 0.2413
3 2.2468 2.3625 0.3872
4 2.9848 3.1882 0.4356
5 3.7465 3.9303 0.4686
6 4.2465 4.6387 0.4372
7 4.8729 5.3361 0.5438
8 5.3828 6.0950 0.6995
9 5.8837 6.8350 0.7989
10 6.3877 7.5466 0.7712
11 6.8923 8.2814 0.6207
12 7.3965 9.0262 0.7708
13 7.9235 9.7672 0.7497
14 8.8056 10.5716 0.7446
15 9.0515 11.2793 0.6035
16 9.5970 11.9830 0.4801
17 10.2897 12.7115 0.5123
18 11.1341 13.5331 0.4233
19 11.9835 14.2730 0.3114
20 12.8288 14.9358 0.2955
0 20 40 60 80 100 120 140 160 180 -50
-45 -40 -35 -30 -25 -20 -15 -10 -5 0
in Degrees
N
o
rm
a
liz
e
d
p
o
w
e
r
p
a
tt
e
rn
i
n
d
B
Position only Position-Amplitude
Fig. 2 Resultant normalized power patterns from the position only synthesis and position-amplitude synthesis
[image:3.595.319.538.112.515.2]0 10 20 30 40 0
5 10 15 20 25 30
Element
Po
s
it
io
[image:4.595.66.264.72.237.2]n
Fig. 3 Element positions obtained using FA in position only synthesis for N=40.
0 10 20 30
0 0.2 0.4 0.6 0.8 1
Location of Elements
N
o
rm
a
li
ze
d
A
m
p
li
tu
d
[image:4.595.328.524.74.229.2]e
Fig. 4 Amplitudes and element positions obtained using FA in position-amplitude synthesis for N=40.
0 20 40 60 80 100 120 140 160 180 -50
-45 -40 -35 -30 -25 -20 -15 -10 -5 0
in Degrees
N
o
rm
a
liz
e
d
p
o
w
e
r
p
a
tt
e
rn
i
n
d
B
Position only Position-Amplitude
Fig. 5 Resultant normalized power patterns from the position only synthesis and position-amplitude synthesis
for N=40.
10 20 30 40 50 60 70 80 90 100 -27
-26 -25 -24 -23 -22 -21 -20 -19 -18 -17
Number of Elements
S
L
L
(
d
B
)
[image:4.595.62.264.85.424.2]Position only Position-Amplitude
Fig. 6 Lowest sidelobe level with the number of elements.
10 20 30 40 50 60 70 80 90 100 0
2 4 6 8 10 12 14 16 18 20
Number of Elements
N
u
ll
to
n
u
ll
b
e
a
m
w
id
th
(
d
e
g
re
e
)
[image:4.595.328.527.267.422.2]Position only Position-Amplitude
Fig. 7 Null to null beam width of the main lobe with the number of elements.
Table 2: Comparative results
S.No
Position only synthesis
Position-Amplitude synthesis
SLL(dB)
FNBW
(deg)
SLL(dB)
FNBW
(deg)
10 -17.83 18.82 -21.48 18.81
20 -20.60 10.49 -25.27 10.40
30 -20.61 6.98 -25.63 6.97
40 -20.69 5.27 -26.15 5.26
50 -20.72 4.07 -26.17 4.07
60 -20.86 3.15 -26.03 3.14
70 -21.16 2.69 -26.31 2.57
80 -21.20 2.35 -26.30 2.33
90 -21.26 2.12 -26.31 2.12
[image:4.595.322.538.328.733.2] [image:4.595.65.265.461.614.2]5.
CONCLUSION
The synthesis of nonuniformly spaced arrays with equal and unequal amplitudes has been presented using Firefly Algorithm. This algorithm is applied for linear arrays to obtain the lowest relative side lobe level. The FA searches effectively for the best current amplitude excitations and positions of the elements that produce the low sidelobes. The power patterns of uniformly excited nonuniformly spaced arrays are compared with those of nonuniformly excited nonuniformly spaced arrays. It is found from the results, that position-amplitude synthesis not only decreases the sidelobe level for the same beam width compared to position only synthesis but also retains their advantages. The method can be extended to other geometries and constraints.
6.
REFERENCES
[1] G. S. N. Raju, 2005. “Antennas and Propagation,” Pearson Education.
[2] H.Unz, 1960. “Linear arrays with arbitrarily distributed elements,” IEEE Transactions on Antennas and Propagation, Vol. AP-8, pp. 222–223.
[3] R.Harrington, 1961.” Sidelobe reduction by nonuniform element spacing,” IRE Transactions on Antennas and propagation, Vol.9, no.2, pp.187-192.
[4] Ishimaru, 1962. “Theory of unequally spaced arrays,” IEEE Transactions on Antennas and Propagation, Vol. AP-11, pp. 691–702, Nov.
[5] M. I. Skolnik, G. Nemhauser, and J. W. Sherman, 1964. “Dynamic programming applied to unequally spaced arrays,” IEEE Transactions on Antennas and Propagation, Vol. AP-12, pp. 35–43.
[6] B. Sadasiva rao, G.S.N. Raju, 2011.”Shaped beams from thick arrays,” International Journal of Electronics and communication engineering, ISSN 0974-2166, Vol.4, pp.577-592.
[7] C. Tseng and L. J. Griffiths, 1992. “A simple algorithm to achieve desired patterns for arbitrary arrays,” IEEE Transactions on Signal Processing, Vol. 40, no. 11,pp. 2737-2746.
[8] C. A. Olen and R. T. Compton, 1990. “A numerical pattern synthesis algorithm for arrays,” IEEE Transactions on Antennas and Propagation, Vol. 38, no. 10, pp. 1666–1676, Oct.
[9] R. L. Haupt, 1994. “Thinned arrays using genetic algorithms,” IEEE Transactions on Antennas and Propagation, Vol. 42, no. 7, pp. 993–999.
[10]Mohammad Asif Zaman, Md. Abdul Matin, 2012. “Nonuniformly spaced linear antenna array design using Firefly algorithm,” International journal of Microwave science and technology, Vol. 2012, Article ID 256759. [11]K. S. Chen, Z. S. He, and C. L. Han, 2006. “A modified
real ga for the sparse linear array synthesis with multiple constraints,” IEEE Transactions on Antennas and Propagation, Vol. 54, no. 7, pp. 2169–2173.
[12]B. P. Kumar and G. R. Branner, 1999. “Design of unequally spaced arrays for performance improvement,” IEEE Transactions on Antennas and Propagation, Vol. 47, no. 3, pp. 511–523.
[13]P. Jarske, T. Saramäki, S. K. Mitra, and Y. Neuvo, 1988. “On the properties and design of nonuniformly spaced linear arrays,” IEEE Transactions on Acoustic Speech Signal Processing, Vol. 36, no. 3, pp. 372–380.
[14]B. P. Kumar and G. R. Branner, 2005. “Generalized analytical technique for the synthesis of unequally spaced arrays with linear, planar, cylindrical or spherical geometry,” IEEE Transactions on Antennas and Propagation, Vol. 53, no. 2, pp. 621–634.
[15]L. Wu and A. Zielinski, 1993. “An iterative method for array pattern synthesis,” IEEE J. Oceanic Eng., Vol.18, no. 3, pp. 280–286.
[16]S. Holm, B. Elgetun, and G. Dahl, 1997. “Properties of the beam pattern of weight- and layout-optimized sparse arrays,” EEE Trans. Ultrason., Ferroelect., Freq. Contr., Vol. 44, no. 5, pp. 983–991.
[17]V. Murino, A. Trucco, and C. S. Regazzoni, 1996. “Synthesis of unequally spaced arrays by simulated annealing,” IEEE Transactions on Signal Processing, Vol. 44, no. 1, pp. 119–122.
[18]Trucco and V. Murino, 1999. “Stochastic optimization of linear sparse arrays,” IEEE J. Oceanic Eng., Vol. 24, no. 3, pp. 291–299.
[19]Lommi, A. Massa, E. Storti, and A. Trucco, 2002. “Sidelobe reduction in sparse linear arrays by genetic algorithms,” Microw. Opt. Technol. Lett., Vol. 31, no. 3, pp. 194–196.
[20]R.M. Leahy and B. D. Jeffs, 1991. “On the design of maximally sparse beam forming arrays,” IEEE Transactions on Antennas and Propagation, Vol. 39, no. 8, pp. 1178–1187.
[21]D. G. Kurup, M. Himdi, and A. Rydberg, 2003. “Synthesis of uniform amplitude unequally spaced antenna arrays using the differential evolution algorithm,” IEEE Transactions on Antennas and Propagation, Vol. 51, no. 9 pp. 2210–2217.
[22]X.S.Yang, 2010. “Nature-Inspired metaheuristic algorithms,” second edition, Luniver press.
[23]X. S, Yang, 2010. “Firefly algorithm, stochastic test
functions and design optimizaiton,” Int J Bio-Inspired Comput 2, 78-84.
7.
AUTHOR’S PROFILE
T. Pavani received her AMIE degree in Electronics and Communication Engineering in the year of 2006 from Institution of Engineers (INDIA) and Master of Technology in Radar and Microwave Engineering in 2009 from Andhra University College of Engineering (A). Currently, she is working towards her Ph.D. degree in the department of Electronics and Communication Engineering, Andhra University College of Engineering (A). Her Research interests include Microwave Antennas, EMI/EMC and Applications of Soft computing. She is a life member of Institution of Engineers and SEMCE (INDIA).
and Microwave, Radar Communications, Electronic circuits. Published about 304 technical papers in National/ International Journals/ Conference Journals and transactions. He is the recipient of ‘The State Best Teacher Award’ from the Government of Andhra Pradesh in 1999, ‘The Best Researcher Award’ in 1994, ‘Prof. Aiya Memorial National IETE Award’ for his best Research guidance in 2008 and Dr. Sarvepalli Radhakrishnan Award for the Best Academician of the year 2007, He was a visiting Professor in the University of Paderborn and also in the University Karlsruhe, Germany in 1994. He held the positions of Principal, Andhra University College of Engineering (A), Visakhapatnam, Chief Editor of National Journal of Electromagnetic Compatibility. Prof. Raju has published five textbooks Antennas and Wave Propagation,
Electromagnetic Field Theory and Transmission Lines, Electronics Devices and Circuits, Microwave Engineering, Radar Engineering and Navigational Aids. Prof. Raju has been the best faculty performer in Andhra University with the performance index of 99.37%.
Dr. P.V.Sridevi received her B.Tech with distinction from Nagarjuna University, M.E from P.S.G.College of Technology and Ph.D. from Andhra University. She is a professor in Electronics and Communication Engineering department, Andhra University College of Engineering, Andhra University. She is having 25 years of teaching and research experience. Her areas of interest are Antennas, Electromagnetics and VLSI. She has published 20 papers in National and International Journals.