Cyber-Attack Classification using Improved
Ensemble Technique based on Support Vector
Machine and Neural Network
Bhavna Dharamkar
M.Tech Scholar, Department of CSE, VNS, Bhopal, INDIA
Rajni Ranjan Singh
Asst.Professor, Department of CSE, VNS, Bhopal, INDIA
ABSTRACT
Cyber-attack classification and detection process is based on the fact that intrusive activities are different from normal system activities .Its detection is a very complex process in network security. In current network security scenario various types of cyber-attack family exist, some are known family and some are unknown one . The detection of known attack is not very difficult it generally uses either signature base approach or rule based approach, but to find out the unknown one is a challenging task. Intrusion detection is a process for this .One of the major developments in machine learning in the past decade is the ensemble method, which finds highly accurate classifier by combining many moderately accurate component classifiers. This paper addresses using of an ensemble classification methods for intrusion detection. The paper proposes a cascaded support vector machine classifier or an improved ensemble classifier using multiple kernel function. The multiple kernel is Gaussian in nature. The graph based /neural network technique used for feature collection of different types of cyber-attack data. The proposed algorithm is very efficient in comparison of pervious method.
General Terms
SVM, Gaussian hyper plane, Euclidean distance
Keywords
Cyber-attack Classification, Ensemble Technique NN, KDDCUP99, k-Nearest Neighbour.
1.
INTRODUCTION
Cyber-attack detection and classification is important area of research in the field of network system . The variant of cyber-attack also provide the great difficulty for detection process [1]. In current research trend various cyber-attack detection technique apply in concern of data mining such as clustering, classification and model validation. In consequence of cyber-attack detection some author used graph based technique for the collection of different feature. In cyber-attack detection feature extraction and feature selection are important aspects. Cyber-attack classification can either have single variable approach or a multi-variable approach to detect Cyber-attack depending on the algorithm used. In the single variable approach a single variable of the system is analyzed [2]. This can be, for example, port number, the CPU usage of a local machine, etc. In multi-variable approach, a combination of several features and their inter-correlations are analyzed. [3] In addition, based on the method the way in which features are chosen for the IDS can be divided into two groups; into feature selection and feature reduction. In the feature selection
method the features are either picked manually from the data monitored or by using a specific feature selection tool [3]. The most suitable features are selected by handpicking from the feature spectrum based on the prior knowledge about the environment that the IDS are monitoring. For example, features that can distinguish certain type of traffic from the traffic flows are picked for the network traffic model training. The idea behind the feature selection tools is to reduce the amount of features into a feasible subset of features that do not correlate with each other [5, 6]. In this paper we proposed improved ensemble classifier technique for cyber-attack detection, which uses multiple kernel mechanism to maximizes the area of classification.The multiple Kernel is Gaussian in Nature. Neural network based technique is used for the process of optimization for the selection of data. The rest of this paper is organized as follows: Section 2 describes the related work. Section 3 presents Support vector machine, Neural Network and k-Nearest Neibour. Section 4 explains proposed method . Section 5 focuses on the experimental results analysis Finally, results are summarized and concluded in Section 6.
2.
RELATED WORK
Numbers of anomaly detection and rule based detection systems for cyber attack detection are present which are based on many different machine learning techniques. Some studies apply single agent learning technique, such as neural networks, genetic algorithms, support vector machines, etc. On the other hand, some systems are based on combining different learning techniques, such as hybrid or ensemble techniques. Recently many kernel based methods ,SVM and their variant were proposed to detect cyber attack In particular, these techniques are developed as classifiers, which are used to classify or recognize whether the incoming Internet access is the normal access or an attack.
Earlier different approaches have been used to detect cyber attack ,initially single classifiers were used in order to detect the attack ,but know a days emphasis is on ensemble classifier which is a combination of more than one classifiers.different kernel based method like SVM and their variant have been proposed for cyber attack
M.Govindrajan and RM. Chandrashekaran[19] , proposed an anomaly intrusion detections system using radial basis function and support vector machine and evaluate the effectiveness of the proposed RBF-SVM hybrid system by conducting several experiments on NSL-KDD dataset. We examine the performance of the RBF-SVM hybrid classifier in comparison with standalone RBF and standalone SVM classifier.
Shailendra Singh and Sanjay Silakari [1]explored C4.5 ,iSVM as a cyber attack classifier,he designed a hybrid classifier C4.5 –iSVM and ensemble approach with C4.5 ,iSVM and C4.5 -.iSVM.The ensemble classifier gave best result for probe and R2L classes. Although it gives an improved classification efficiency but still it needs some improvement. In our paper we tried to improve the classification ratio over hybrid technique of cyber attack classification, which was suffering from low range data by using cascading ensembling technique using double kernel function.
3.
SUPPORT VECTOR MACHINE
NN AND K-NEAREST NEIGHBOUR
3.1 Support Vector Machine
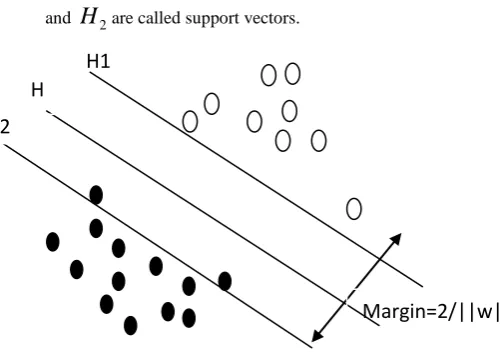
SVM is a machine learning method based on statistical learning theory developed by V. N. Vapnik, and it has been successfully applied to numerous classification and pattern recognition problems such as text categorization, image recognition and Bioinformatics. It is still in the development stage now [14]. SVM can be used for pattern recognition, regression analysis and principal component analysis. The achievements of SVM in training have Platt’s the sequential minimal optimization method, Osun’s the method of Chunking, Joachim’s’ SVM light method and so on [12]. These methods are directed at the training process, and not related to the classification process. In the process of SVM training, all the samples are used. So it has no effect on the speed of the classification. Lee and others propose a method of reduction SVM training time and adding the speed of training, reduced support vector machines [16]. The method in the training process is not used in all the samples, but by randomly selecting one of the subsets to train, which is through reducing the scale of training to achieve the objective of speeding up the training pace. At the same time, because of the reduction of the support vector quantity, the speed of classification is improved to some degree. However, due to the loss of some support vector classification, precision has declined, especially when the number of support vectors is so much that the accuracy of its classification will decline. Burgess puts forward a way of increasing the speed of Classification, which does not use the support vector in the category function but use a reduction of vector set, which is different from the standard vector set. That is neither training samples nor support vector, but it is the transformation of the special vector. The method achieved certain results, but in the process of looking for the reduction of the vector collection, the cost of calculating paid is too large to widely use in practice. The concept of SVM is to transform the input vectors to a higher dimensional space Z by a nonlinear transform, and then an optical hyper plane which separates the data can be found. This hyper plane should have the best generalization capability. As shown in Figure 1, the black dots and the white dots are the training dataset which belongs to two classes. The Plane H series are the hyper planes to separate the two classes. The optical plane H is found by maximizing the margin value
2
/
||
w
||
. Hyper planesH
1and
H
2are the planes on the border of each class and also parallel to the optical hyper plane H. The data located onH
1 andH
2are called support vectors. [image:2.595.293.545.107.284.2]
Figure 1: The SVM binary classifications
For training data set (x1,y1),...(xl,yl),yi ϵ{-1,1}, to find the optical hyper plane H, a nonlinear transform, Z=ф(x), is applied to x, to make x become linearly dividable. A weight
w
and offsetb
satisfying the following criteria will be found:
……….(1)
i.e ….(2)
3.2 NN graph technique
A NN is a graph based multi-classification technique in this technique pair-wise SVMs used, let the decision function for class i against class j, with the maximal margin, be[16]:
……… (1)
Where Wij is the d-dimensinal vector, (x) is a mapping function that maps x into the d-dimensional feature space bij is the bias term and Dij(x)= --Dji(x) The regions Ri are shown in figure 4.4 .1 with labels of class I, II and III.
… (2)
If x is in Ri, we classify x into class i. if x is not in Ri(i=1,2,……,n), x is classified by voting. Namely ,for the input vector x,Di(x) is calculate at follow:
………(3)
Where
And x is classified into class
……….(4)
If xϵRiDi(x)=n-1 and Dk(x)<n-1 for k≠i.thus x is classified into i.but if any of Di(x) is not n-1,may be satisfied for plural iS. In this case x is unclassified. In the shaded region in figure
H1
H
H2
1,Di(x)=0(i=1,2 and 3). Therefore, this region is unclassified, although the unclassified region is much smaller than that for the one-against-all support vector machine. The ensemble approach to artificial intelligence is a relatively new trend in which several machine learning algorithms are combined [1]. The main idea of the algorithm is to use the strength of a classifier is exciting. Ensembles mainly useful when the problem can be divided into sub problems. In his case, the actors in each module, which may include one or more algorithms assigned to a particular problem.
3.3. k-NN
The k-Nearest Neighbors algorithm (or k-NN for short) is a non-parametric method used for classification and regression.[1] In both cases, the input consists of the k closest training examples in the feature space. The output depends on whether k-NN is used for classification or regression:
In k-NN classification, the output is a class membership. An object is classified by a majority vote of its neighbors, with the object being assigned to the class most common among its k nearest neighbors (k is a positive integer, typically small). Ifk = 1, then the object is simply assigned to the class of that single nearest neighbor.
In k-NN regression, the output is the property value for the object. This value is the average of the values of its k nearest neighbors.
k-NN is a type of instance-based learning, or lazy learning, where the function is only approximated locally and all computation is deferred until classification. The k-NN algorithm is among the simplest of all machine learning algorithms.
The training examples are vectors in a multidimensional feature space, each with a class label. The training phase of the algorithm consists only of storing the feature vectors and class labels of the training samples.
In the classification phase, k is a user-defined constant, and an unlabeled vector (a query or test point) is classified by assigning the label which is most frequent among the k training samples nearest to that query point. A commonly used distance metric for continuous variables is Euclidean distance. For discrete variables, such as for text classification, another metric can be used, such as the overlap metric (or Hamming distance). Often, the classification accuracy of k-NN can be improved significantly if the distance metric is learned with specialized algorithms such as Large Margin Nearest Neighbor orNeighbourhood components analysis.
The best choice of k depends upon the data; generally, larger values of k reduce the effect of noise on the classification,[4] but make boundaries between classes less distinct. A good k can be selected by various heuristic techniques (see hyperparameter optimization). The special case where the class is predicted to be the class of the closest training sample (i.e. when k = 1) is called the nearest neighbor algorithm.
4.
PROPOSED METHODOLOGY
Step1: Initially input Cyber-attack data passes through preprocessing function and extracted feature part of Cyber-attack data in form of traffic type.
Step2: the extracted traffic feature data converted into feature vector.
Step 3: In phase of feature mapping in feature space of NN create a fixed class according to the group of data.
Step 4: steps of processing of NN.
1. Initialize Gaussian hyper plane margin.
2. Choose a random vector from training data and present it to the NN.
3. The weight of the plane support vector is estimated. The size of the vector decreases with each iteration. 4. Each vector in the SV’s neighborhood has its
weights adjusted to become more like the SV. Vector closest to the SV are altered more than the vector furthest away in the neighborhood.
5. Repeat from step 2 for enough iteration for convergence.
6. Calculating the SV is done according to the Euclidean distance among the node’s weights (W1, W2, … , Wn) and the input vector’s values (V1, V2, … , Vn).
7. The new weight for a node is the old weight, plus a fraction (L) of the difference between the old weight and the input vector… adjusted (theta) based on distance from the SV.
Step 5: After processing of support vector finally cyber-attack data are classified
Figure 4 Proposed Model for cyber-attack classification
5.
EXPERIMENTAL RESULT
ANALYSIS
In this paper, we perform experimental process of proposed improved ensemble for Cyber-attack detection. The proposed method implements in matlab 7.13.0 and tested with very reputed data set from UCI machine learning research center. In the research work, I have measured detection accuracy, true positive rate, false positive rate, true negative rate and finally false negative rate error of classification ensemble method. To evaluate these performance parameters I have used KDDCUP99 datasets from UCI machine learning repository namely Cyber-attack detection dataset[18].
SVM
Attack Classified
Ensemble
Feature Allocation
Cyber-attack
data
Feature
Extractor
NN
Feature Space
Feature
Allocation
Ensemble
SVM
Allocation
Earlier application of isolated feature reduction on dataset has much greater Accuracy, than later by integrating both feature reduction and Improved ID3 Methods. Also there is a considerable enhancement in the true positive and true negative detection ratio and minimizes in false positive and false negative ratio .Thus this gives the direct improvised accuracy in the result. Basis the result of confusion matrix (true positive, true negative, false positive, false negative).We are showing the consequence for the following parameters i.e. - Accuracy, Precision, Recall for data sets.
Precision- Precision measures the proportion of predicted positives/negatives which are actually positive/negative.
Recall -It is the proportion of actual positives/negatives which are predicted positive/negative.
Accuracy-It is the proportion of the total number of prediction that were correct or it is the percentage of correctly classified instances.
Below we are showing how to calculate these parameters by the suitable formulas. And also, below we are showing the graph for that particular data set.
Precision =
Recall =
Accuracy =
FPR= , FNR=
Performance Evaluation of Proposed Method
In this section show the selection of variable no. of attribute for the process of the classification algorithm and Modified method. The variable no. of attribute differs the classification rate and classification time. The evaluation parameter corresponding to attribute shown in given below table.
Table1: Shows that the performance evaluation of TPR, TNR, FPR, FNR, Detection rate, Precision rate and Recall rate for ensemble method, and the input value is 0.1.
Metho d Name Valu e TYPES OF ATTAC K
TPR TNR FPR FNR DETECTI ON RATE PRECISI ON RATE RECA LL RATE
ISVM 0.1 NORM AL 3.70 0 0.74 3 1.70 8 0.70 1
95.30 84.02 82.97
DOS 3.51 3 1.74 3 1.70 6 0.63 1
92.83 79.97 77.97
PROBE 2.31 3 1.76 4 0.60 8 0.13 1
93.83 83.97 80.94
U2R 3.51 3 0.85 3 0.84 8 1.73 1
93.85 84.97 83.97
R2L 3.09 3 0.69 8 0.40 8 1.85 1
91.83 85.96 81.94
Table 2 : Shows that the performance evaluation of TPR, TNR, FPR, FNR, Detection rate, Precision rate and Recall rate for ISVM method, and the input value is 0.1.
Table 3 : Shows that the performance evaluation of TPR, TNR, FPR, FNR, Detection rate, Precision rate and Recall rate for proposed method, and the input value 0.1
Table 4: Shows that the performance evaluation of TPR, TNR, FPR, FNR, Detection rate, Precision rate and Recall
rate for ensemble method, and the input value is 0.5.
Metho d Name Valu e TYPES OF ATTAC K
TPR TNR FPR FNR DETECTI ON RATE PRECISI ON RATE RECA LL RATE propos ed 0.1 NORM AL 3.65 4 0.84 3 1.74 8 0.75 1
95.80 85.02 83.97
DOS 3.51 3 1.84 3 1.73 8 0.74 1
93.83 81.97 80.97
PROBE 2.31 3 1.85 3 0.73 8 1.13 1
94.83 84.97 81.97
U2R 3.54 3 0.85 4 0.85 3 1.85 1
95.67 85.97 84.97
R2L 3.09 3 0.69 8 0.40 8 1.84 6
92.83 86.94 82.94
Metho d Name Valu e TYPES OF ATTAC K
TPR TNR FPR FNR DETECTI ON RATE PRECISI ON RATE RECA LL RATE
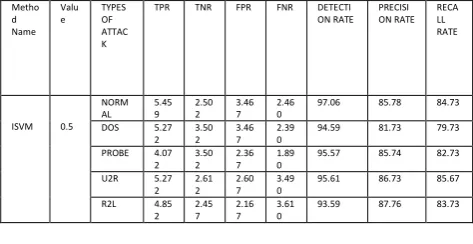
ISVM 0.5 NORM AL 5.45 9 2.50 2 3.46 7 2.46 0
97.06 85.78 84.73
DOS 5.27 2 3.50 2 3.46 7 2.39 0
94.59 81.73 79.73
PROBE 4.07 2 3.50 2 2.36 7 1.89 0
95.57 85.74 82.73
U2R 5.27 2 2.61 2 2.60 7 3.49 0
95.61 86.73 85.67
R2L 4.85 2 2.45 7 2.16 7 3.61 0
93.59 87.76 83.73
Metho d Name Valu e TYPES OF ATTAC K
TPR TNR FPR FNR DETECTI ON RATE PRECISI ON RATE RECA LL RATE Propos ed Metho d 0.5 NORM AL 5.25 9 2.60 2 3.50 7 2.51 0
97.56 86.78 85.73
DOS 5.27 2 3.60 3 3.49 7 2.50 0
95.58 83.74 82.73
PROBE 4.07 2 3.61 2 2.49 7 2.89 0
96.57 86.81 83.74
U2R 5.26 7 2.64 3 2.61 2 3.61 0
96.64 87.73 86.73
R2L 4.85 2 2.45 7 2.16 7 3.54 7
[image:4.595.317.560.103.231.2] [image:4.595.310.547.279.401.2]Table 5: Shows that the performance evaluation of TPR, TNR, FPR, FNR, Detection rate, Precision rate and Recall rate for ISVM method, and the input value is 0.5.
Table 6: Shows that the performance evaluation of TPR, TNR, FPR, FNR, Detection rate, Precision rate and Recall rate for proposed method, and the input value is 0.5.
Comparative Result Analysis
[image:5.595.315.545.72.228.2] [image:5.595.49.286.108.236.2] [image:5.595.317.560.278.423.2] [image:5.595.55.292.349.480.2]In this section discuss the valuation of result in terms of TPR, TNR, FPR,FNR, Detection rate, Precision rate and Recall rate for the method ensemble, ISVM method and proposed method with using input value is 0.1, and 0.5.
Figure 4 : Shows that the performance evalueation of TPR and TNR for the ensemble method and the input value is
0.1.
Figure 5: Shows that the performance evalueation of FPR and FNR for the ensemble method and the input value is
[image:5.595.315.564.474.620.2] [image:5.595.55.292.529.679.2]0.1.
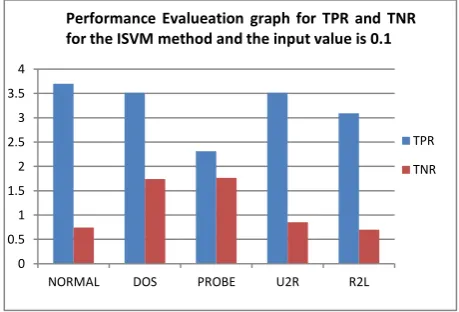
Figure 6 : Shows that the performance evalueation of TPR and TNR for the ISVM method and the input value is 0.1.
Figure 7 : Shows that the performance evalueation of FPR and FNR for the ISVM method and the input value is 0.1.
Figure 8 : Shows that the performance evalueation of TPR and TNR for the proposed method and the input value is
0.1.
0 1 2 3 4 5 6
NORMAL DOS PROBE U2R R2L Performance Evalueation graph for TPR and TNR for the ensemble method and the input value is 0.1
TPR
TNR
0 0.2 0.4 0.6 0.8 1 1.2 1.4 1.6 1.8
NORMAL DOS PROBE U2R R2L Performance Evalueation graph for FPR and FNR for the ensemble method and the input value is 0.1
FPR
FNR
0 0.5 1 1.5 2 2.5 3 3.5 4
NORMAL DOS PROBE U2R R2L Performance Evalueation graph for TPR and TNR for the ISVM method and the input value is 0.1
TPR
TNR
0 0.2 0.4 0.6 0.8 1 1.2 1.4 1.6 1.8 2
NORMAL DOS PROBE U2R R2L Performance Evalueation graph for FPR and FNR for the ISVM method and the input value is 0.1
FPR
FNR
0 0.5 1 1.5 2 2.5 3 3.5 4
NORMAL DOS PROBE U2R R2L Performance Evalueation graph for TPR and TNR for the proposed method and the input value is 0.1
TPR
TNR
Method Name
Valu e
TYPES OF ATTAC K
TPR TNR FPR FNR DETECTI ON RATE
PRECISI ON RATE
RECA LL RATE
ensemb le
0.5 NORM AL
6.03 2
2.46 2
3.32 7
2.45 0
91.55 83.69 82.69
DOS 6.12 3
1.56 4
2.35 4
1.45 0
90.55 82.69 80.69
PROBE 6.24 3
3.46 2
1.56 7
2.11 0
88.55 81.87 83.67
U2R 7.03 2
1.35 1
0.32 7
1.45 0
87.55 84.47 83.69
R2L 5.23 2
3.35 1
2.32 7
1.59 0
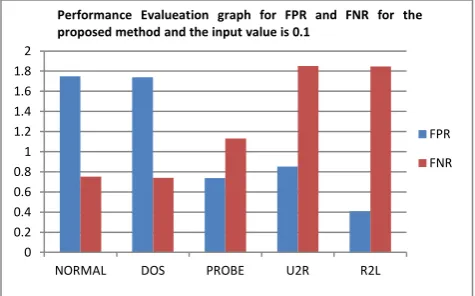
Figure 9 : Shows that the performance evalueation of FPR and FNR for the proposed method and the input value is
0.1.
Figure 10 : Shows that the performance evalueation of Detection rate, Precision rate and Recall rate for the
proposed method and the input value is 0.1.
Figure 11 : Shows that the performance evalueation of TPR, TNR, FPR and FNR for the proposed method and
the input value is 0.1.
6. CONCLUSION AND FUTURE WORK
In this paper, we have proposed a improved ensemble method, based on NN and Gaussian Support Vector Machines, for cyber-attack classification. Experiments with the KDD Cup 1999 Data show that SVM-NN can provide, the better generalization ability and effectively classified cyber-attack data. Moreover, the modified algorithms proposed in this desecration outperform conventional CIMDS and ISMCS in terms of precision and recall. Specifically, accuracy of the modified algorithms can be increased due to future allocation of NN, and reduces feature subset increases the accuracy of classification. From our experiments, the NN-SVM can detect known attack types with high accuracy and low false positive rate which is less than 1%. The proposed method classified attack and normal data of KDDCUP99 is very accurate. The proposed method work in the process of making group of attack very accurate, the learning process SVM training process makes very efficient classification rate of Cyber-attack data. Our empirical result shows better performance in compression of ISMCS and other data mining technique for cyber-attack detection.
7. ACKNOWLEDGMENTS
A special thanks to all the authors whose paper have bben referred in this article for the work proposed here.
8. REFERENCES
[1] Shailendra Singh, Sanjay Silakari “An Ensemble Approach for Cyber Attack Detection System: A Generic Framework” 14th ACIS, IEEE 2013. Pp 79-85.[2] X. Li et al., “Smart Community: An Internet of Things Application,” IEEE Commun. Mag., vol. 49, no. 11, 2011, pp. 68–75.
[3] V. Bapuji, R. Naveen Kumar2,Dr. A. Govardhan, S.S.V.N. Sarma “Soft Computing and Artificial Intelligence Techniques for Intrusion Detection System” Vol 2, No.4, 2012, pp 24-33.
[4] Hoa Dinh Nguyen , Qi Cheng “An Efficient Feature Selection Method For Distributed Cyber Attack Detection and Classification” IEEE 2013. pp 1-6. [5] Bimal Kumar Mishra,Hemraj Saini “Cyber Attack
Classification using Game Theoretic Weighted Metrics Approach” World Applied Sciences Journal 7, 2009. Pp 206-215.
[6] Xu Li, Inria Lille, Xiaohui Liang, Xiaodong Lin, Haojin Zhu “Securing Smart Grid: Cyber Attacks,Countermeasures, and Challenges” IEEE Communications Magazine IEEE 2012. Pp 38-46. [7] Haitao Du, Christopher Murphy, Jordan Bean, Shanchieh
Jay Yang “Toward Unsupervised Classification of Non-uniform Cyber Attack Tracks” International Conference on Information Fusion 2009. Pp 1919-1925.
[8] Abhishek Jain And Ashwani Kumar Singh “Distributed Denial Of Service (Ddos) Attacks - Classification And Implications”journal of Information and Operations Management vol-3 2012. Pp 136– 140.
[9] Dewan Md. Farid, Nouria Harbi, Emna Bahri, Mohammad Zahidur Rahman, Chowdhury Mofizur Rahman “Attacks Classification in Adaptive Intrusion Detection using Decision Tree” World Academy of Science, Engineering and Technology, 2009. Pp 86-91.
0 0.2 0.4 0.6 0.8 1 1.2 1.4 1.6 1.8 2
NORMAL DOS PROBE U2R R2L Performance Evalueation graph for FPR and FNR for the proposed method and the input value is 0.1
FPR
FNR
70 75 80 85 90 95 100
NORMAL DOS PROBE U2R R2L
Performance Evalueation graph for Detection rate, Precision rate and Recall rate for the proposed method and the input value is 0.1
DETECTION RATE
PRECISION RATE
RECALL RATE
0 0.5 1 1.5 2 2.5 3 3.5 4
NORMAL DOS PROBE U2R R2L Performance Evalueation graph for FPR ,FNR,TPR and TNR for the proposed method and the input value is 0.1
TPR
TNR
FPR
[10] Chee-Wooi Ten, Govindarasu Manimaran “Cybersecurity for Critical Infrastructures:Attack and Defense Modeling “IEEE TRANSACTIONS ON SYSTEMS, vol-40 IEEE 2010. Pp 853-865.
[11] Mohammad A. Faysel , and Syed S. Haque “Towards Cyber Defense: Research in Intrusion Detection and Intrusion Prevention Systems” IJCSNS, vol-7 2010. Pp 316-325.
[12] Shailendra Singh, Sanjay Agrawal, Murtaza,A. Rizvi and Ramjeevan Singh Thakur “ Improved Support Vector Machine for Cyber Attack Detection” WCECS IEEE 2011. Pp 1-6.
[13] Real-time Misuse Detection Systems, Proceedings of the IEEE on Information, 2004.
[14 Vineet Richhariya , Dr. J.L.Rana ,Dr. R.C.Jain ,Dr. R.K.Pandey” Design of Trust Model For Efficient Cyber Attack Detection on Fuzzified Large Data using Data
Mining techniques” IJRCCT Vol 2, Issue 3, 2013. Pp 126-132.
[15] Deepak Rathore and Anurag Jain “Design Hybrid method for intrusion detection using Ensemble cluster classification and SOM network” in International Journal of Advanced Computer Research Volume-2 Number-3 Issue-5 September-2012.
[16] M Govindarajan and RM.Chandrasekaran ”Cyber-Attack Classification Using Improved Ensemble Technique Based On Support Vector Machine and Neural Network” Proceding of the World Congress on Engineering and Computer Science 2012 Vol IWCECS 2012, October 24-26, 2012, San Francisco, USA