Vehicle Classification using Density based
Multi-feature Approach in Support Vector Machine
Classifier
Pradeep Kumar Mishra
Ph.D Research Scholar Vision Image Processing Lab
Department of Electrical Engineering,Indian Institute of Technology Bombay
Mumbai 400076
[email protected]
Biplab Banerjee
Ph.D Research Scholar Image Processing Lab
Department of Centre of Studies Resources Engineering Electrical Engineering,
Indian Institute of Technology Bombay
Mumbai 400076
[email protected]
ABSTRACT
A density based multi-feature combination approach to classify vehicles using support vector machine (SVM) classifier is pro-posed in this paper. Features like Haar, Gradient, RGB and Pyra-midal histogram of oriented gradients are extracted from vehicle images and a kernel density approximation is performed. The re-sults are compared with another set of multi-feature combination and effects of using kernel density estimators and various kernels like Gaussian, Polynomial and Histogram intersection in SVM are also studied. It is found that the above mentioned feature combination produces good results in comparison and effects of scaling, orientation and shadowing were properly compensated. A sample set of 9360 images were used with half of them used for training the classifier and the other half for testing. The ve-hicles were clustered into four categories, namely 2-wheeler, 3-wheeler, light motor vehicle (LMV) and heavy motor vehicles (HMV) and an accuracy greater than 90% has been observed.
1. INTRODUCTION
The use of CCTV cameras to aid in traffic surveillance, control and management has seen a significant increase over the years. The analysis and statistics of traffic data from CCTV feed helps immensely in handling lane closures, unexpected traffic diver-sions, preventing traffic jams, providing solutions to accident prone areas and the like. But utilizing manual labor to analyze huge volumes of data would prove unreliable and highly tedious, because of which automated traffic control systems were intro-duced. These automated systems could run with minimal human assistance over a long period of time and there are a multitude of different algorithms used for video processing to detect and clas-sify vehicles, estimate their speeds etc. The problem of clasclas-sify- classify-ing vehicles in a video is quite exclusive to a particular camera setup and region since it involves factors like environmental con-ditions, position of the camera, angle of approach of the vehicles with respect to the camera, scaling and skewing factors, diversity in make and model of vehicles belonging to same class etc. The design of a generic and reliable vehicle classification algorithm
is considered difficult but there are various types of engineering solutions for these problems.
Commonly, vehicle classification algorithms differentiate vehi-cles based on their dimensions like axle width, wheel base, length of the vehicle and such, but these features can overlap among different class of vehicles. The vehicle image feature based approach is a more concrete way of clustering similar ve-hicles than a dimension based approach. In this paper present a multi-feature classification algorithm which uses a non-linear kernel based SVM classifier for a multi-class vehicle classifica-tion system. Our technique makes use of an amalgamaclassifica-tion of Haar features, PHOG features, gradient features and RGB fea-tures with the addition of kernel density approximation on im-ages of vehicles taken head-on from a camera. The classes are divided into four categories namely 2-wheeler, 3-wheeler, light motor vehicle (LMV), heavy motor vehicle (HMV).
The paper is divided into sections with section 2 describing the previous work, section 3 detailing the algorithm’s framework and feature sets, section 4 describes the results. The paper is con-cluded in section 5.
2. LITERATURE REVIEW
into three basic classes based on size, namely small, medium and large. A visual vehicle classification using HOG for different ori-entations of vehicles is proposed by Rybskiet al.[19] which can be integrated with LIDAR detector. This method requires various orientation images of the same vehicle for effective classification which might lead to a huge and redundant training data set. Mes-selodiet al.[17] presents a novel way of classifying bicycles and motorcycles by extracting the features from the wheel region of the vehicles and using a SVM classifier, but such specific fea-tures are not an efficient way to classify vehicles.
3. CLASSIFICATION FRAMEWORK
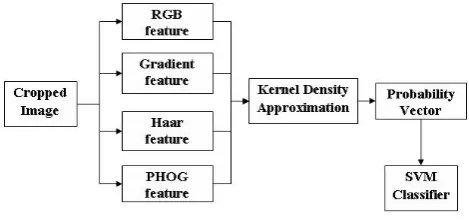
[image:2.595.56.291.310.422.2]The proposed algorithm for classification consists of multiple feature extraction, application of kernel density approximation over the feature set to extract the probability vectors and classify-ing them usclassify-ing a SVM classifier. The steps involved are depicted in figure 1.
Fig. 1. Flow chart of vehicle classification mechanism
The following 4 feature used in our algorithms - RGB color, gra-dient, PHOG and Haar features to lessen the disadvantages of a pixel wise color modeling.
(1) Haar feature - Haar-like features are popular image features used in object recognition by Sun et al. [20], Bai et al. [1], Haselhoffet al.[8] which are similar to Haar wavelets used in the first real-time face detector by Violaet al.[22]. One other contribution was to use summed area which they called integral images. Integral images can be defined as two-dimensional lookup tables in the form of a matrix with the same size as that of the original image. Each Haar-like feature may need more than four lookups, depending on how it was defined. Viola and Jones’s 2-rectangle features need six lookups, 3-rectangle features need eight lookups, and 4-rectangle features need nine lookups.
(2) Pyramidal Histogram of Oriented Gradients(PHOG) - Esti-mating the shape of an object is often described by the edge orientations of the object. Therefore calculate gradients of edges and put them in groups get PHOG which is used for multi class object classification as demonstrated by Baiet al.[2] and Gehleret al.[5]. Then l each interval a ‘bin’ and put each pixel in a bin such that gradient of edge at that pixel lies in the interval denoted by that bin.
(3) RGB color feature - RGB color components are generally used to classify objects which have significant differences in their pixel colors. There are various color spaces like RGB, YCrCb, HSV etc and have chosen RGB due to its simplicity. Ghazalli [13] uses RGB color feature with Fuzzy logic clas-sifier to classify palm fruits for oil extraction according to their ripeness. Gani [21] also uses RGB color feature with Fuzzy logic classifier for classifying pineapples for export according to their maturity level. Campbell [4] has used
(4) Gradient feature - Gradient based features has been cho-sen for their robustness to illumination based changes and used both direction and magnitude features. Javedet al.[10], Liu et al. [16], Mudigondaet al. [18], Huang et al. [9], Gavrilescuet al.[14] have all used gradient features for clas-sification.
3.1 Kernel Density Estimation
Kernel density estimation (KDE) is one of a smoothing techniques and is also a non-parametric way to estimate the probability density function of a random variable. For (x1, x2, ...xn) which is an independent and identically distributed random variable drawn from an unknown distribu-tion with an unknown densityf, estimated shape of this function
fcan be computed using its kernel density estimator which is given by
ˆ
fh(x) = 1
n
n
X
i=1
Kh(x−xi) = 1 nh n X i=1 Kh (x−xi)
h (1)
whereK(.)is the kernel. The kernel is symmetric but it can ei-ther be a positive or negative function that integrates to one with
h >0as the bandwidth also known as smoothing parameter. A kernelKis called a scaled kernel if it has a subscripthand is de-fined asKh(x) =h1K(xh). The bandwidthhshould be assigned a value as small as the data would allow. A range of kernel func-tions are commonly used for KDE namely uniform, triangular, biweight, triweight, Epanechnikov. In our experiment triangular kernel is use.
3.2 Kernel density approximation
Kernel density approximation (KDA) is a non-parametric multi-modal density function based approximation utilizing a mixture of Gaussians which was proposed by Hanet al.[7], [6]. Jinet al.[11] also has used similar approacch for non-parametric clus-tering. A Gaussian distribution or a mixture of Gaussians is pre-dominantly used in computer vision problems because of their simplicity and efficiency and has very good estimation and pre-diction statistics. So utilized this technique to extract the prob-ability vectors and to enhance the accuracy of our classifier and used the technique described by Hanet al.[7]. For construct a one dimensional density function for each feature at each pixel by kernel density estimation based on Gaussian kernel as fol-lows:
ˆ
fF(x) = 1 √ 2π n X i=1 KF,i σF,i
exp(−(x−xF,i) 2
2σ2 F,i
) (2)
whereσF,iandκF,iare the bandwidth and weight of ith kernel respectively. KDA finds the local maxima in the density func-tion (equafunc-tion 2) and a mode-based representafunc-tion of density is obtained by estimating all the parameters for a Gaussian mix-ture.The simplified density function using KDA is
˜
fF(x) = 1 √ 2π mF X i=1 ˜ κF,i ˜ σF,i
exp(−(x−xF,i˜ ) 2
2 ˜σF,i2
) (3)
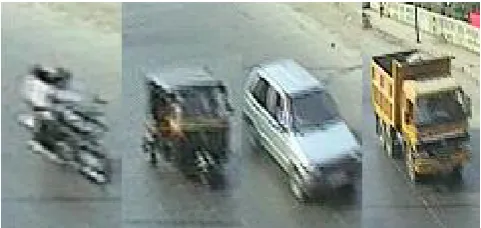
Fig. 2. Vehicle Classes - two wheeler, three wheeler, LMV and HMV.
4. EXPERIMENTS
In our tested algorithm with images of vehicles of different sizes and shapes and considered two wheelers, three wheelers, light motor vehicles (including light cargo vehicles), and heavy mo-tor vehicles which are shown in figure 2. The images have been taken for different orientations and with camera calibration. Af-ter the vehicle’s features are extracted, the classification step comes into the picture. The tools used Support Vector Machine classifier with the Matlab LIBSVM implementation and changed the training set size from 40% of the total images available to 70% with a step increase of 10%. After training image applied the classification step for unknown samples and present the per-formance of our classification algorithm along with precision-recall (P-R) graphs for various test cases.
(true positive),
Figures 3, 4 and 5 depict the P-R graphs for our feature combina-tion in low, medium and high density traffic scenes, where there is a variable amount of occlusion and probablity of misclassi-fication varies. The traffic density is classified as low, medium and high depending on the number of vehicles passing in a ten minute period. For low density the number of vehicles passed in a ten minute period is anywhere between 0 to 600, while it is 600 to 900 for medium density and 900 to 1300 for high density traffic. These scenarios are shown in figures 6, 7and 8. It can be noted the feature combination we have selected shows better re-sults in comparison is because each of the individual features are good for classifying in their own aspect and the fact that they rep-resent different features of the same object adds to the improved accuracy. For instance Haar features are computaionally cheap and have been widely used for object recognition and the like because of their use of overlapping integral images. RGB color features are used because vehicles have distict color in major-ity of the samples and they act as a good discriminative feature. Gradient features are used because of their ability to resist illu-mination changes which have pronounced effect on outdoor sce-narios. PHOG features provide histogram based edge descriptors which work perfectly for vehicle classification since the vehicles have definite edges. All these features combined make an excel-lent feature set for classification.
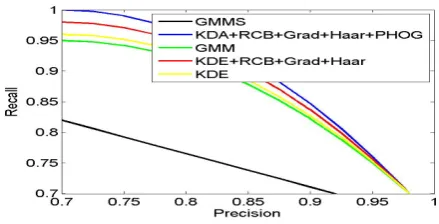
[image:3.595.325.535.102.237.2]Figures 9, 10, 11, 12 and 13 portray the effects the feature combi-nation and individual features have on the SVM classifier. Since the individual features have more of generalized descriptors to differentiate pixels, their accuracy based performance through P-R study with linear SVM is not good. But the feature com-bination with its multitude of discriminative features describing each pixel provides good density for SVM to provide satisfactory results. It can be inferred from these figures that the multi-feature combination of Haar, PHOG, Gradient and RGB features show reliable and more accurate results than the individual feature sets. Figure 14 is a comparison between various feature combinations including KDE, KDA, SIFT and shape features. It can be noted that the PHOG, Haar, gradient and RGB feature combination
[image:3.595.322.536.457.567.2]Fig. 3. P-R curves for our algorithm with different feature sets in low density traffic.
Fig. 4. P-R curves for our algorithm with different feature sets in medium density traffic.
Fig. 5. P-R curves for our algorithm with different feature sets in high density traffic.
along with kernel density approximation produces the best re-sults among the lot.
Fig. 6. Low density traffic.
Fig. 7. Medium density traffic.
Fig. 8. High density traffic.
Fig. 9. P-R curves for SVM with RGB feature.
Table 1. Confusion matrix for SVM with sift+shape+haar+phog
HMV LMV 3-Wheeler 2 -Wheeler
HMV 248 146 15 17
LMV 186 2430 106 36
3-Wheeler 78 215 490 140
2-Wheeler 19 50 53 451
Accuracy= 77.3%
Fig. 10. P-R curves for SVM using RGB+Grad feature.
Fig. 11. P-R curves for SVM using RGB+Haar feature.
Fig. 12. P-R curves for SVM using RGB+PHOG feature.
rgb+grad+Haar.jpg
Fig. 13. P-R curves for SVM using RGB+Grad +Haar+PHOG feature.
Table 2. Confusion matrix for SVM with rgb+grad+haar+phog
HMV LMV 3-Wheeler 2 -Wheeler
HMV 378 29 1 1 0
LMV 74 2629 42 13
3-Wheeler 156 68 585 122
2-Wheeler 24 10 9 530
Fig. 14. P-R curves for different density functions.
Table 3. Confusion matrix for SVM with sift+shape+haar+phog combination and Gaussian
RBF kernel
HMV LMV 3-Wheeler 2 -Wheeler
HMV 292 106 4 16
LMV 36 2639 56 27
3-Wheeler 78 185 540 128
2-Wheeler 11 46 3 513
[image:5.595.67.514.100.779.2]Accuracy= 85.1%
Table 12. Confusion matrix for KDA with rgb+grad+haar+phog
HMV LMV 3-Wheeler 2 -Wheeler
HMV 404 13 1 0
LMV 57 2698 3 0
3-Wheeler 0 10 908 13
2-Wheeler 0 0 25 548
Accuracy= 97.4%
Table 5. Confusion matrix for SVM with sift+shape+haar+phog combination and polynomial
kernel
HMV LMV 3-Wheeler 2 -Wheeler
HMV 399 13 0 6
LMV 82 2589 68 19
3-Wheeler 48 71 534 278
2-Wheeler 26 8 1 538
Accuracy= 86.7%
Table 6. Confusion matrix for SVM with rgb+grad+haar+phog combination and polynomial
kernel
HMV LMV 3-Wheeler 2 -Wheeler
HMV 362 41 15 0
LMV 115 2580 43 15
3-Wheeler 0 42 840 49
2-Wheeler 0 15 43 515
Accuracy= 91.8%
5. CONCLUSIONS
In our proposed algorithma multi-feature density based algo-rithm for vehicle classification, where KDA is used with multiple features such as RGB, Grad, Haar and PHOG. For classification, an SVM using the probability vectors from the given feature set is employed. Our classification algorithm shows better perfor-mance in combination with KDA than with KDE and just the features alone.
6. REFERENCES
[1] H. Bai, J. Wu, and C. Liu. Motion and haar-like features based vehicle detection. InMulti-Media Modelling Con-ference Proceedings, 2006 12th International, pages 4–pp. IEEE, 2006.
[2] Y. Bai, L. Guo, L. Jin, and Q. Huang. A novel fea-ture extraction method using pyramid histogram of orien-tation gradients for smile recognition. InImage Process-ing (ICIP), 2009 16th IEEE International Conference on, pages 3305–3308. IEEE, 2009.
[3] N. Buch, J. Orwell, and S. Velastin. 3d extended his-togram of oriented gradients (3dhog) for classification of road users in urban scenes. 2009.
[4] N. W. Campbell, B. T. Thomas, and T. Troscianko. Au-tomatic segmentation and classification of outdoor images using neural networks. International Journal of Neural Systems, 8(01):137–144, 1997.
[5] P. Gehler and S. Nowozin. On feature combination for multiclass object classification. InComputer Vision, 2009 IEEE 12th International Conference on, pages 221–228. IEEE, 2009.
[6] B. Han, D. Comaniciu, and L. Davis. Sequential ker-nel density approximation through mode propagation. In Proceeding of European Conference on Computer Vision, 2004.
[7] B. Han, D. Comaniciu, Y. Zhu, and L. Davis. Sequential kernel density approximation and its application to real-time visual tracking.Pattern Analysis and Machine Intelli-gence, IEEE Transactions on, 30(7):1186–1197, 2008. [8] A. Haselhoff and A. Kummert. A vehicle detection system
based on haar and triangle features. InIntelligent Vehicles Symposium, 2009 IEEE, pages 261–266. IEEE, 2009. [9] L.-L. Huang, A. Shimizu, Y. Hagihara, and H. Kobatake.
Gradient feature extraction for classification-based face de-tection.Pattern Recognition, 36(11):2501–2511, 2003. [10] O. Javed, K. Shafique, and M. Shah. A hierarchical
ap-proach to robust background subtraction using color and gradient information. In Motion and Video Computing, 2002. Proceedings. Workshop on, pages 22–27. IEEE, 2002.
[11] Y.-x. Jin, K. Zhang, J. T. Kwok, and H.-c. Zhou. Fast and accurate kernel density approximation using a divide-and-conquer approach. Journal of Zhejiang University SCI-ENCE C, 11(9):677–689, 2010.
[12] M. Kafai and B. Bhanu. Dynamic bayesian networks for vehicle classification in video. Industrial Informatics, IEEE Transactions on, 8(1):100–109, 2012.
[13] G. Khairun Nor Aimi. Palm oil classification using RGB and fuzzy. PhD thesis, Universiti Malaysia Pahang, 2010. [14] A. Klaser and M. Marszalek. A spatio-temporal descriptor
[image:5.595.54.274.109.221.2][15] X. Li, H. Fu, and J. Xu. Automatic vehicle classifica-tion based on video with bp neural networks. In Wire-less Communications, Networking and Mobile Computing, 2008. WiCOM’08. 4th International Conference on, pages 1–3. IEEE, 2008.
[16] X. Liu and T. Yu. Gradient feature selection for online boosting. In Computer Vision, 2007. ICCV 2007. IEEE 11th International Conference on, pages 1–8. IEEE, 2007. [17] S. Messelodi, C. M. Modena, and G. Cattoni. Vision-based bicycle/motorcycle classification. Pattern recognition let-ters, 28(13):1719–1726, 2007.
[18] N. R. Mudigonda, R. Rangayyan, and J. E. L. Desautels. Gradient and texture analysis for the classification of mam-mographic masses. Medical Imaging, IEEE Transactions on, 19(10):1032–1043, 2000.
togram of oriented gradients features. InIntelligent Vehi-cles Symposium (IV), 2010 IEEE, pages 921–928. IEEE, 2010.
[20] Z. Sun, G. Bebis, and R. Miller. Quantized wavelet fea-tures and support vector machines for on-road vehicle de-tection. InControl, Automation, Robotics and Vision, 2002. ICARCV 2002. 7th International Conference on, volume 3, pages 1641–1646. IEEE, 2002.
[21] E. Tasnim and A. Ghani.Pineapple distribution classifica-tion using RGB and fuzzy. PhD thesis, Universiti Malaysia Pahang, 2010.