Time-Frequency Filtering with the S-Transform of ECG
Signals
J.P.Agrawal*, Ritu Vijay**
*Department of Electronics and Communication Engineering, VIT (East), Jaipur-302022 INDIA e-mail: [email protected] ** AIM & ACT, Banasthali University, Banasthali Vidyapith-304022 INDIA
Abstract- A key feature of the S-transform is that it uniquely combines a frequency dependent resolution of the time-frequency space and absolutely referenced local phase information. The S-transform is a time-frequency representation known for its local spectral phase properties. In this paper, a method to process non-stationary signal, such as electrocardiograms (ECG) based on transform, in which a filter is applied to a time frequency distribution instead of the Fourier spectrum. Such distribution is the S-transform, a modified short-time Fourier transform whose window scales with frequency, as in wavelets.
Index Terms- S-transform, Electrocardiograms, Time frequency filter, Wavelet
I. INTRODUCTION
he limitations of frequency domain filtering techniques have motivated the development of alternative techniques, such as time frequency distribution instead of the Fourier spectrum. S-transform is modified short time Fourier transforms whose window scales with frequency, as in wavelets. There is need for filters with time-varying pass-bands and reject-bands that can be applied to an invertible time frequency representation of the signal that is similar to Fourier-domain filtering except need to be two dimensional to accommodate the extra time dimension [1-4].
To derive the S transform [5-8] as the “phase correction” of the CWT. The CWT W (τ, d) of a function h (t) is defined by
( ) ∫ ( ) ( ) (1)
Where w (t, d) is a scaled replica of the fundamental mother wavelet. The dilation d determines the “width” of the wavelet w (t, d) and thus controls the resolution.
The S transform of a function h (t) is defined as a CWT with a specific mother wavelet multiplied by the phase factor,
( ) [ ] ( ) (2)
where the mother wavelet is defined as
( ) √ | | [ ] [ ] (3)
Note that the dilation factor d is the inverse of the frequency f.
The wavelet in (3) does not satisfy the condition of zero mean for an admissible wavelet; therefore, (2) is not strictly a CWT. The continuous S-transform of a function h (t) is
( ) ∫ ( ) √ | | [ ( ) ] [ ] (4)
It is easy to show that
∫ ( ) ( ) (5)
(Where H (f) is the Fourier transform of h (t)). It follows that h (t) is exactly recoverable from S (τ, f).
( ) ∫ {∫ ( ) } [ ] (6)
Thus this is clearly distinct from the concepts of the CWT.
In the discrete transform, there are computational advantages to using the equivalent frequency domain definition of the S-transform.
Let h [kT], k = 0, 1 . . . N- 1 denote a discrete time series corresponding to h (t) with a time sampling interval of T. The discrete Fourier transform is given by [5]
[ ] ∑ [ ]
[ ] (7)
where n = 0, l, . . . N- 1. In the discrete S- transform, the projection of the vector defined by the time series h [kT] onto a spanning set of vectors. Each basis vector (of the Fourier transform) is divided into N localized vectors by an element-by-element product with the N shifted Gaussians such that the sum of these N localized vectors is the original basis vector.
[ ] ∑ [ ]
[ ] [ ] (8)
For n=0, it equal to the constant as
[ ] ∑ [ ]
(9)
Where j, m, and n=0, 1… N-1. The sampling of the S-transform is such that S [ jT, n/NT ] has a point at each time sample and at each Fourier frequency sample. The discrete inverse of the S-transform is found by averaging over time to get the Fourier transform spectrum, and inverting to the time domain
[ ] ∑ { ∑ [ ]
}
[
] (10)
The existence of an inverse S-transform [9-10] makes time-frequency filtering. In standard Fourier domain filtering, S can be multiplied with a user defined time frequency filter F. The product of S×F in place of S in (10) then gives hF[kT],
[ ] ∑ { ∑ [ ]
[ ]}
[
] (11)
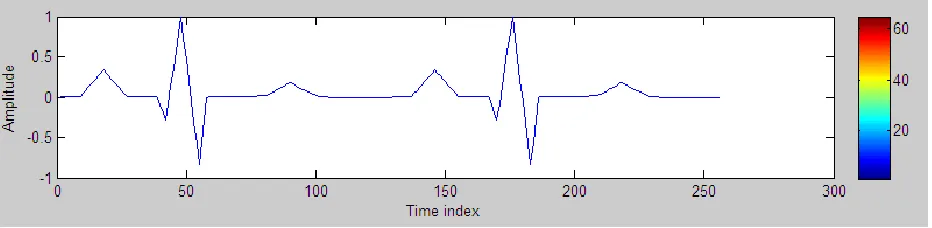
Electrocardiogram (ECG) is widely used for diagnosing many cardiac diseases, which are one of the prime causes of mortality all over the world. ECG is a graphical representation of electrical impulses due to ionic activity in the cardiac muscles of human heart. The electrical pulses generated due to this electrical activation are propagated along the cell fiber and transmitted to adjoining cells. The result is generation of electrical impulses, which travels through the cardiac surface. These electrical impulses can be detected by surface electrodes, amplified and displayed as the ECG. It is an important physiological signal, which is exploited to diagnose heart diseases because every arrhythmia in ECG signals can be relevant to a heart disease [11-13]. Figure 1(a) shows the original ECG replicate signals, Fig. 1(b) shows the S-transform of the original ECG signal, Fig. 1(c) shows the reconstructed ECG signal without filter.
[image:2.612.76.542.616.730.2](b)
(c)
Figure 1: (a) Original ECG signals. (b) S-transform of ECG signals. (c) Reconstructed time series signals without filter.
II. TIMEFREQUENCYFILTERINGWITHS-TRANSFORM
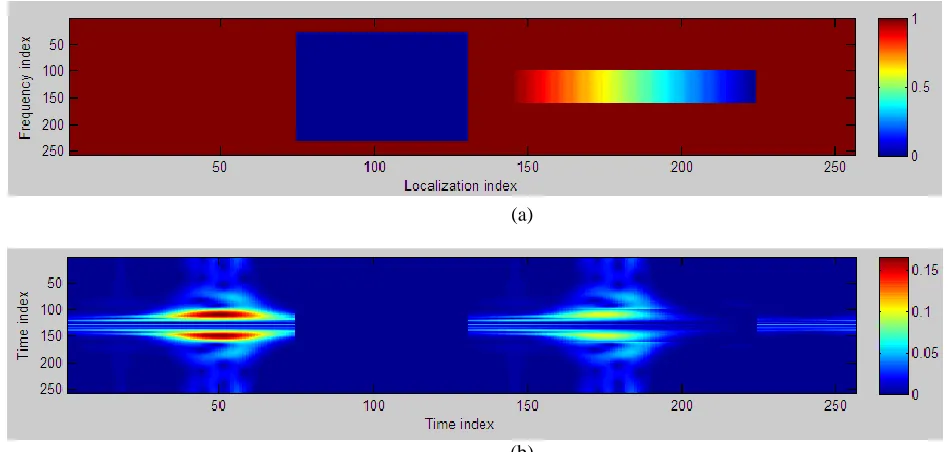
Figure 2(a) shows two simple time–frequency filters. The first filter is a two-dimensional filter, designed to set part of the S-transform equal to zero; the second filter progressively reduces the amplitudes of selected frequencies of the S-S-transform at selected times. To ensure that hFis real when h is real, F must satisfy
F [τ, f] = F [τ, −f]* (12)
Figure 2(b) shows the SF-transform from Fig. 1(b) after the application of these two filters. The time–frequency signatures of the high and low-frequency signal components are muted partly, and have abrupt edges where they have been multiplied with the boxcar filter. The reconstructed time series ECG signals appears in Fig. 2(c). Comparison of Fig. 3(c) with Fig. 2(c) shows that the filtering is indeed time-dependent, but also shows that it has affected parts of the time series whose corresponding columns of SFwere not changed by the filter. The start and end times of the first boxcar filter is most evident immediately before τ = 74, and immediately after τ = 129, but the start and end time of the second boxcar filter is most evident before τ = 144, and after τ = 224. Comparison of Fig. 3(c) with Fig. 2(c) shows that the second filter progressively reduce the amplitude of selected frequencies of the S-transform at selected time.
(a)
[image:3.612.71.540.50.265.2] [image:3.612.45.521.502.728.2](c)
Figure 2: (a) Time frequency filter. (b) Filtered SF-transform produced time frequency filtering of the S-transform of Fig. 1(b). (c) Filtered hF[t] time series ECG signal.
III. CONCLSION
Through use of the S-transform I have introduced time frequency filtering of ECG signals. First filter between 129 ˃ τ ˃ 74 set the S-transform equal to zero. The second filter between 224 ˃ τ ˃ 144 progressively reduces the amplitude of selected frequency of the S-transform as shown in figure 3(b). Figure 3(c) shown the reconstructed output of ECG beat after filtering of all frequencies, the first filter is used set zero of S-transform between the two ECG beat. Second filter is between second ECG beat that, time smearing occurs.
APPENDIX The following Matlab program produces the data plotted in Fig. 2:
h1 = ecg(128); h = repmat(h1,1,2); N = length(h);
H = [fft(h) fft(h) fft(h)]; al = [0:floor(N/2)-1,
-floor(N/2):-1]; for f=1:floor(N/2-1) W=exp(-2*pi^2*al.^2./
((f-(N/2)-1).^2)); S(f,:) = ifft(H(f+(N/2):
f+(N/2)+N-1) .* W); end
S(N/2+1,:) = ifft(H(N+1:2*N) .* [1 zeros(1,N-1)]); F = ones(N,N);
F(N/2+1+[-101:0 0:101], 75:130) = 0;
F(N/2+1+[-30:30], 144:224) = ones(61,1)*[80:-1:0]/80; S_F = S.*F;
h_f= sum(ifft(fftshift(S_F,1),[],1),2);
Here F, S_F and h_f are equivalent to F, SF and hF. The S- transform produced by the program includes both negative and positive frequencies, with the DC frequency occurring at the (N/2 + 1) row of S. This definition of F includes a “mirror image” of the filter shown in Fig. 2.
REFERENCES
[1] C.R. Pinnegar and L. Mansinha “Time-local Fourier analysis with a scalable, phase-modulated analyzing function: the
S-transform with a complex window” Signal Processing, vol. 84, 2004, pp. 1167 – 1176.
[3] C.R. Pinnegar and L. Manisinha “Time–Frequency localization with the Hartley S- transform” Signal Processing, vol. 84, 2004, pp. 2437-2442.
[4] M.D. Adams, F. Kossentini and R. K. Ward “Generalized S Transform” IEEE trans. on signal processing, vol. 50, NO. 11, Nov. 2002, pp. 2831-2842.
[5] C. R. Pinnegar and D. Eaton “Application of the S transform to prestack noise attenuation filtering” Journal of Geophysical Research, vol. 108, No. B9, 2422.
[6] Soo-Chang Pei, Pai-Wei Wang, Jian-Jiun Ding and Chia-Chang Wen “Elimination of the discretization side-effect in the S transform using folded windows” Signal Processing, vol. 91, 2011, pp. 1466–1475.
[7] R. G. Stockwell, L. Mansinha, and R. P. Lowe “Localization of the Complex Spectrum: The S Transform” IEEE trans. on signal processing, vol. 44, NO. 4, APRIL 1996, pp. 998-1001.
[8] M. Weishi and G. Jinghuai “Statistical denoising of signals in the S-transform domain” Computers & Geosciences, vol. 35, 2009, pp. 1079–1086.
[9] M. Schimmel and J. Gallart “The Inverse S-Transform in Filters with Time-Frequency Localization” IEEE trans. on signal processing, vol. 53, NO. 11, Nov. 2005, pp. 4417-4422.
[10] C.R. Pinnegar “Generalizing the TT-transform” Digital Signal Processing, vol. 19, 2009, pp. 144-152.
[11] S. Banerjee, R. Gupta and M. Mitra “Delineation of ECG characteristic features using multiresolution wavelet analysis method” Measurement, vol. 45, 2012, pp. 474–487.
[12] Yakup Kutlu, and Damla Kuntalp “Feature extraction for ECG heartbeats using higher order statistics of WPD coefficients” Computer methods and programs in biomedicine, vol. 105, 2012, pp. 257-267.
[13] Md. Ashfanoor Kabir and Celia Shahnaz “Denoising of ECG signals based on noise reduction algorithms in EMD and wavelet domains” Biomedical Signal Processing and Control, Vol. 7, 2012, pp. 481-489.
AUTHORS
J.P. Agrawal- is born in Rajasthan, India on September 15, 1975. He has completed his B.E. (Electronics) from Nagpur University, Nagpur, Maharashtra and M.Tech. (Electronics and Communication Engineering) from MNIT, Jaipur, Rajasthan, India in year 1999 and 2005 respectively. He is pursuing Ph.D from Bansthali Vidhyapeeth, Bansthali, Rajasthan. He has contributed in publication of 2 technical papers in journals and 6 books. His current areas of research are signal processing and Medical image compression using wavelet transform and S-transform.
E-mail: [email protected]
Ritu Vijay received her B.Sc ( Electronics), M.Sc.(Electronics) and Ph.D degree from university Banasthali Vidyapith, Banasthali, India. She has 15 year teaching experience. She has contributed 30 technical papers in various national ans international journals and conferences and 2 books. She is also Principal investigator of project funded by department of electronics, Govt. of India, New Delhi. Her research interests include signal processing, image compression.
E-mail:[email protected]