DETECTION OF PROXIMITY TO VOLTAGE COLLAPSE OF MULTI-BUS
POWER NETWORK USING TRANSMISSION LINE VOLTAGE
STABILITY INDICATOR
Gitanjali Saha1, Kabir Chakraborty1 and Priyanath Das2
1Tripura Institute of Technology, Narsingarh, Tripura, India 2National Institute of Technology, Jirania, Tripura, India
E-Mail: [email protected]
ABSTRACT
Recent trends reveals that in order to operate the modern transmission and distribution power system networks with maximum reliability and security, a power system operator must have the knowledge of the voltage stability margin. It has become a challenging task to accomplish fast and accurate indications of voltage stability margin in power systems. In this paper a new voltage stability indicator has been proposed considering the Line charging susceptance based on unique equivalent Two - Bus π network system applying the fundamental Kirchoff - Laws. With the help of this proposed indicator, an operator can efficiently and quickly detect the proximity of a voltage collapse for a multi-bus system. This voltage stability indicator is defined as Transmission Line Voltage Stability Indicator (TLVSI) for online monitoring of a system. The proposed indicator has been incorporated on the IEEE 5-bus and IEEE.14-bus system considering the several power system topology and many contingency scenarios. This voltage stability indicator can also be used to find the effect of change of active load on the system and its relation with the receiving end voltage and the transmission line critical voltage to detect the most vulnerable spots of the system..
Keywords: equivalent two- bus π network model; voltage stability; voltage collapse; transmission line voltage stability indicator
1. INTRODUCTION
In last few years the scenario of modern restructured power systems reveals that the problems related to voltage stability has become a serious threat and highly complex related to planning and operations of power systems. Major system blackouts mostly occurs due to expanding of power system to accommodate the rapid load growths by constructing new power plants, transmission lines, substations, and control devices. Voltage collapse is most likely to occur when a power system is operated near its capacity limits.
Operating within operational design limits makes power system more protected and secure. Mostly the power systems operate close to their capacity limits so it makes us necessary to have a proper analysis of the system and to implement a reliable method to have an accurate and successful identification of probable voltage collapse before their occurences (F.A. Althowibi, 2013 and Kabir Chakraborty).
The main factor causing instability is the inability of the power system to meet the demand for reactive power. When a disturbance increases in load demand a power system becomes unable to maintain steady state voltages leads to voltage instability in the buses. Due to limited economical, resources, environmental, technical and political restrictions, some electric utilities are forced at such level from expansion of power generation and transmission even though the power demand has increased substantially .As a result of which some of the transmission lines gets heavily loaded or stressed and causes voltage instability i.e uncontrollable or abnormal fall of voltage. In modern power scenario due to frequent incidence of blackouts , power system researchers has now given much attention to establish various new techniques
to find the voltage stability margins prior to voltage collapse (O.P. Rahi, 2012).
Analysis of voltage stability is done conventionally by two approaches i.e. static and dynamic (Kundur P. 1994 and Hadi Sadat, 2004). Static approach is done by steady-state load flow analysis which is done with the help of voltage stability indicators. These indicators reveals the critical bus of a power system or how far is the actual system’s operating point is from the voltage stability limit (Partha Kayal, 2012 Claudia Reis, 2006 S.Perez-Londono,2014 Garng M.Huang).Another method involves the analysis of Eigenvalue-Eigenvector of the power system Jacobian Matrix for the evaluation of the voltage stability of the power system (Nayan N,2014 Dr. Enemuoh F.O, 2013).
Apart from all these it is also observed that for the last few years researchers have shown their interest in Network Reconfiguration Method on Distribution system for improvement of voltage stability (Sahar Aslanzadeh, 2014). In this paper the concept of reduction of any multi-bus power system into an equivalent two - multi-bus system has been utilized to have a quick overview of the power transmission system voltage stability (Nagendra Palukuru, 2014 C.K.Chanda,2004 Nagendra P. Datta, 2010).
capacitors are used to improve the power factor. The improved power factor reduces the KVA drawn from the supply. The power losses are reduced and the efficiency is increased. Thus, shunt capacitors regulate the voltage and reactive power flows at the point where they are installed (Ashfaq Husain).
Notation
The notation used throughout the paper is stated below.
Vg = slack bus voltage
VL = power transmission receiving end voltage Vtlcr = power transmission critical voltage Sg = generated power of slack bus SL = generated power of load bus Pg = generated active power of slack bus PL = generated active power of load bus Zeq = equivalent line impedance
Iss = shunt branch current at the sending end Isr = shunt branch current at the receiving end Θ = line angle in radian
Δ = power angle in radian
Ysr = equivalent line charging susceptance
2. PROBLEM FORMULATION
Modeling of the Equivalent Two - Bus π network System and Formulation of the Transmission Line Voltage Stability Indicator.
Any multi- bus power transmission system can be reduced to an equivalent two- bus network with Bus No.1 as the slack bus with voltage Vg and Bus No.2 as the load
bus with voltage VL at the receiving end. The generated power of bus1 is Sg = Pg + jQg and the load of bus 2 is SL = PL + QL. The slack bus and the load bus are connected by an equivalent impedance of Zeq which is given as
where
=
2 2
/ 2loss
g g g
P
P Q V =
2 2
2– /
g L
g g g
P P
P Q V
=
2 2
–
g L
g g
P P
P Q
=
2 2
/ 2loss
g g g
Q
P Q V =
2 2
2– / g L
g g g
Q Q
P Q V
=
2 2
–
g L
g g
Q Q
P Q
The above equations are for the two-bus equivalent network assuming the slack bus orbus no.1 voltage magnitude as 1.0 pu.
(1)
The load bus voltage at the receiving end of the equivalent two-bus network is given by
L g
V V ‒ eq
g g
gZ P jQ
V
(2)
Figure-1. Equivalent π model of 2-bus network for the proposed methodology.
From Figure 1, at node n:
= g L eq
V V
Z
‒ .V YL sr
Again, = L L S V
L
L S V =
g L
eq
V V
Z
‒ .V YL sr
L
S = 1 . (L g L) L2. sr eq
V V V V Y
Z
= V VL g ‒ 2 L
V ‒ VL2.Ysr
= V VL g ‒ 2 L V .
=
V V cosg L
1 2
jV V sing L
1 2
‒ VL2 (3)eq eq eq
Z
R
jX
eq R
eq X
Z
eq
R
eq
jX
eqVg Zeq=Req+jXeq
I1 m n I2
Isr SL
Yss Ysr Load
VL
Iss
Sg
Pg+jQg
2 sr
I
I
I
2
–
srI
I
I
2
I
1
eq
Z
.
1
eq Z
1
eq Z
1 sr eq
Y Z
1
eq
Z .
1
sr eq
Y Z
Let equation(3) be equal to
L
S = (4)
Now equating the real and imaginary parts of equation (4) we can write
and where and are the real power and reactive power respectively.
= V V cosg L 1 2 ‒ VL2. (5)
= V V sing L
1 2
(6)Now taking the derivatives of and w.r.t
L
V
and where == ‒ . V Vg L (7)
L dP
dV = . Vg ‒ 2VL (8)
= .V Vg L (9)
L dQ
dV = .
V
g (10)Now substituting the expressions of equations 7, 8, 9, 10 in the Jacobian Matrix we get
1 1 1
. .
1 2
1
. .
g L g L sr
eq eq eq
g L g
eq eq
V V sin V cos V Y
Z Z Z
V V co J
s V sin
Z Z (11)
At voltage stability limit, considering the singularity of Jacobian Matrix i.e,
Det (J) = 0
2 2
2
1 1 1 2 1
g L g L g L sr
eq eq eq
eq
V V sin V V cos V cos V Y
Z Z Z
Z
(12)
Simplifying equation (12) we get 1 . 1 2 L g eq sr eq V V
Z Y cos
Z (13)
Where = equivalent line charging susceptance
=
(14)
Substituting equation (13) in equation (12) will give 2 2 1 . 2 tlcr g eq eq eq eq V V X Z cos R X j (15)
The above expression for the voltage is the expression for the transmission line critical voltage at the proximity of the voltage stability limit.
Equation (2) gives the transmission line receiving end voltage of the equivalent two-bus network whereas equation (15) gives the transmission line critical voltage at the receiving end of the proposed equivalent π model two-bus network considering the equivalent line charging susceptance at the receiving end. The difference between these two voltages will become zero at the point of voltage collapse. Thus the proposed transmission line voltage stability indicator is the difference between the two voltages.
Thus, Transmission Line VSI (TLVSI) = VL ‒ Vtlcr (16) Algorithm of the proposed Methodology
The algorithm for the proposed system simulation is given below:
Step 1: Solve by NR method the power flow for base case load.
Step 2: Reduce the multi-bus network into an equivalent π model of 2-bus network.
Step 3: Determine the weakest bus of the given multi-bus system by reactive power sensitivity index and the transmission line VSI for base case load.
Step 4: Increase the load of the weakest bus in small steps and determine the transmission line critical voltage, transmission line receiving end voltage, weakest bus voltage till the iterative process converges.
Step 5: Repeat Step 3. Step 6: Stop.
case study
3. SIMULATION RESULTS AND DISCUSSIONS The power flow analysis by NR method has been done by computer software programming developed in the MATLAB environment. The proposed algorithm has been tested on IEEE 5-bus and IEEE 14-bus system. At first the weakest bus of the multi-bus system is identified. This is
a
jb
a
jb
P
a
Q
b
P
Q
P
a
1 .eq Z 1 sr eq Y Z
Q
b
1 .eq Z
P
Q
1–
2 dPd 1
eq
Z
sin
1
eq
Z
cos
1 sr eq Y Z dQ d 1 eq Z cos
1 eqZ sin
0
done from the diagonal elements of the sub-matrix of Jacobian matrix where the partial derivatives of reactive powers with respect to relevant voltages is calculated i.e. J4. Table-1 gives the values of diagonal elements of J4 i.e. dQ/dV with the respective bus numbers for the IEEE 5-bus system and Table-2 gives the values of the same for the IEEE 14-bus system.
Table-1. Values of the diagonal elements of dQ/dV for IEEE 5-bus system.
Bus No. 2 3 4 5
Elements of
dQ/dV 33.5218 38.6437 38.6450 10.9548
Table-2. Values of the diagonal elements of dQ/dV for IEEE 14-bus system.
Bus No. Elements of dQ/dV
2 30.47
3 9.6857
4 38.1292
5 34.9319
6 17.1865
7 19.6676
8 6.0475
9 23.5967
10 14.5022
11 8.3387
12 5.2699
13 10.2969
14 4.5169
For IEEE 5-bus system the smallest value ofdQ/dV = 10.9548 which is for bus no. 5.As dQ/dV is low, dV/dQ will be high indicating large change in voltage for variation of reactive power of the bus. Thus bus 5 has been diagnosed as the weakest bus for the system. Whereas for IEEE 14-bus system, bus no. 14 has been identified as the weakest bus with a smallest value of dQ/dV = 4.5169. To present the simulation results of the proposed Algorithm, the weakest bus has been chosen as it has the highest sensitivity towards voltage stability.
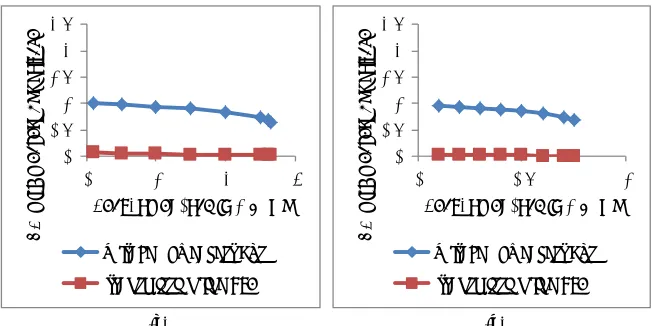
The load in the weakest bus is gradually increased at an increment of 5% of base value until the system collapse. Table 3 shows the data for transmission line receiving end voltage given by equation (2) and the transmission line critical voltage given by equation (15)with the real power load in the weakest bus for equivalent two-bus system of IEEE 5-bus system. The plotting of the data from Table-3 has been shown in Figure-2(a). Table-4 shows the data for transmission line receiving end voltage and the transmission line critical voltage with the real power load in the weakest bus for equivalent two-bus system of IEEE 14-bus system. The plotting of the data from Table 4 has been shown in Figure-2(b).
Table-3. Data for IEEE 5-bus in the weakest bus.
Load Transmission line receiving end voltage
Transmission line critical voltage
0.1 0.6169 0.5411
0.5 0.5841 0.5221
1.0 0.561 0.5124
1.5 0.5475 0.5079
2.0 0.5387 0.5054
2.5 0.5326 0.504
2.6 0.5316 0.5038
2.65 0.5311 0.5036
Table-4. Data for IEEE 14-bus system in the weakest bus.
Load Transmission line receiving end voltage
Transmission line critical voltage
0.1 0.5271 0.5057
0.2 0.5257 0.5052
0.3 0.5244 0.5048
0.4 0.5233 0.5044
0.5 0.5222 0.5041
0.6 0.5213 0.5038
0.7 0.5204 0.5036
0.75 0.52 0.5034
0.2 0.4 0.6 0.8 1
0 0.5 1 1.5 2 2.5 3
Tr
an
sm
issio
n
Li
n
e
Vo
lt
ag
e
in
p.
u.
Real Power Load in MW p.u.
transmission line receiving end voltage
transmission line critical voltage
0.4 0.5 0.6 0.7 0.8
0 0.2 0.4 0.6 0.8
Tr
an
sm
issi
o
n
Li
n
e
Vo
lt
ag
e
in
p.
u.
Real Power Load in MW p.u.
transmission line receiving end voltage transmission line critical voltage
[image:5.612.133.476.62.243.2](a) (b)
Figure-2. Relation between Power transmission receiving end voltage and Power transmission critical voltage.
a) For IEEE 5-bus system b) For IEEE 14-bus system
The plots 2(a) and 2(b) reveals that the difference between the transmission line receiving end voltage and the transmission line critical voltage becomes zero at the proximity of voltage collapse. Thus the proposed transmission line voltage stability indicator (TLVSI) given by equation (16) tends to zero for both the multi-bus systems at the point of voltage collapse.
Figure 3(a) and 3(b) represent the PV curves of the weakest bus of the respective system which also represent a plot of TLVSI against the change in real power load of the weakest bus for equivalent two-bus system of IEEE 5-bus and 14-bus systems respectively.
0 0.5 1 1.5 2 2.5
0 1 2 3
VS
I
wi
th
wea
ke
st
bus
vo
lt
ag
e
Real Power Load in MW p.u.
voltage of weakest bus
transmission line VSI
0 0.5 1 1.5 2 2.5
0 0.5 1
VS
I
wi
th
wea
ke
st
bus
vo
lt
ag
e
Real Power Load in MW p.u.
voltage of weakest bus
transmission line VSI
[image:5.612.143.470.395.558.2](a) (b) Figure-3. Effect of Transmission Line VSI on system collapse.
a) For IEEE 5-bus system b) For IEEE 14-bus system
From Figure 3(a) and 3(b) it is observed that the voltage collapse point as obtained from PV curve and from TLVSI are almost identical (TLVSI becomes zero at voltage collapse point), which validate the effectiveness of proposed indicator. Thus the proposed TLVSI can be an effective quantitative measurement for the multi-bus system to find out how far is the current state of the system to the voltage collapse point. Thus the proposed method will help the power system operator to make a fast detection of the voltage stability of any current state of the system. In both the cases i.e. IEEE 5-bus system and IEEE
4. CONCLUSIONS
In this paper a new and fast method has been developed to detect the voltage collapse point prior to its happening. The methodology involves the reduction of a multi bus system into an equivalent π model of 2-bus network considering the effect of line charging susceptance. This indicator has been tested on IEEE 5-bus and IEEE 14-bus system to find out the voltage collapse point and the result is compared with a standard method for finding out voltage collapse point of a system i.e. PV curve method. The voltage collapse point obtained by both methods is almost identical, which supports the validity and accuracy of the proposed methodology. As the proposed TLVSI is based on the equivalent 2-bus network, it helps us to avoid the complications related to the mathematical derivation of a multi-bus system. Hence, the proposed indicator is very simple and helps the operator to assess the stability of the multi bus system very easily.
REFERENCES
F.A. Althowibi,M.W. Mustafa, 2013 Power System Voltage Stability: Indications,Allocations and Voltage Collapse Predictions: International Journal of Advanced Research in Electrical, Electronics and Instrumentation Engineering. 2(7).
Kabir Chakraborty, Abhinandan De and Abhijit Chakrabarti, 2010 Assessment of Voltage Security in a Multi-bus Power System using Artificial Neural Network and Voltage Stability Indicators: J. Electrical Systems. 6-4: 517-529.
O.P. Rahi, Amit Kr Yadav, Hasmat Malik, Abdul Azeem, Bhupesh Kr. 2012 Power System Voltage Stability Assessment through Artificial Neural Network: Elsevier Procedia Engineering. 30, 53-60.
Kundur P. 1994 Power system stability and control. New York: McGraw-Hill.
Hadi Sadat, 2004 Power System Analysis, TATA McGraw-HILL.
Partha Kayal, C.K. Chanda and Tamal Dutta, 2012 Efficient Distribution System realization using Equivalent Voltage Stability Indicator: IACSIT International Journal of Engineering and Technology,Vol.4, No.3,June.
Claudia Reis, F.P.Maciel Barbosa, 2006 A Comparison of Voltage Stability Indices: IEEE MELECON, May 16-19, Benalmadena (Malaga), Spain.
S. Perez-Londono, L.F. Rodriguez, G. Olivar. 2014. A Simplified Voltage Stability Index (SVSI). Elsevier (Electrical Power and Energy Systems. (63): 806-813.
Garng M. Huang, Liang Zhao, Measurement Based Voltage Stability Monitoring of Power System: Texas
Nayan N. Pandya, Hemant I. Joshi, Bhavik N. Suthar, 2014. Identification of Weak Bus and Voltage Stability Enhancement. IJIREEICE. 2(4).
Dr. Enemuoh F.O., Dr. Onuegbu J.C. and Dr. Anazia E.A. 2013. Modal based Analysis and Evaluation of Voltage stability of Bulk Power System.: International Journal of Engineering Research and Development. .6(12): 71-79.
Sahar Aslanzadeh, Mohammad Kazeminejad and Alireza Gorzin. 2014. Comparision of voltage stability indicators in distribution systems. : Indian J. Sci. Res. 2(1): 5-10.
Nagendra Palukuru,Sunita Halder nee Dey, Tanaya Datta, Subrata Paul. 2014. Voltage Stability assessment of a Power System incorporating FACTS Controllers using unique network equivalent. Ain Shams Engineering Journal. 5, 103-111.
C.K. Chanda, A. Chakraborti and S. Dey. 2004. Development of Global Voltage Stability Indicator (VSI) and role of SVC on it in longitudinal power supply (LPS) system. Elsevier (Electrical Power and System Research. (68): 1-9.
Nagendra P.Datta T, Halder S, Paul S. 2010. Power system voltage stability assessment using network equivalents - a review: J Appl Sci. 10(18): 2147-53.