ScholarWorks @ Georgia State University
Biology Theses Department of Biology
8-7-2018
Effect of Monoethanolamine on the Lipid
Metabolism of Prostate Cancer Cells
Jennifer McFaline-Figueroa
Follow this and additional works at:https://scholarworks.gsu.edu/biology_theses
This Thesis is brought to you for free and open access by the Department of Biology at ScholarWorks @ Georgia State University. It has been accepted for inclusion in Biology Theses by an authorized administrator of ScholarWorks @ Georgia State University. For more information, please contact
Recommended Citation
McFaline-Figueroa, Jennifer, "Effect of Monoethanolamine on the Lipid Metabolism of Prostate Cancer Cells." Thesis, Georgia State University, 2018.
CANCER CELLS
by
JENNIFER MCFALINE-FIGUEROA
Under the Direction of Ritu Aneja, PhD
ABSTRACT
The ability of cancer cells to synthesize and store lipids in the form of lipid droplets (LDs) gives
them a proliferative advantage over normal cells. Here, we elucidate the effect of
monoethanolamine (Etn) on the lipid metabolism of LD-rich prostate carcinoma (PC3) cells. Etn
is a ubiquitous molecule that serves as a phospholipid precursor and has been shown to have
anticancer activity, although its mechanism of action is not fully understood. PC3 cells were
treated with Etn and evaluated with a combination of biochemical and cell biology techniques.
Treatment with Etn caused a decrease in cytosolic LD abundance induced by Ca2+-stimulated
lipolysis. Our study effectively implicates the disruption of lipid metabolism as a contributor to
Etn-induced cell death. This finding opens new avenues for the development of LD-targeted
anticancer therapy.
CANCER CELLS
by
JENNIFER MCFALINE-FIGUEROA
A Thesis Submitted in Partial Fulfillment of the Requirements for the Degree of
Master of Science
in the College of Arts and Sciences
Georgia State University
Copyright by
CANCER CELLS
by
JENNIFER MCFALINE-FIGUEROA
Committee Chair: Ritu Aneja
Committee: Vincent Rehder
Liana Artinian
Electronic Version Approved:
Office of Graduate Studies
College of Arts and Sciences
Georgia State University
DEDICATION
For my family, and their well-practiced ability not to freak out when I tell them of my life
choices, last minute.
ACKNOWLEDGEMENTS
I would be remiss to think that my experience at Georgia State has been an isolated journey.
Before I get bogged down mentioning all the people who have been critical in my graduate school
career, I would like to extend my thanks to the whole Biology department at GSU. From the
professors, to the administrators, to the maintenance people, you all made sure that this experience
was the best I could possibly have, and for that I am eternally grateful.
First and foremost, I would like to thank my PI and my thesis committee for all of their
support. I appreciate Dr. Aneja for taking me on as a graduate student and allowing me to work in
her lab. To my committee members Dr. Rehder and Dr. Artinian for all of their help, guidance and
encouragement as I undertook this project. Dr. Artinian and I met during the Summer semester
when I was TA’ing a course for Dr. Aneja, and it led to the most wonderful collaboration that
turned into my thesis project. Her energy and passion for science and her belief that there is always
an experiment to be done inspires me to be a better researcher. Through her, I met Dr. Rehder,
who has been, from the moment I met him, a knowledgeable, honest voice of reason, reminding
me to always look at the big picture. As a committee, the three always made sure that I was clear
on what my goals were, to examine my data with a critical eye, and to ask myself the “what”,
“where” and “why” before I drew any conclusion.
In this journey, I am often reminded of the people who helped me get here, and the places
where I learned how to be a good scientist. I would like to thank my undergraduate institution,
University of Puerto Rico- Mayaguez, along with my PI, Dr. Juan Lopez-Garriga and my graduate
mentor, Elddie. You were the first to ignite my passion for research, and you remain, to this day,
Temenoff and all my T-Lab buds, for helping me expand my scientific interests, granting me every
opportunity to grow as a researcher, and for simply being my friends.
I would like to thank my lab members and other science friends I have made at GSU, in
particular Ahmed, Nikita, Kimberly, Amanda, Barielba and Felipe. Our goals are vastly different
from each other, but I am grateful that our paths have crossed, and I hope to remain in contact with
you, long after our graduation. Thanks for all of your help in lab, for making me laugh whenever
I was feeling stressed, or just having intense debates about absolutely nothing of merit while we
worked. I cannot imagine my time at GSU without you guys. Thank you so much for being there
when it mattered.
My family deserves my appreciation more than what I can put into words. I gave my family
three weeks’ notice that I was moving to Georgia. Although they were shocked, (not to mention,
worried) they were nothing but supportive, and they have remained so, through every transition I
have made from Tech, to GSU, to my next adventure at UGA. You have all been there, annoyingly
positive, even when I was sure I was doomed to fail. You were always there to tell me that I was
smart, capable and that I could do anything that I wanted to in life. Between all of you, you have
made and raised three successful scientists. I’m not sure how you’ve managed such a feat, but I’m
pretty sure that if you write a how-to book, it would sell like crazy.
Finally, to those friends who have become family: Jorge, Stephanie, and Rebecca. Thank
you for being my go-to people when I was stressed, anxious, happy, excited, doubtful—anything.
I enjoy venting my frustrations and receiving the most non-sensical, dumb, and, frankly, hilarious
advice, in return (though I know in my heart, that you would hop on a plane at the drop of a hat if
TABLE OF CONTENTS
ACKNOWLEDGEMENTS ... V
LIST OF FIGURES ... X
LIST OF ABBREVIATIONS ... XI
1 INTRODUCTION... 1
1.1 Background ... 1
1.1.1 Cancer and society ... 1
1.1.2 Unique molecular patterns of cancer cells... 2
1.1.3 Lipid droplets ... 3
1.1.4 Monoethanolamine and its anticancer effects ... 5
1.2 Overall Objectives ... 6
1.3 Hypothesis ... 6
2 AIM 1: MORPHOLOGICAL EVALUATION OF CHANGES IN LIPID CONTENT ... 8
2.1 Introduction ... 8
2.2 Aim 1 Objectives ... 11
2.3 Hypothesis ... 11
2.4 Materials and Methods ... 11
2.4.1 Cell culture ... 12
2.4.3 Oil Red-O imaging and analysis ... 12
2.5 Results ... 13
2.6 Discussion... 16
2.7 Conclusion ... 17
3 AIM 2: SIGNALING CHANGES IN PC3 CELLS ... 18
3.1 Introduction ... 18
3.2 Objectives... 23
3.3 Hypothesis ... 23
3.4 Materials and Methods ... 24
3.4.1 DIC Imaging ... 24
3.4.2 Live cell ratiometric intracellular Ca2+ imaging. ... 24
3.4.3 Live cell mitochondrial potential imaging ... 25
3.5 Results ... 25
3.6 Discussion... 28
3.7 Conclusion ... 30
4 AIM 3: IDENTIFICATION OF KEY PLAYERS IN LIPID METABOLISM-RELATED CELL DEATH ... 31
4.1 Introduction ... 31
4.2 Objectives... 36
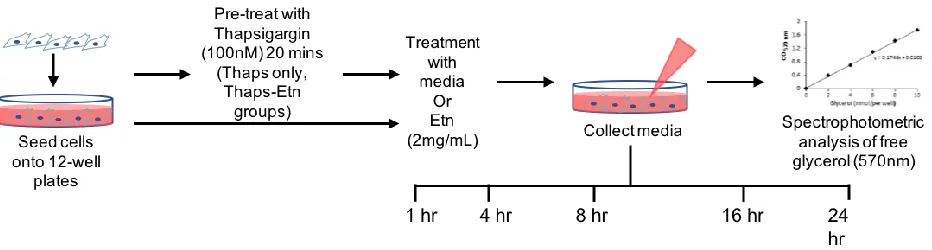
4.4 Materials and Methods ... 37
4.4.1 Lipolysis assay ... 37
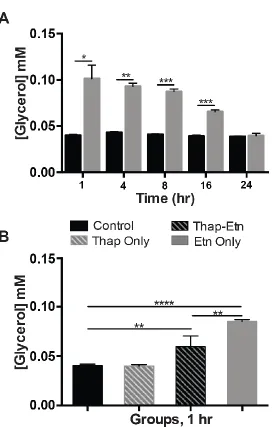
4.5 Results ... 39
4.6 Discussion... 41
4.7 Conclusion ... 43
5 AIM 4: MOLECULAR CHANGES IN PC3 CELLS ... 44
5.1 Introduction ... 44
5.2 Objectives... 48
5.3 Hypothesis ... 48
5.4 Materials and Methods ... 49
5.4.1 Fourier Transform-Infrared Spectroscopy (FT-IR) ... 49
5.5 Results ... 50
5.6 Discussion... 55
5.7 Conclusion ... 58
6 CONCLUSION AND FUTURE STUDIES ... 59
6.1 Summary and closing remarks ... 59
6.2 Further studies ... 62
REFERENCES ... 63
LIST OF FIGURES
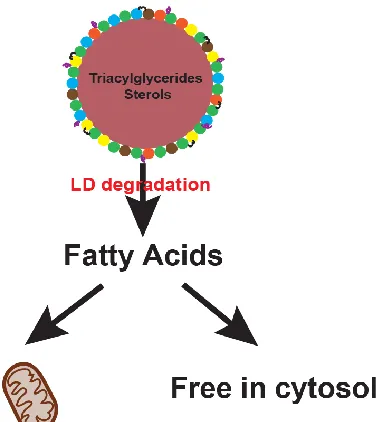
Figure 1.1.1 Schematic representation of lipid droplet structure and its fates ... 4
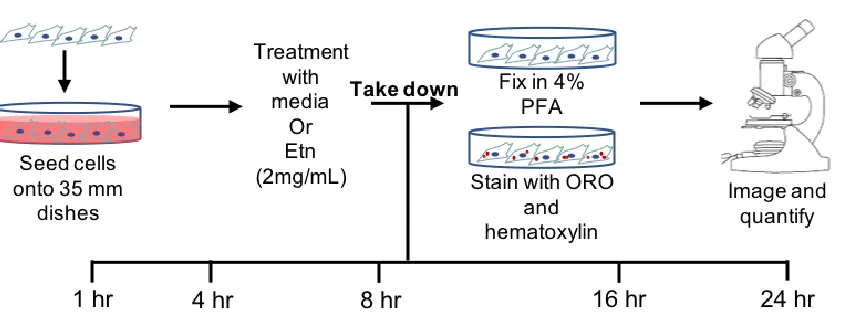
Figure 2.4.1 Schematic overview of methodology used in Aim 1... 11
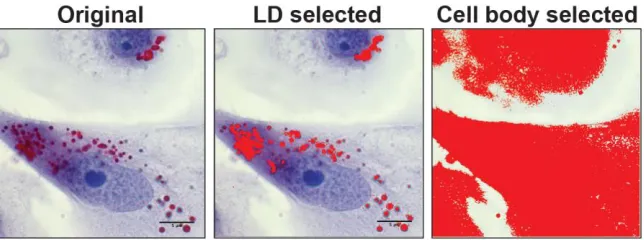
Figure 2.4.2 Selection of LDs and cell body for ImageJ analysis ... 13
Figure 2.5.1 Oil Red-O Quantification of stained PC3 cells at various timepoints. ... 15
Figure 3.4.1 Schematic representation of methodology used for Aim 2 ... 24
Figure 3.5.1 Calcium-dependent fluorescence in PC3 cells before and after Etn treatment. ... 27
Figure 3.5.2 Mitochondrial potential of PC3 cells before and after Etn treatment. ... 27
Figure 4.4.1 Schematic representation of methodology used in Aim 3. ... 37
Figure 4.4.1 Quantification of free glycerol in control (black) and treated (gray) cells as a measure of lipolysis. ... 39
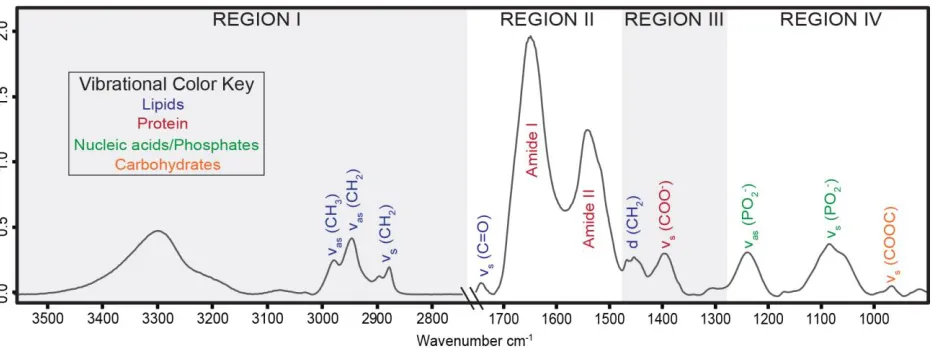
Figure 5.1.1 Commonly observed FT-IR spectral regions in biological samples ... 47
Figure 5.4.1 Schematic representation of methodology used for Aim 4 ... 49
Figure 5.5.1 High wavenumber region of FT-IR spectra ... 52
Figure 5.5.2 Mid wavenumber region FT-IR spectra ... 53
Figure 5.5.3 Low wavenumber region FT-IR spectra ... 54
LIST OF ABBREVIATIONS
FA Fatty Acid
LD lipid droplet
ATP Adenine Triphosphate
NADPH nicotinamide adenine dinucleotide phosphate
PC phosphatidyl choline
PI phosphatidyl inositol
PE phosphatidyl ethanolamine
ER endoplasmic reticulum
TGs triglycerides
HSL hormone-sensitive lipase
Acetyl CoA acetyl coenzyme A
PKA protein kinase A
PhosE phosphoethanolamine
PC3-luc prostatic carcinoma cell line 3 luciferase
ORO Oil Red-O
FOV field of view
NIH National Institutes of Health
FBS fetal bovine serum
Ca2+ calcium ion
[Ca2+] calcium ion concentration
[Ca2+]i intracellular calcium concentration
IP3 (1,4,5)-inositol triphosphate
GCRs G-protein-coupled receptors
RTK receptor tyrosine kinase
H mitochondrial hydrogen exchange
MCU mitochondrial calcium uniporter
[Ca2+]SS steady-state calcium concentration
Fura-2-am fura-2-acetoxymethyl
AM acetoxymethyl
TMRE tetramethylrhodamine ethyl ester
mitochondrial membrane potential
ROI region of interest
[Ca2+]e extracellular calcium concentration
TCA cycle tricarboxylic acid cycle
HMG-CoA 3-hydroxy-3-methylglutaryl-CoA
FASN fatty acid synthetase
FADH2 flavin adenine dinucleotide
ATL adipose triglyceride lipase
MAGL monoacylglycerol lipase
EDTA ethylenediaminetetraacetic acid
Thap Thapsigargin
cAMP cyclic adenylate monophosphate
UV-Vis Ultraviolet-Visible
FT-IR Fourier-Transform Infrared
ATR Attenuated Total Reflectance
COO- carboxyl
Asp Aspartate
Glu Glutamate
vas asymmetric vibration
vs symmetric vibration
scissoring vibrational mode
CO2 carbon dioxide
CH3 methyl
CH2 methylene
C=O carbonyl
1 INTRODUCTION
1.1 Background
1.1.1 Cancer and society
Cancer is the second leading cause of death in the United States and is one of the most
prevalent diseases in the developed world[1], [2],[3]. It is the name given to a group of diseases in
which the body’s cells begin to divide without any checks or balances to stop their proliferation
and spread into surrounding tissues[1]. It can arise almost anywhere in the body and be composed
of any type of cell. Because of their accelerated growth rate, it can quickly outnumber and force
out the “normal” cells within the tissue, forming a tumor.
Under normal conditions, cells undergo a natural death process. When the cell has found
itself inviable due to abnormalities in shape, function or DNA damage, released signals force the
defective unit to proceed into a programmed cell death[4]. These programmed cell deaths can
include apoptosis or autophagy[5]. Necrosis, a third type of cell death, only arises as a result of
infection or injury[4]. Cancerous cells, however, find alternative pathways to circumvent
programmed cell death, allowing them to continue replicating, unhindered[6]. This leaves
researchers searching for ways in which to induce appropriate death progressions to halt tumor
growth and cancerous invasion.
Effective treatment for these diseases can vary greatly throughout tissue type and cell
subtype due to the vast array of surface markers and alternate pathways for cancer cell survival[6].
Additionally, current cancer treatments aim to inhibit cell proliferation, incurring in negative
side-effects, such as the death and slow cell growth of healthy, normal cells[6]. This type of treatment
leads to the debilitated, sick state often associated with cancer patients undergoing aggressive
approaches, aimed at attacking molecules within the cancer cells that might trigger pathways of
natural cell death.
1.1.2 Unique molecular patterns of cancer cells
As mentioned earlier, cancer cells employ the use of several alternative living pathways in
order to ensure their survival. These alterations become the biochemical foundation of the cell’s
tumor-building capacity, aggressiveness and potential for metastasis [8]. Some of the alternative
metabolisms favored by cancer cells are aerobic glycolysis, glutamine dependent anaplerosis,
which allow cells to migrate from the primary tumor and become viable metastases, and denovo
lipid generation[8].
Lipid metabolism has been well characterized within cancer cells[9], [10]. The major
component of cell membranes are phospholipids, along with other integral lipids, such as sterols
and sphingolipids. Due to the constantly replicating nature of cancer cells, they require a steady
supply of both structural and energy-providing lipids[10]. This need is what has prompted cancer
cells to develop the ability to undergo de novo lipogenesis, an ability possessed by only liver,
adipose, and lactating breast tissue once the organism enters adulthood[11]. The cells activate lipid
anabolic metabolism and attached signaling for subsequent generation of new membranes, storage
of energy and as a primary energy source (via fatty acid oxidation) during energy-deficient
periods[8].
The cycling of fatty acids (FA) for structural and energetic purposes lies at the center of
the lipid metabolism network[10]. These FA can generate metabolic intermediates used in anabolic
processes for membrane building blocks or as signaling molecules to activate oncogenic
cascades[8] [10]. The balance of FA synthesis and FA oxidation is imperative for the survival of
inactive until needed by the cell. Following the degradation of these LDs, the components created
during FA oxidation can aid in the synthesis of membranes, ATP and NADPH required for other
processes, and can be used as building blocks for another round of FA synthesis[12] [13] [14] [15].
Because of its important role in cancer cell survival the targeting of lipid metabolism by anticancer
medication could very well be the next target for chemotherapies.
1.1.3 Lipid droplets
The demand for FA storage vessels in cancer cells defines a major morphological
trademark in cell pathology. In order to have these base materials handy, the cells have employed
the use of a special compartment called lipid droplets (LDs), a naturally-occurring organelles that
can be found among most eukaryotic cell types[15]. They consist of a phospholipid monolayer
studded with integral proteins such as perilipins, that surround a core of triglycerides and sterols.
The perilipins allow for the droplets to be enzymatically degraded, so that its contents can be
quickly processed for whatever purposes they are needed[15].
It is known that, with the exception of adipocytes, cancer cells possess a higher abundance
of these reservoirs, generally of significantly greater size, than normal cell types[10] [16]. While
adipocytes use these LDs as more or less static storage units, cancer cells have developed a
dynamic life cycle for these vesicles[14]. Due to these differences in metabolic fates, LDs in adipose
cells are large and few in number, taking up most of the volume of the cell, while the same
organelles in cancer cells are both smaller and more abundant[12][14]. Their smaller size increases
Figure 1.1.1 Schematic representation of lipid droplet structure and its fates
Although there is no definitive mechanism for the creation of LDs, the most compelling
model states that LDs are created in the endoplasmic reticulum (ER), through a mechanism named
membrane budding [12] [13] [14] [15]. Neutral fatty acids, such as triglycerides and sterols are
synthesized in the ER where the components form a film against the membrane[12] [14]. The
phospholipid membrane forms a leaflet that then invaginates the neutral lipids of the core before
dissociating from the rest of the ER[12]. This results in the creation of a monolayered vacuole with
extricated from both leaflets of the ER, giving rise to a bicelle[12]. Some scientists favor this theory
due to the abundance of surface proteins that seemingly are related to several ER processes[14].
Regardless of how the LDs arise, their presence allows cancer cells to have all the materials
they need for rapid proliferation readily available, cutting down on division time and expended
energy[15]. In order to unpack the components within LDs, intracellular lipases must hydrolyze the
core lipids. These lipids can then be oxidized by the mitochondria to create ATP[14] [15].
Alternatively, they can be shipped elsewhere in the cell for other purposes. In the case of
triglycerides (TGs), their release is governed by hormones and activation of protein kinase A
(PKA)[15]. PKA phosphorylates the proteins perilipin and hormone-sensitive lipase (HSL), present
on the LD surface[12][15][14]. This activates a catabolic cascade that ends in the hydrolysis of TGs
into fatty acids and glycerol that must be released from the cytosol to avoid cell toxicity[14][12, 17].
Considering the range of functions which LDs serve in cancer cells, it would help to
consider these reservoirs as ideal targets for anticancer treatments. By focusing action on
metabolically active LDs, normal cells with little to no lipid droplets, and those with LDs with
more static metabolisms would be largely unscathed[18].
1.1.4 Monoethanolamine and its anticancer effects
In cells, the balance of FAs, phospholipids and other lipids is kept through the
interconnection of lipid biosynthesis and the Kennedy pathways[18]. Within these pathways,
materials broken down into acetyl-CoA from glycolysis or oxidation are reduced to FAs. These
molecules are then either converted to FA-CoA and transported to the mitochondria for oxidation
or made into phospholipids and exported to the membrane. Disruption of this balance, either by
blocking signaling cascades or the sequestration and introduction of materials, would have major
Previously, our lab has characterized the anticancer effect of monoethanolamine (Etn) on
different cancer cell lines. Etn is a small, polar molecule, that serves as a precursor within the
Kennedy phospholipid biosynthesis pathway[19]. Once this molecule is phosphorylated to form
phosphoethanolamine (PhosE), it can continue down the pathway to create
phosphatidylethanolamine (PE), the second most abundant phospholipid present in cells[20][19][21].
Due to its ties to these pathways, it is possible that the drug’s efficacy in vitro is due to a
dysregulation within the lipid metabolism[22]. Therefore, the purpose of this study was to evaluate
the effect of Etn treatment on a prostate cancer cell line (PC3-luc) signaling mechanisms and its
plausible effects on lipid metabolism.
1.2 Overall Objectives
The purpose of this thesis work is to identify the physical and molecular changes relating
to the accumulation, storage and metabolism of lipids within prostate cancer cells as a direct result
of Etn treatment. To achieve this objective, work will be split up into four aims:
• Aim 1: Histological evaluation of changes in lipid content
• Aim 2: Signaling changes in PC3 cells
• Aim 3: Identification of key players in lipid metabolism-related cell death
• Aim 4: Molecular changes in PC3 cells
1.3 Hypothesis
The effectiveness of Etn as an anticancer substance has been proven in previous work. This
drug triggers apoptotic death through the activation of pathways and causes shifts in the abundance
we believe that a portion of Etn’s killing potential lies in its ability to disrupt lipid metabolism in
2 AIM 1: MORPHOLOGICAL EVALUATION OF CHANGES IN LIPID CONTENT
2.1 Introduction
Morphological evaluation of cells has, historically, been a tool used to determine cell structure and
function. Because structure and function are closely related, the study of tissues under the
microscope, whether stained or unstained, has been a historically used practice to describe and
compare cell types or differences between cells[23]. Before the development of biochemical
techniques, histology was used to determine the malignancy of abnormal-looking tissues. The idea
behind this evaluation is that, because normal structure of tissue had been characterized, any
anomaly can be readily identified and attributed to disease. Today, with the use of affinity-based
stains, markers, and biochemical assays, we can extract more information from cell and tissue
samples than ever before. However, the observation of general morphology of the cells in question
still serves as a primary technique to test for differences between two samples.
Individual cancer lines have been developed and immortalized from tumor sources and
evaluated both geno- and phenotypically[24]. As such, every cancer type has a certain morphology
it follows depending on what tissue it originates from, its capabilities for metastasis, its dependence
on adhesion for survival, and whether or not it lives in clusters or single cell populations. The
importance of this information is not only to help identify cancerous cells apart from “normal”
tissue, but to assess whether or not an intended treatment is having any effect on the essential
processes of the cell, changing its characteristics to make it unsuitable for further replication, and
eventually dying. This type of characterization has been done for the model cell used in this paper,
a prostate cancer cell line derived from a bone metastasis, PC3.
The prostatic carcinoma cell line (PC3) was established in 1979 by Kaighn, et al. They
bone to form metastases that they thought would be “useful in investigating the biochemical
changes in advanced prostatic cancer cells and in assessing their response to chemotherapeutic
agents.[25]” This cell line, while anchorage independent, was well suited for growing in
monolayers, agar, 3D soft matrices and suspension. PC3 cells flourish above normal prostate cells
in their reduced need for serum and their independence of androgen-specific hormones and growth
factors[25]. They are generally spindle-shaped and will anchor flat to the tissue culture surface when
grown in monolayer and tend to form close-clustering colonies. These cells also bear physical
resemblance to other neoplastic cells with features such as abnormal nuclei, abnormal
mitochondria, annulate lamellae and lipoidal bodies[25].
This last feature, the presence of lipoidal bodies, more commonly known as lipid droplets
(LDs), has been the basis for research in several fields, including obesity, diabetes, neuroscience,
and cancer[12] [15]. They are cytoplasmic organelles that consist of a phospholipid monolayer
studded with integral proteins such as perilipins, that surround a core of triglycerides and sterols[15]
[14]. It has been shown that these fatty acids extracted through LD hydrolysis has been shown to be
incorporated more efficiently into critical pathways compared to those taken up by the cell from
the extracellular environment[15]. LDs allow cancer cells to have all the materials they need for
rapid proliferation readily available, cutting down on division time, expended energy and making
energy sources available for the cell’s use. The importance of this structure in the survival of cancer
cells make it an ideal target for therapeutics.
In monolayer tissue culture, LDs can be visualized through the use of staining techniques
and high magnification imaging. Oil Red-O (ORO) is a diazol dye that stains neutral lipid and
cholesteryl esters in bright red but does not stain biological membranes. This diazol dye has little
for lipids, especially those found within LDs[26]. This effectively incorporates the dye into the cell
and tags all of the reservoirs. The addition of a counterstain, such as hematoxylin for nuclear and
cytoplasmic differentiation allows to distinguish LDs within the cell, as opposed to LDs released
by lysed cells that have not been removed from the slide with the washing steps.
Following fixing and staining of the monolayer cultures, cells can be visualized on a
brightfield microscope with a high magnification, such as 100 x. Because the dye can be visualized
within the visible light spectrum, there is no need for lasers or specialized lamps in order to
quantitate the results. Additionally, through the image acquisition of several fields of view (FOV)
per sample, the relative density of LDs per FOV can be calculated. This is achieved through the
use of the National Institute of Health’s (NIH) software, ImageJ[27]. Essentially, the amount of red
within an image, or “positive ORO staining area” is measured relative to the amount of blue
counterstain, or “total area occupied by a cell”, under a set of permanent parameters[28]. This
staining and image quantification technique is a low-cost, robust, quantitative manner to identify
average amount of lipid staining in cancer cells whether they be grown under normal conditions
or with the addition of a therapeutic.
Treatment of prostate cancer cells with exogenous Etn has been shown to induce apoptosis
in prostate cancer cells[19]. Within the cell Etn is one of many molecules involved in the
phospholipid biosynthesis pathway. Its metabolism yields the creation of lipids, fatty acids,
phospholipids, and sterols that are the building blocks of new cells[11]. There is no definitive answer
as to how Etn affects the cell in order to induce apoptosis. Therefore, it was of interest to see
whether Etn treatment affected lipid reservoirs in the cells. The combination of ORO staining and
image analysis with ImageJ would allow for the visualization of any possible changes within the
2.2 Aim 1 Objectives
• Validate cancer cell model by identifying LDs in cancer cell line PC3-luc
• Visualize morphological changes between treated and untreated cells (shape, size, LD
number, etc)
• Use software to digitally quantify relative amount of lipids in each sample
2.3 Hypothesis
Due to its anticancer properties, the use of exogenous Etn should have a visible physical
impact on the morphology of the PC3 cell line. Previous studies in the Aneja lab have shown that
treatment with Etn causes the reduction of certain phospholipids within the cell, including
phosphatidyl choline, sphingomyelin, phosphatidyl serine and phosphatidyl ethanolamine. All
these are present within the monolayer of the LDs[19]. Therefore, Etn’s use on cancer cells should
affect LDs by either distorting their surface to volume ratio or the disruption of their protective
phospholipid monolayer.
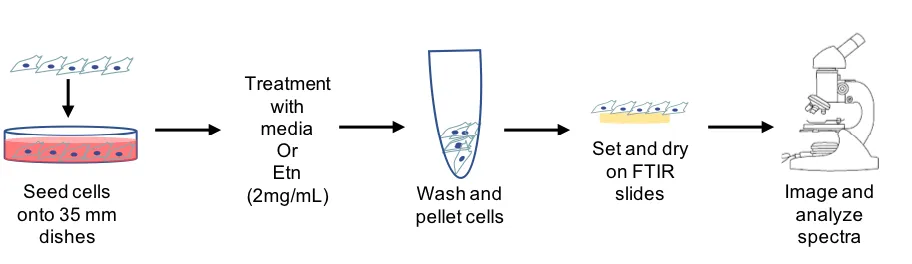
[image:26.612.93.526.529.690.2]2.4 Materials and Methods
2.4.1 Cell culture
PC-3-luc cells (Perkin Elmer) were cultured in complete media containing 10% fetal
bovine serum (FBS, GE Health) and 1% penicillin-streptomycin (Pen-Strep, Corning), under
normal culturing conditions (37 °C, 5% CO2).
2.4.2 Oil Red-O staining
Oil Red-O staining (Sigma, cat #O-0625) was done on control and 2mg/mL Etn-treated
PC-3-luc cells cultured in 35 mm Petri dishes. Plates were then incubated under normal conditions,
and taken down in matched pairs at 1, 4, 8, 16, and 24 hrs. At each timepoint, cells were fixed in
place with 4% paraformaldehyde for fifteen minutes and washed with phosphate buffered saline
(PBS). Samples were washed with 60% isopropyl alcohol and stained with Oil Red-O dye (5 mM,
5 mins) before washing under tap water until solution ran clear. Dishes were counterstained with
Harris’ hematoxylin solution (Sigma, cat # HHS16, 1 min) and washed as before. Coverslips were
mounted with glycerol and dishes were kept in the refrigerator until imaging.
2.4.3 Oil Red-O imaging and analysis
Fixed, stained dishes were imaged on a Zeiss Axio A-100 microscope with a 100x
magnification, oil-immersion objective. 10-15 images (Axio 2 Imager 2 LED camera) were taken
per timepoint, per group for densitometry analysis. Images were color thresholded on ImageJ
software, to select all red pigmentation, and measured relative to the amount of space occupied by
Figure 2.4.2 Selection of LDs and cell body for ImageJ analysis
Percent of staining was calculated as follows:
%Oil Red-O staining= 𝑃𝑜𝑠𝑖𝑡𝑖𝑣𝑒 𝑂𝑅𝑂 𝑠𝑡𝑎𝑖𝑛𝑖𝑛𝑔 𝑎𝑟𝑒𝑎
𝑇𝑜𝑡𝑎𝑙 𝑜𝑐𝑐𝑢𝑝𝑖𝑒𝑑 𝑎𝑟𝑒𝑎 X 100
Measurements of each group, per timepoint were compared via ANOVA with Tukey’s.
P-values were determined with unpaired t-tests.
2.5 Results
PC3 cells have been characterized and in use for the purpose of drug research since their
development in 1979. As their other cancerous relatives, they contain LDs that allow them to thrive
in their environment by providing energy and structural components for rapid proliferation. These
LDs could be targeted as part of an anticancer therapeutic. Given Etn’s proven effectiveness
against several cancer cell lines, including PC3, the purpose of this study was to observe its effect,
if any, on the LD population within the cell and quantify that effect using digital analysis
techniques.
In cell samples treated with Etn, there were a few notable morphological changes when
compared to the control. These cells are epithelial-like in shape, and so, they extend out their
points (1, 4 and 8 hrs) there appears to be cell rounding in the treated group (Figure 2.5.1 F-H)
when compared to the control group at the same time points (Figure 2.5.1 A-C). This cell rounding
comes accompanied with the loss of definition of the borders of the cell’s cytoplasm, suggesting a
weakening, loss of elasticity or adverse effects to cell adhesion properties of the cytoplasmic
membrane in the presence of Etn. Additionally, vacuole-like structures are present in the cytoplasm
of treated cells that are not present in the control group (black arrow heads). In general, there is a
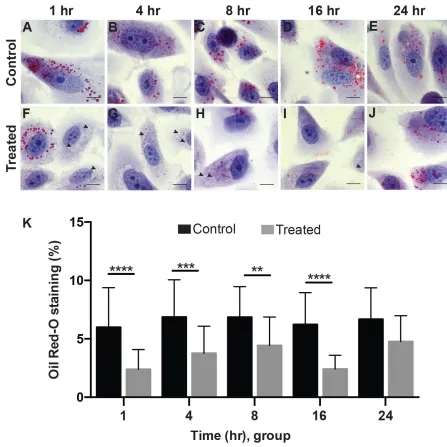
visible reduction of LD content in treated cells as compared to their respective controls.
Densitometry analysis of ORO staining required the relative amounts of red in the image,
known as “positive ORO staining area” be ratiometrically compared to the total area of the FOV
that was occupied, or “total occupied area”, as previously described in the methods. ORO staining
comparison between control and treated groups resulted in the significant decrease of positive red
staining in treated groups (Figure 2.5.1 K) for the first four time points. This reduction correlates
Figure 2.5.1 Oil Red-O Quantification of stained PC3 cells at various timepoints.
2.6 Discussion
LDs are a cell organelle found in most eukaryotic cells and are part of the cell’s dynamic
lipid metabolism. In cancer cell lines, these LDs provide the energy and materials necessary for
the cell to quickly divide and flourish in low-nutrient environment. The framework of this
experiment sought to uncover whether the Etn’s mode of action involved, in part, the disruption
of the cell’s lipid metabolism. Through the use of basic lab techniques such as cell culture, cell
staining and microscopy, it was possible to visually compare the amount of positive lipid staining
in PC3 cells under either normal growth medium conditions or Etn treatment.
Gross visual analysis of the cell’s morphology revealed a change in cell shape of Etn treated
groups at early time points in the form of filopodia retraction and cytoplasmic disruption. This
caused the cells at earlier time points to appear rounded and vacuole-like structures in the
cytoplasm in Etn-treated samples, characteristics not present in the control group. Additionally,
the confines of the cell, as established by the cell membrane, did not exhibit the opaque or feathered
edges seen in the treated group. Poorly defined borders might be a sign of cell membrane weakness
brought on by treatment. Moreover, the number of LDs visible within the cell cytoplasm seemed
to be reduced in the experimental group. This reduction might help explain the loss of cell
membrane definition, as there are less sterols and lipids on hand to create the membrane, the cells
make do with whatever materials present. Cell shape and LD number seemed to normalize by 24
hrs.
Images acquired for each of the samples were further analyzed through the software ImageJ.
About 10-15 images per group, per time point were evaluated under the same hue, saturation and
brightness thresholds in order to subjectively analyze LD density within cells. Quantitative
time points (1, 4, 8 and 16 hrs.), there was significant decrease in LD density in the cytoplasm of
Etn-treated cells than their control group counterparts. Much like the cell shape recovery, LD
density also normalized within 24 hours of treatment. This can be due to the combination of the
degradation of Etn in the media along with the fact that these cells undergo a division
approximately every 23 hrs. Any Etn-resistant cells, which would have been unaffected by
treatment, would have divided into a new generation on the plate, reestablishing the LD levels in
the cytoplasm per FOV.
2.7 Conclusion
Etn is a small molecule with proven anticancer properties. While its mechanism of action
is not entirely known, previous publications have linked its therapeutic use in cancer cells in the
activation of several pathways that lead to cell death. The purpose of this study was to determine
whether Etn activates pathways that disrupt the lipid metabolism by affecting change to the cell’s
lipid reservoirs. Through staining, microscopy and digital analysis of acquired images, it was
determined that Etn does, indeed, affect LD content in cell cytoplasm when compared to control
population, at several time points. Although cell population recovers LD content at 24 hrs, Etn’s
targeted impact on the LD population at early stages of treatment make it a strong candidate as a
non-toxic, daily, oral anti-cancer regimen in order to maximize its effects. Additionally, Etn
treatment brings about a change in general cell morphology. In conclusion, Etn causes a disruption
in lipid metabolism that can be appreciated through low-cost computational methods. With these
results in mind, the next step was to identify what signaling pathways related to apoptotic death
3 AIM 2: SIGNALING CHANGES IN PC3 CELLS
3.1 Introduction
Calcium, in its ionic form Ca2+, is the most common signal transduction molecule in cells of all
types[29][30]. Ca2+ is essential for cell growth and survival, and due to the extent of its effects upon
the cellular network, it is difficult to assign its effects to one universal mechanism. Intranuclear
Ca2+ increases initiate gene expression and cell cycle progression, but also can activate degradative
processes in programmed cell death[31]. This is due to the fact that prolonged high calcium
concentration ([Ca2+]) activates nucleases that cleave DNA and degrade cell chromatin[31].
Therefore, the concentrations of Ca2+ inside and outside the cell have to be tightly regulated, lest
they trigger the cell’s own demise.
Though required for normal cell functions, calcium cannot be metabolized in the same way
other second-messengers are recycled[29]. Under normal physiological conditions, the
concentration of intracellular calcium ([Ca2+]
i) is approximately 100nM, which is about
20,000-fold lower than the average [Ca2+] in the extracellular environment[29]. Increased [Ca2+] within the
cell can cause toxicity and will eventually lead to cell death, which means that the cell has to
develop mechanisms to chelate and store Ca2+ in an inert state to maintain stable [Ca2+]i[29]. For
this purpose, the cell employs two types of Ca2+ buffers, both mobile and immobile, that will trap
and bind the ions in a secure formation until needed.
From a molecular standpoint, Ca2+ ions are able to coordinate a large amount of oxygen
atoms in their primary array spheres (4-12 atoms)[29] [32], though common coordination spheres
arrange 6-8 oxygen atoms per calcium ion[32]. Specific calcium-binding proteins use this
coordination to tightly sequester the ion through glutamate and aspartate residues that are charged
capacity as intracellular calcium concentration increases[30]. The action of these buffers affect the
rate of diffusion of calcium ions throughout the cell, making it one of the slowest diffusing ions[32].
These proteins can be suspended in solution, acting as a mobile buffer, and in smaller cells, they
are sufficient to control [Ca2+][29].
In eukaryotic mammalian cells, however, increased cell size means that the use of mobile
buffers alone is not sufficient to regulate the concentration of Ca2+ within the cytoplasm[29]. In this
case, the use of immobile buffers, in the form organelles with the capability to trap and store the
ions within their confines, are employed[31]. The biggest intracellular Ca2+ store is the endoplasmic
reticulum (ER). The ER is a large three-dimensional network of membranes that is employed in
packing away materials into vacuoles. The ER acts as an anchor to Ca2+-binding proteins, and
actively sequesters Ca2+ into the intraorganellar space[30]. Specialized ATP-dependent pumps,
known as the smooth ER calcium (SERCA) pumps move Ca2+ from the cytoplasm into the ER
where proteins, such as calsequestrin, bind the calcium in a dynamic storage, to be released only
under certain signals have been received to deliver Ca2+ to the cytosol[29].
There are different mechanisms to slightly increase [Ca2+] in the cytosol. Ions from the
extracellular environment and the ER are transported into the cytosol across the plasma membrane
or from the ER through ion channels, respectively[29]. In non-excitable cells, such as cancer cells,
the inositol (1,4,5)-triphosphate (IP3) pathway predominates in calcium signaling[33][34]. Both G
protein-coupled receptors (GCRs) and receptor tyrosine kinases (RTKs) release IP3[29][33]. GCRs
activate phospholipase C, while RTKs stimulate phospholipase C to convert
phosphatidylinositol (4,5)-bisphosphate into IP3 and diacylglycerol[29] [31] [33] [34]. IP3 acts as an
intracellular second messenger that triggers the release of Ca2+ from the ER by binding to its
Ca2+ to enter cells by crossing the plasma membrane, the membrane must be depolarized[35]. Open
potassium channels force the membrane potential to more negative potentials, drawing Ca2+ more
rapidly across the plasma membrane[29] [36]. Ca2+ then enters through voltage-independent Ca2+
-specific ion channels[29].
The ER is not the only organelle that acts as an immobile buffer for Ca2+. Mitochondria
accumulate Ca2+ at up to 0.5mM levels in the mitochondrial matrix owing to a large
electrochemical gradient by mitochondrial hydrogen exchange (H)[31] [37]. Avoiding
mitochondrial Ca2+ overload is energetically demanding for the cell, which has evolved a number
of transport mechanisms to control energy expenditure[31]. Ca2+ concentrations in the
mitochondrial matrix are controlled by a balance of influx and efflux pathways. Mitochondrial
Ca2+ uniporters (MCU) control the influx of the ion. They have lower affinities for Ca2+ than
SERCA pumps and are only significant when cytosolic Ca2+ rises above ~0.5M, activated by
external Ca2+ and the allosteric effect of adenine nucleotides[31][38]. Efflux is controlled by Na+-H+
or Ca2+-Na+ exchangers. Some studies suggest that the mitochondria’s sensitivity to the release of
Ca2+ from the ER means that there are close contacts between both organelles that are involved in
molecular crosstalk[31].
Reactions within the mitochondrial matrix lead to the synthesis of several molecules,
including nucleotide precursors and fatty acids that give rise to phospholipids[31]. In tandem, the
mitochondria play a role in the homeostasis of Ca2+ within the cell, giving rise to effectors that can
link calcium fluctuation to changes in energy metabolism[39]. Substantial evidence has built up in
recent years indicating that metabolic regulation is only one of the roles of the mitochondrial Ca2+
signal[31]. In particular, the role of mitochondrial Ca2+ reserves in the intrinsic cellular signaling
In order to induce apoptosis, early cell death events must induce the release of cytochrome
c from the mitochondria and Ca2+ from the ER into the cytosol[29][31][40]. The release of cytochrome
c from a small subset of mitochondria will activate the IP3 pathway, therefore releasing Ca2+ from
the ER into the cytoplasm[30]. This will create a feedback loop that will drive the release of
cytochrome c from the majority of the cell’s mitochondria, forming the apoptosome and leading
to caspase activation, eventually triggering cell death[29] [31] [40]. The mitochondrial pathway of
apoptosis is regulated by members of the Bcl-2 protein family, including: Bcl-2, and Bax and Bak,
acting as anti- and pro-apoptotic proteins, respectively[31]. In cells that circumvent programmed
cell death, like cancer cells, Bcl-2 has been shown to act in Ca2+-storing organelle membranes,
such as ER and mitochondria to reduce the steady-state [Ca2+] ([Ca2+]SS) in the ER to diminish the
effect of the apoptotic signal[31][36].
In order to avoid accidentally triggering cell death, [Ca2+]SS must be maintained through a
delicate balance of calcium influx to the cytosol and efflux to the extracellular space or ER[29].
Certain conditions involve cells foregoing the process of programmed cell death once the unit
reaches senescence, prompting scientists to find tools to trigger apoptosis and get rid of the
abnormal cell[31]. Among these tools live-cell imaging has become a widely recognized resource
to track fluctuations in Ca2+ release and changes in mitochondrial polarization. The use of
fluorescent tags, sensitive to these two factors are able to give qualitative and quantitative
comparisons of control and treated cells to determine treatment effectiveness.
Fura-2-acetoxymethyl ester (Fura-2AM) is a membrane-permeant ratiometric dye that
measures [Ca2+] by fluorescence[41]. Once the dye is incorporated into the cell cytosol, cytosolic
and organelle esterases convert the acetoxymethyl ester (AM) forms into Ca2+-sensitive carboxylic
at these wavelengths results in differences in emission intensities, the ratio of which is used to
determine the [Ca2+]i[41]. The use of a fluorescent ratio allows for the normalization of variables of
cell thickness or dye concentration that may lead to false results, making it a robust measurement
for intracellular Ca2+.
Tetramethylrhodamine ethyl ester (TMRE) is a rhodamine-derived fluorescent dye known
as a “redistribution dye”[42] [37]. This dye is able to cross the plasma membrane into the cytosol
where its lipophilic character, charge and solubility allows it to accumulate within the inner
mitochondrial membrane space[42]. The distribution of the free dye across the inner membrane of
the mitochondria follows the Nernst equation, where its uptake is dependent upon electrical
potential across the membrane ()[42] [37]. The flux of Ca2+ across the mitochondrial membrane
can cause changes in due to the ion’s poor electronegative exchange potential compared to
traditionally used H+[29]. TMRE can be used as a qualitative assessment of tandem signaling
pathways affection both normal Ca2+ signaling and mitochondrial function as a response to an
external stimulus.
The use of exogenous Etn has been shown to cause cell death in different cancer cell lines,
including PC3. Etn-treated cells expressed higher levels of pro-apoptotic markers and a decrease
of anti-apoptotic markers that are classically Ca2+-sensitive[19]. Therefore, it was of interest to
evaluate if Etn’s effectiveness was in any way related to the activation of Ca2+ apoptosis pathways
in the ER and mitochondria. In order to test this, the use of live cell imaging using Ca2+- and
-sensitive dyes (Fura-2AM and TMRE, respectively) was employed with healthy PC3 cells to track
Ca2+ and fluctuations before and after Etn treatment. In the case of fura-2AM imaging, the
measurements were taken in both Ca2+-rich and -depleted conditions. Measurements were taken
environment in which the cells are contained lacks Ca2+ sources, it would stand to reason that Ca2+
entering the cytosol comes from intracellular stores, such as the ER or mitochondria.
3.2 Objectives
• Track changes in Ca2+ signaling of healthy cells following Etn
• Ca2+ influx versus Ca2+ release from internal stores
• Determine the effect of Etn on mitochondrial membrane potential
3.3 Hypothesis
Ca2+ is the most common signal transducer in the cell, impacting the function and integrity
of all organelles, including the ER, nucleus and mitochondria. Previous studies in the Aneja lab
have reported the positive effect of Etn in the increase and decrease of pro-apoptotic and
anti-apoptotic markers, respectively. Among the affected markers Bax and Bcl-2, Ca2+-sensitive
mitochondrial proteins, were present. Therefore, we hypothesized that Etn induces cell death
3.4 Materials and Methods
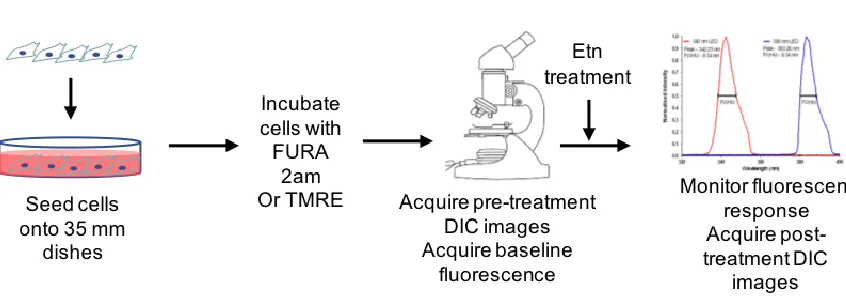
Figure 3.4.1 Schematic representation of methodology used for Aim 2
3.4.1 DIC Imaging
AnOlympus microscope equipped with the water-immersive objective (40X), DIC filters,
and acquisition and offline analysis software (Till Photonics, FEI, Germany) were used for
acquiring DIC time-lapse images of PC3 cells and their lipid droplets.
3.4.2 Live cell ratiometric intracellular Ca2+ imaging.
AnOlympus microscope equipped with the water-immersive objective (40X), ratiometric
dichroic mirror with 340/380 split, 400 nm long-pass emission filter and acquisition and offline
analysis software (Till Photonics, FEI, Germany) were used for acquiring ratiometric time-lapse
images of fura 2 fluorescence in the cytoplasm of PC3 cells.
Cells were loaded with 5 M fura-2 AM (Molecular Probes, Eugene, OR, USA) for 30 min
at 37C, washed 3 times with the extracellular solution (see pharmacological agents) and incubated
for another 20 min at 37C. Acquisition and analysis of calcium images were conducted using Live
Acquisition and Offline Analysis software (Till Photonics, FEI, Germany). Time-lapse images
nm long-path emission filter. The ratio of emission fluorescence intensities at 340nm excitation to
380nm excitation was used to assess changes in intracellular calcium concentration. PC3 cells were
excluded from analysis if their pretreatment ratios of [Ca2+]i, exceeded 0.7, which indicated a
calcium concentration above normal resting cytosolic values of calcium, as established in earlier
experiments [43].
3.4.3 Live cell mitochondrial potential imaging
Cells were incubated with tetramethylrhodamine, ethyl ester (TMRE) (Molecular Probes,
Eugene, OR, USA), the mitochondrial potential dye for 30 mins at 37C, and subsequently washed
three times. Cells were observed on an Olympus fluorescent microscope, equipped for live imaging
using a 40x magnification, water immersion objective and Live Acquisition software. Images were
acquired using 535 nm excitation and a long path 590 nm emission filter. Time-lapse images were
acquired every 30 seconds. The intensity of fluorescence was measure in the region of interest
(ROI) that included one or a few mitochondria. Baseline measurements for mitochondrial potential
were taken as a control before adding Etn to a final concentration of 2mg/mL. Mitochondrial
polarization was then tracked for an additional 20 mins.
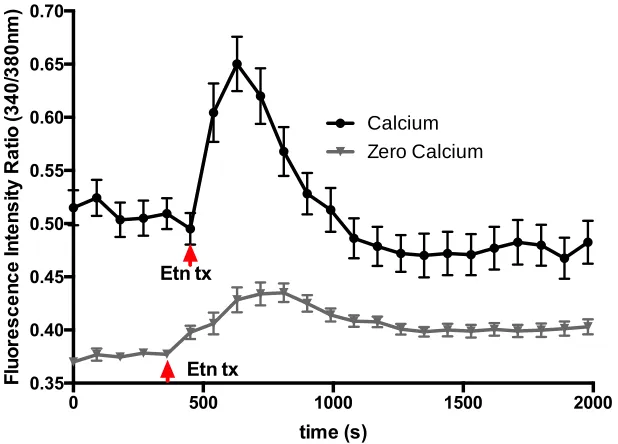
3.5 Results
Live cells imaging provides information in real-time of cellular responses to external
stimuli, such as drug treatments. In this study, the fluctuations in [Ca2+]i and were evaluated
using fura-2am and TMRE fluorescent dyes, respectively. Ca2+ was measured in conditions in
which external Ca2+ was and was not readily available (Figure 3.5.1). While using fura-2AM dye,
was 0.50 and 0.37 in Ca2+-containing (black line) and non Ca2+-containing media (grey line),
respectively. Following baseline reading and normalization, Etn was added dropwise into the
observation dish to a concentration of 2mg/mL (red arrow). A solvent control was used to discard
the possibility of fluctuations due to addition solution to the observation dish. Increase in
fluorescent ratio was observable within the first 30s (first measurement following treatment),
reaching its peak at around 2 mins in Ca2+-containing media and 3 mins in non-Ca2+-containing
media. Once at its peak, fluorescent ratio normalized to near-baseline levels, indicating that Ca2+
increase was a transient event. Fluorescence was monitored for 30 minutes following Etn addition
to capture any long-term effects. An extracellular solution-only control did not yield a response
(Appendix A).
In the case of fluctuation using TMRE dye, a fluorescence baseline of healthy cells
within the ROI was similarly acquired (Figure 3.5.2). Etn was added dropwise into the observation
dish (red arrow) to a concentration of 2mg/mL. Within 2 mins of treatment there was a 15%
increase in fluorescent intensity that is immediately followed by a sustained decrease of signal.
This increase and subsequent decrease correspond to a moment of hyper- and depolarization of the
mitochondria, respectively. Fluorescence was monitored for approximately 30 minutes following
treatment to capture any long-term effects. An extracellular solution-only control did not yield a
Figure 3.5.1 Calcium-dependent fluorescence in PC3 cells before and after Etn treatment. Black line denotes experiment done in solution containing 2 mM Ca2+ present. Gray line denotes experiment done in solution with no added Ca2+ and EDTA present as a Ca2+ chelator. In both cases, transient increases in calcium signaling followed the addition of Etn. Results shown as mean SEM Graphs are average of n=5 ROI, N=3.
Figure 3.5.2 Mitochondrial potential of PC3 cells before and after Etn treatment. Moment of hyperpolarization, followed by sustained depolarization resulted from the addition of Etn to observation plate. Results shown as mean SEM. Graphs are average of n=5 ROI, N=3.
0 500 1000 1500 2000
0.35 0.40 0.45 0.50 0.55 0.60 0.65 0.70 time (s) F lu o re s c e n c e In te n s ity R a tio (3 4 0 /3 8 0 n m ) Calcium Etn tx Zero Calcium Etn tx
0 500 1000 1500 2000 2500
[image:42.612.114.434.388.626.2]3.6 Discussion
The traffic of calcium ions through multiple calcium channels are responsible for a plethora
of cellular responses necessary for normal cell function. Previous data collected in the lab led to
the question of whether Ca2+ mediated pathways were responsible to the induction of cell death of
PC3 cells following treatment with Etn. Fura-2AM, was used to measure [Ca2+]i, Its ratiometric
property allows imaging software to calculate an accurate fluorescence by comparing the intensity
of emission at 340 and 380 nm in order to accurately calculate [Ca2+]i. Measurements were
recorded in conditions where extracellular calcium was and was not available ([Ca2+]
ex = 0),. In
both cases, a transient increase in calcium signaling can be observed approximately 2 minutes
following Etn treatment (Figure 3.2).
The rates of transient Ca2+ increase differ depending on whether or not there are external
sources of Ca2+. The sharp rise of the intensity of fluorescence in Ca2+-rich conditions compared
to slower rise in Ca2+-free conditions is indicative of Ca2+ influx from the extracellular
environment in order to replenish the Ca2+ stores within the cell or the depolarization of the plasma
membrane, opening the voltage-gated Ca2+ channels and allowing ions to the cytosol. This
transient increase in [Ca2+]i, that was independent on the presence of extracellular calcium suggests
Etn-induced calcium release from intracellular stores. This increase in [Ca2+]i, in turn, can affect
the polarization of the mitochondrial membrane, leading to the activation of [Ca2+]
i,-mediated cell
death pathways through the release of cytochrome c [31][30].
Following transient Ca2+ increase in both conditions, baseline fluorescence did not return
to control levels. This difference may be attributed to the availability of Ca2+ in the environment
and the tight regulation of Ca2+ homeostasis in the cytosol. In conditions where Ca2+ is available
maintain normal [Ca2+]
i (100nM). The opposite is true for cells that were observed in [Ca2+]e=0.
A Ca2+ chelator is added to the solution to guarantee a near zero and insignificant concentration of
Ca2+ in the extracellular environment, leaving Ca2+ leaked out of the plasma membrane to become
unavailable for re-entry. This may cause the cell to prevent further sequestering into the ER or
mitochondria until a point in time where exchange between intracellular and extracellular Ca2+
sources, as it occurs normally, can be re-established. Perhaps a longer observation of cells in both
conditions see the fluorescence returning to control baseline levels.
Having established a change in [Ca2+]
i following Etn treatment, it was of importance to
review the impact of this change on the cell’s mitochondria. The compounding of changes in
mitochondrial potential and [Ca2+]i could point towards the triggering of Ca2+-mediated cell death
pathways as the source of Etn’s effectiveness. A fluorescent polarization marker,
tetramethylrhodamine, ethyl ester (TMRE), was employed alongside live cells imaging to track
changes in . The addition of Etn led to a brief hyperpolarization period, followed by a sustained
depolarization of the mitochondria (Figure 3.5.2) around the same time in which changes in [Ca2+]
i
occur. It may be possible that the Ca2+ release from the mitochondria initiates the release of Ca2+
from ER, causing the initial hyperpolarization before going into sustained depolarization.
Previously, our lab has shown that treatment of PC3 cells with Etn led to a decrease of Bax
and an increase in Bcl-2 expression, all necessary for the initiation of apoptosis. In order to
substantiate these assumptions, further experiments on the effect of intracellular Ca2+ stores in the
process of apoptosis are required. The idea behind this would be to determine whether the
emptying of intracellular Ca2+ stores, such as the ER and mitochondria prior to Etn treatment will
apoptosis signaling cascade due to the activation of Bax, the decrease of Bcl-2 and the release of
cytochrome c from the mitochondria.
3.7 Conclusion
The effects of Ca2+ changes within the cell activate a diverse range of pathways necessary
for normal cell growth, function and the initiation of programmed cell death. The effects of calcium
signaling are widespread and can involve different organelles, including the ER and the
mitochondria. Transient increases in [Ca2+]
i can induce the formation of the apoptosome by the
activation of apoptotic markers and the release of cytochrome c from the mitochondria due to
changes in mitochondrial membrane potential. Etn causes the transient increase of Ca2+ in the
cytosol of healthy cells through the depletion of intracellular calcium stores and import of Ca2+
from the extracellular environment. This depletion of intracellular stores accompanies a
simultaneous dysregulation of . Taking these results into consideration with previous data of
Etn decreasing the activity of anti-apoptotic markers and increasing the activity of pro-apoptotic
markers we can conclude that part of Etn’s effectiveness comes from the activation of Ca2+
-dependent apoptotic pathways. This increase in intracellular Ca2+ may also be the trigger of Ca2+
-dependent hormone stimulated lipolysis. Measurement of the rate of lipolysis with and without the
emptying of ER Ca2+ stores prior to treating with Etn would conclusively link the transient Ca2+
4 AIM 3: IDENTIFICATION OF KEY PLAYERS IN LIPID
METABOLISM-RELATED CELL DEATH
4.1 Introduction
Lipids are an essential macromolecule for healthy cell function[10][9]. They comprise of a group of
hydrophobic molecules that include triacylglycerides (TAGs), sterols, sphingolipids, and
phospholipids and are necessary at a cellular level for energy storage and structural purposes[9].
Fatty acids (FA) are the building blocks for TAGs, part of lipids that are stored within LD stores,
whereas phospholipids, sterols and sphingolipids are the major components of all biological
membranes[9][44]. In addition to energy and structure, lipids can have roles in cell signaling, some
working as second messengers and hormones for the purpose of communication between cells[9].
It has been established that lipid metabolism within cancer cells greatly differs from the
metabolism of “normal” healthy tissue[10][9][44][45][46]. These changes can affect cell growth rate,
proliferation, differentiation and motility[45].
Most eukaryotic mammalian cells import their lipids from the extracellular environment,
rather than making their own[10][9]. FA and lipoproteins are synthesized in the liver or adipocytes
from the breakdown of carbohydrates. These molecules enter circulation and are taken up by cells
to use as energy or to store them in the form of LDs[9][44]. Fetal and undifferentiated cells possess
the ability to create their own lipids in a process known as de novo lipogenesis[10]. However, once
cells differentiate into mature cells, only a handful of cell types, including liver, adipose and
lactating breast tissue, retain this ability[10].
In order to make FA, cells use acetyl groups provided by citrate from the tricarboxylic acid
cycle (TCA) and convert it into acetyl-coenzyme A (acetyl-CoA) and oxaloacetate in an adenine
nicotinamide adenine dinucleotide phosphate (NADPH), which is used in the pentose phosphate
pathway to make lipids[10][9]. Acetyl-CoA is transformed to malonyl-CoA in an enzyme-catalyzed
reaction, subsequently acetyl and malonyl groups are coupled to the fatty-acid synthetase
enzyme[10] [9]. The condensation of acetyl groups generates a 16-carbon saturated FA known as
palmitic acid[10] [9]. This FA is elongated and desaturated in the cytoplasmic face of the ER
membrane[10] [9]. Desaturation alters the newly-synthesized FA’s physical properties in order to
create species suitable for either plasma membrane creation (sphingolipids, phospholipids) or
energy storage (triacylglycerides)[10][9].
Another important process within lipid metabolism is the mevalonate pathway, from which
cholesterol is synthesized[9] [45]. This process involves the condensation of acetyl-CoA with
acetoacetyl-CoA to form 3-hydroxy-3-methylglutaryl-CoA (HMG-CoA)[9] [45]. The reduction of
HMG-CoA to mevalonate by HMG-CoA reductase represents the rate-limiting reaction of this
pathway and is highly regulated[9][45]. Cholesterol is an important component of cell membranes,
responsible for modulating the fluidity of the bilayer and forming detergent-resistant
microdomains called lipid rafts that can also be used as signal transducers[9][45][44]. Additionally,
sterols form the backbone of hormones, and so, are important in their synthesis. Previous studies
have identified the accumulation of cholesterol as a hallmark of prostate cancer[45].
Cancer cells are characterized by proliferation rates that are faster than their healthy
counterparts[10][9][45] [46]. This high proliferation rate requires large amounts of lipids in order to
create new membranes[10][9][45][46]. Scientists discovered long ago that cancerous tissues possess
the ability to undergo de novo lipogenesis in a manner similar to embryonic tissue[10]. Some
cancers, like breast and prostate, are characterized by an increased expression of fatty acid
[9] [44]. However, the source of these FAs may determine the phospholipid composition of the
membranes due to the cell’s limited ability to synthesize polyunsaturated FAs de novo, as they do
not possess the enzyme 12 desaturase[44]. This means that cancer cell membranes are enriched
with a mixture of saturated and monounsaturated FAs, which are less prone to lipid peroxidation,
and, therefore, more resistant to oxidative stress-induced cell death[9][44]. Saturated lipids are more
densely packed, which alters membrane dynamics that limit uptake of materials from the
extracellular environment, such as drugs, which poses a problem with targeted therapies[9][44].
Most cancer cells exhibit an increased consumption of glucose, which they break down
through the glycolytic pathway to create lactate, regardless of the availability of oxygen, a
phenomenon known as the ‘Warburg Effect’[44][10]. It is possible, however, to break down FAs for
energy through a process called -oxidation[44] [9]. In this process, cytoplasmic free-FAs are
coupled to CoA and transferred to carnitine by the enzyme carnitine acyltransferase and shipped
into the mitochondrial matrix[44][9]. After entering the mitochondria, the acyl chains are recoupled
to CoA, where it undergoes several steps of oxidation and hydration, yielding NADH and flavin
adenine dinucleotide (FADH2), as well as acetyl-CoA that can enter the tricarboxylic acid (TCA)
cycle[44] [9]. In the case of prostate cancer, tumors exhibit low rates of glucose consumption,
increased FA uptake, and an increased dependence on -oxidation of FAs as their main source of
energy[44][9]. Additionally, prostate cancers have been shown to overexpress certain markers, such
as elongases leading to the production of very long FA chains that may play a role in cancer
transformation[44][9][10].
Different cancer cell types have different preferences as to where they mainly source their
FA[44]. Although, it is generally acknowledged that de novo lipogenesis is an active pathway, it is