A STUDY ON THE APPLICATION OF GRAVITATIONAL
SEARCH ALGORITHM IN OPTIMIZING STEREO
MATCHING ALGORITHM
’
S PARAMETERS FOR
STAR FRUIT INSPECTION SYSTEM
Amar Faiz Zainal Abidin
4, Norlina Mat Zain
1, Masmaria Abdul Majid
1, Rozi Rifin
1, Kamaru Adzha Kadiran
1,
Ahmad Musa Mohd Mokji
2, Tan Kok
2, Rahman Amirulah
2and Nursabillilah Mohd Ali
31
Faculty of Electrical Engineering, Universiti Teknologi MARA, Cawangan Johor, Kampus Pasir Gudang, Johor, Malaysia
2
Faculty of Electrical Engineering, Universiti Teknologi Malaysia, Skudai, Johor, Malaysia
3
Faculty of Electrical Engineering, Universiti Teknikal Malaysia Melaka, Malaysia
4
Faculty of Engineering Technology, Universiti Teknikal Malaysia Melaka, Malaysia E-Mail: [email protected]
ABSTRACT
This paper reports the result obtained by implementing Gravitational Search Algorithm for tuning Stereo Matching Algorithm’s parameters for the application star fruit inspection system. The hardware for the inspection system is built by CvviP from Universiti Teknologi Malaysia using only single camera. The implemented Stereo Matching Algorithm used on the system comes from the built-in Matlab library. Each agent of Gravitational Search Algorithm in the search pace represents a set of candidate numerical value of the stereo matching’s parameters. The sum of absolute error of the gray scale value of both images is used to indicate the fitness function. Benchmarking has done by comparing the result obtained with the previous literature that implements Particle Swarm Optimization. The result indicates that the application of Gravitational Search Algorithm as parameters tuner for stereo matching’s parameters tuning is essentially on par with the Particle Swarm Optimization Algorithm.
Keywords: fruit inspection, image processing, pattern recognition, gravitational search algorithm, stereo vision.
1. INTRODUCTION
Originally from Sri Lanka, star fruit has been around Asian countries for hundreds of years [1]. According to M. M. Mokji et al. (2007), star fruit has to pass the inspection process, whereby the star fruit has to be inspected for five criteria: maturity, freshness, free from defects, free from damage, and uniform in size.
Automation system for fruit inspection has been implemented successfully in numerous types of fruits. Next few paragraphs will concisely describe these success stories. Based on the literatures mentioned here, the fruit inspection works can be done by replicating four important human senses: sight, smell, feel and taste. Hence, the inspection to the fruits has follows these attributes: taste, smell, weight, color, shape and size. The subsequent paragraphs will explain each of these attributes.
The sense of taste is one of the five human senses. As we know human can easily differentiate the following tastes: sweet, bitter, sour, salty. Recently, scientists able to prove that human also can categorize another type of taste called umami (Yamaguchi T and Ninomiya K, 1999). Most of the literatures attempts to replicate human taste by measuring amount of sugar content in the fruit. M. Tsuta et al. (2012) proposes that the sugar content of a melon can be measure by using NIR vision.
The author suggested that this would avoid bias caused by the human-visual color information. This work analysis revealed that each of the two second-derivative absorbencies at 874 nm and 902 nm had a high correlation with the sugar content of melons. Z. Xiaobo et al. (2007)
used NIR spectrophotometer to measure the level of sugar inside apple. The authors choose Fiji apple as the experimental subject. The authors highlighted that there is a relationship between the sugar level and NIR wavelengths where different NIR wavelengths indicates different sugar level in the Fuji apple. Then, a system is built to classify the sugar content by using ANN algorithm. The result indicates 94% of success in classifying the sugar content level of the Fuji apple using the proposed system. Like the first two literatures, A. A. A. Rahim et al. (2011) used NIR spectroscopy in identifying the sweetness of the Malaysian papaya. The authors differ slightly from the first two literatures by measuring the soluble solid content, instead of directly measuring the sugar level of the fruit. In their works, they proposed a classification method called Fuzzy Inference System to process information obtained from the NIR spectroscopy. The authors claimed that the proposed system has an accuracy of 70%.
stage of ripeness of the durian. The artificial nose used here comprised of metal oxide gas sensor. The numerical response from the artificial nose was then analyzed using PCA. The finding indicates that the artificial nose has potential for commercial use. R. Infante et al. (2008) studies the application of artificial nose with other methods of measurements in evaluating the freshness of the peaches stored in cold storage. The result indicates that artificial nose can be use in evaluating the freshness of the peaches.
C. C. Kung et al. (2012) proposed a homemade hyper-spectral imaging system to detect internal and external quality of papaya. The proposed system able to measures numerous physical properties of the fruit such as weight, volume, length, width, height, and colour. The authors claimed that there is a strong linear correlation between the weight and the parameter area of side view cross section of the fruit.
Color grading using image processing has the most academic literatures available. The first work is done by F Y. A. Rahman et al. (2009) which is based on RGB color space. The proposed approach is applied to monitor watermelon ripeness. Each of the numerical value of RGB components measured is feed into fuzzy logic system. The fuzzy logic system is used to determine the ripeness level of the watermelon. Finding indicates that the proposed approach able to obtain 95% t0 100% accuracy level for the sample studied. A system using RGB color was proposed by M. S. M. Alfatni et al. (2008) in determining the ripeness of the oil palm fruit bunches. In term of performance, the proposed system able to categorize the fruit ripeness into three categories with 90% accuracy. M. M. Mokji et al. (2006) proposed the use of red and green color map to perform star fruit grading. The ripeness is classified into 6 categories. The result indicates the proposed approach able to achieve accuracy of 94.9%. Another color space that can be used for fruit inspection applications is the HIS color space. According to R. Amirullah et al. (2010) that scientist and graphic artists prefer HSI colour space because it is easier for human to think about the colours in term of hue, saturation and intensity rather than a much digital approach of the mathematical operations in RGB. M.Z. Abdullah et al. (2005) proposed the use of hue component from HIS color space. The authors use ANN to classify the maturity of the star fruit: unripe, under ripe, ripe, and overripe. According to the finding, the proposed system was able to classify correctly 92% of the tested samples. M. M. Mokji et al. (2007) proposed that the transformation of the two colours of red and green to their hue equivalent. This will reduce complexity of the classification without trading off the classification performance. The performance of the proposed approach is 93% accuracy.
The last factor is the fruit inspection is the shape and size of the fruit. N. B. A. Mustafa et al. (2008) proposed an image processing method to classify banana into four sizes: extra-large, large, medium, and small. The proposed approach starts by detecting the boundary of the banana. Based on the extracted, the size of the image can be calculated. Equipped with the information of the size,
the grade and type of the banana can be determined. S. N. Nasroddin et al. (2014) implemented Stereo Matching Algorithm (SMA) to detect the size of the star fruit. Particle Swarm Optimization (PSO) is used to optimize the SMA’s parameters. This research used the same methodology as S. N. Nasroddin et al. (2014) in order to benchmark the effectiveness of Gravitational Search Algorithm (GSA) in tuning the stereo SMA’s parameter.
2. METHODOLOGY
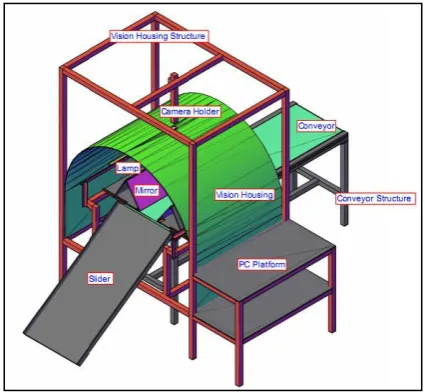
As mentioned earlier, the hardware of star fruit inspection is built by the Universiti Teknologi Malaysia Computer Vision, Video and Image Processing Research Group (CvviP) using only single camera. Figure-1 shows the 3D drawing of the star fruit inspection system and Figure-2 shows the actual hardware of the star fruit inspection system. The hardware implementation had been explained extensively in Amirullah, R et al (2010). This includes details on the hardware architecture, hardware specification, camera calibration, and calculation of coordinate in real world.
[image:2.595.320.533.393.589.2]Figure-3 shows a set of images acquired from the hardware setup. The images are 15% from original size obtained from the camera. It can be seen there is illumination on the images.
Figure-2. The actual hardware of the star fruit inspection system.
Figure-3. (a) First image captured from the hardware setup.
Figure-3. (b) Second image captured from the hardware setup.
Similar to S. N. Nasroddin et al. (2014), the software execution of this research is illustrated in Figure-4. This covered three main processes which are pre-processing, disparity acquisition, and producing disparity map.
Figure-4. Processes in software execution.
The pre-processing of the images starts by denoising the images. The objective is to reduce noise of the image due to uneven lighting, or illumination. Illumination of a pixel, Ii can be roughly estimate by subtracting the intensity of background image with lamp on, Ibl with the intensity of background with lamp off ,Ibw, as shown in Equation 1. This is done for all three color scheme: Red-Green-Blue (RGB).
𝐼 = 𝐼𝑏 − 𝐼𝑏𝑤 (1)
Next, the background is removed from the object. This process is called thresholding. The threshold value is set at 10% of the maximum value of the RGB color scheme as stated in Equation 2. This is to reduce the computation time of the SMA by computing disparity of the region of interest (ROI) only, instead of the entire image.
𝐼 > 5 → 𝐼 ∈ 𝑅 𝐼 ∧ 𝐼 ≤ 5 → 𝐼 = ∅ (2)
Then, the ROI is converted from RGB color scheme into gray scale,𝐼𝑔 using luminosity method which gives more priority to green, 𝐼𝑔 compared to red,
𝐼𝑔 = . ×𝐼 + . ×𝐼 + .7 ×𝐼 𝑏 (3)
Figure-5. (a) Denoise image. (b) Threshold image. (c) Gray scale image.
Disparity acquisition consists of SMA and optimization SMA using GSA. The stereo matching algorithm implements Sum of Absolute Difference (SAD) to find matching pixels of both images. In order to simplify the benchmarking works, this research uses built-in SMA built-in the MATLAB R2012a documentation (Matlab R2012a). As stated in (Matlab R2012a), the algorithm starts by computing a measure of the contrast of the image using Sobel filter. Then disparity is computed based on block matching with SAD as the matching cost and Winner-Take-All rule. There are seven parameters involved in the SMA, which are: contrast threshold ( ), block size ( ), disparity range ( is for minimum value and is for the maximum value), texture threshold ( ), uniqueness threshold ( ), End distance threshold ( ). Description of these parameters can be obtained from (Matlab R2012a).
The parameters in the SMA are generally problem specific, hence it requires optimization to optimize the parameters. Algorithm 1 shows the implementation of the generic GSA by E. Rashidi et al. (2009) for optimizing the parameters. The agent position can be modeled as Equation 4.
= [ , , , , , , ]𝑇 (4)
Where s to s are bounded by constraints shown in Equation 5 to Equation 10.
< ≤ (5)
5 ≤ ≤ 55, = 5 + , = , . . , 5, < 𝐼 , < 𝐼 (6)
−
= , ∈ ℕ, ∈ ℤ, ∈ ℤ, < , < 𝐼 ,
< 𝐼 (7)
≤ ≤ (8)
∈ ℕ (9)
The fitness or objective function used is to calculate the fitness for the entire ROI which is shown in Equation 11.
This research is a minimization problem thus, the definition of best and worst are as stated in Equation 12 and 13, respectively:
= ∈{ ,…, } (12)
= ∈{ ,…, } (13)
Where is the current iteration, rrepresents -thagent, is number of agent, represents the fitness of the agent. Values of G, M and𝛼can be updated using Equation 14, 15 and 16, respectively:
𝐺 = 𝐺 × 𝛽 (14)
=
∑𝑁=𝑏 − 𝑤𝑜− 𝑤𝑜 (15)
𝛼 = ∑= , ≠ ×𝐺 × 𝑅 +𝜀 − (16)
Where 𝑅 is the Euclidean distance between agent and . Meanwhile, is a random number in the interval [0,1]. Agent’s velocity, and position, can be updated using Equation 17 and Equation 18, respectively.
+ = × + 𝛼 (17)
+ = + + (18)
Algorithm 1: GSA Algorithm for parameters tuning in Stereo Matching Algorithm
01: Initialize values of G and v
02: Generate initial population by having agent randomly assigned at the search space based on model in Equation 4 and bounded by constraints (Equation 5 to Equation 10)
03: while stopping condition not met 04: for each particle do
05: Calculate the fitness of the agent using Equation 11
06: if agent fitness value better than the current
global best then
07: Set fitness value as the new global best
08: 𝒊
09: 𝒓
10: Update the G, best and worst of the population using Equation 14, 12 and 13.
11: for each agent do
12: Calculate M and according to Equation 15 and Equation 16
13: Update agent velocity and position using Equation 17 and Equation 18
14: end for
15: end while
3. RESULTS AND DISCUSSIONS
Images of the star fruit used in this research has been shown earlier in Figure-3. This research has used a laptop powered by 1.40 GHz Intel i3-2367M CPU, 4.00
GB RAM, 64-bit Windows 7 Home Premium OS. The computation time to complete a simulation is about one hour. Table-1 shows the parameters used in this research compared to S. N. Nasroddin et al. (2014).
Table-1. PSO, BPSO and GSA parameters.
Parameters PSO [18] BPSO [18] GSA
Number of agents 50 Not applicable
Number of iterations 500 Not applicable
Number of computations 10 Not applicable
Inertia weight 0.9 → 0.4 Not applicable
Cognitive component 1.42 Not applicable
Social component 1.42 Not applicable
ε Not applicable 1
Not applicable 0.7
G Not applicable 1
Table-2. Result Obtained from PSO, BPSO and GSA.
Criteria PSO [18] BSPO [18] GSA Manual -try & error
Best found fitness 3725248 3817866 3725248 4033244
Average fitness 4254618 4541112 3825254 6013186
Table-2 summarizes the result obtained from 10 computations. The results obtained indicate that GSA achieved similar best found fitness like PSO. While, the average fitness of 10 computations shows that GSA is far better than PSO and BPSO. GSA able to obtain 8 out of 10 times best found fitness of 3725248 which contributed the low average fitness of GSA as compared to PSO and BPSO. This shows that GSA is more consistent than PSO and BPSO.
Figure-6 shows the disparity map obtained with GSA method. Figure-7 shows the disparity map obtained using a manual, try and error approach. Although, the image obtained in Figure-7 is smoother, but it hardly represents a star fruit shape. This is because the parameter values chosen by the user might not be optimized or good enough for the implementation.
Figure-6. Best found disparity map using GSA.
Figure-7. Best found disparity map using manual – try and error method.
4. CONCLUSIONS
In this paper, the authors have implemented GSA in tuning the parameters of SMA. The result obtained shows that the algorithm is actually on par with PSO. Besides that, it can also be concluded that to fully utilize the optimization algorithm available, fundamental problem such as illumination during capturing the star fruit image should be addressed in the first place.
ACKNOWLEDGEMENT
REFERENCES
[1] Trade Wind Fruit. 2012. Star Fruit. [online] Available at: http://is.gd/paAjmI [Accessed 29 May 2012].
[2] Mokji M. M. and Bakar S. A. R. A. 2007. Starfruit Classification Based on Linear Hue Computation. In Journal of Elektrika. 9(2): 14-19.
[3] Yamaguchi T. and Ninomiya K. 1999. Umami and Food Palatability. Flavor Chemistry: 30 Years of Progress. New York: Kluwer Academic/Plenum Publisher.
[4] Tsusta M., Sugiyama J. and Sagara Y. 2002. Near-infrared imaging spectroscopy using a hyper-spectral camera – Visualization of the sugar distribution in the flesh of melons. In Journal of the Institute of Image Information and Television Engineers. 56(12): 2037-2040.
[5] Xiaobo Z., Jiewen Z., Xingyi H. and Yanxiao L. 2007. Use of FT-NIR in non-invasive measurements of soluble solid contents of ‘Fuji’ apple based on different PLS models. In Journal of Chemometrics and Intelligent Laboratory Systems. 87(1): 43-51.
[6] Rahim A. A. A., Sawal M. S. A., Tajjudin, M., and Halim I. S. A. 2011. A Non-invasive Method to Measure the Sweetness of the Malaysian Papaya Quantitatively Using NIR Full transmittance Technique - A Preliminary Study. In Proceeding of International Conference on Computational Intelligence, Communication Systems and Networks. 379-384.
[7] Brezmes J., Fructuoso Ma. L. L., Llobet E., Villanova X., Recasens I., Orts J., Saiz, G. and Correig X. 2005. Evaluation of an electronic nose to assess fruit ripeness, In IEEE Sensor Journal. 5(1): 97-108.
[8] Pokhum C., Chawengkinjwanich and Maolanon R. 2009. Application of Electronic-Nose for Identification of Ripeness Stage of Durian. In Proceeding of Souteast Asia Symposium on Quality and Safety of Fresh and Fresh-Cut Produce.
[9] Infante R., Farcuh M. and Meneses C. 2008. Monitoring the sensorial quality and aroma through an electronic nose in peaches during cold storage. In Journal of the Science of Food and Agriculture. 88(12): 2073-2078.
[10]Kung C. C., Lee M. H. and Hsieh C. L. 2012. Development of an ultraspectral imaging system by using a concave monochromator. In Journal of the Chinese Institute of Engineers. 35(3): 329-342.
[11]Rahman, F. Y. A., Baki, S. R. M. S., Yassin, A. I. M., Tahir, N. M., and Ishak, W. I. W. 2009. Monitoring of Watermelon Ripeness Based on Fuzzy Logic. In Proceeding of the 2009 WRI World Congress on
Computer Science and Information Engineering. 6, 67-70.
[12]Alfatni M. S. M. 2008. Oil Palm Fruit Bunch Grading System Using Red, Green, and Blue Digital Number. In Journal of Applied Sciences. 8, 1444-1452.
[13]M. M. Mokji and Bakar, S. A. R. A. 2006. Starfruit Grading Based on 2- Dimensional Color Map. In Proceeding of Regional Postgraduate Conference on Engineering and Science. 203-206.
[14]Amirullah R., Mokji M. M. and Ibrahim Z. 2010. Starfruit Color Maturity Classification Using Cr as Feature. In Proceeding of Signal-Image Technology and Internet-Based Systems. 93-97.
[15]Abdullah M. Z., Saleh J. M., Syahir A. S. F. and Azemi B. M. N. M. 2005. Discrimination and classification of fresh-cut starfruits (Averrhoa carambola L.) using automated machine vision system. In Journal of Food Engineering. 76(4): 506-523.
[16]Mokji, M. M., and Bakar, S. A. R. A. 2007. Starfruit Classification Based on Linear Hue Computation. In Journal of Elektrika. 9(2): 14-19.
[17]Mustafa N. B. A., Fuad N. A., Ahmed S. K., Abidin A. A. Z., Ali Z., Yit and W. B., Sharrif Z. A. M. 2008. Image processing of an agriculture produce: Determination of size and ripeness of a banana. In Proceeding of International Symposium on Information Technology. 1-7.
[18]S. N. Nasroddin, M. M. Mokji, T. Kok, A. F. Z. Abidin, R. Amirulah, N. A. Nordin, S. H. Hasim, H. Zakaria, J. Hassan, H. I. Jaafar, K. Osman. 2014. Application of Particle Swarm Optimization in Optimizing Stereo Matching Algorithm’s Parameters for Star Fruit Inspection System. In Proceeding of International Conference Recent Trends in Engineering & Technology. 11-15.
[19]Matlab R2012a. Disparity () function. URL: http://is.gd/fvTcA9 [Accessed 29 May 2012].