Rapid Antimicrobial Susceptibility Testing Using Forward Laser Light
Scatter Technology
Randall T. Hayden,aLani K. Clinton,bCarolyn Hewitt,aTerri Koyamatsu,cYilun Sun,dGinger Jamison,aRosalie Perkins,aLi Tang,d Stanley Pounds,dMatthew J. Bankowskic,e
St. Jude Children’s Research Hospital, Departments of Pathologya
and Biostatisics,d
Memphis, Tennessee, USA; Diagnostic Laboratory Services, Inc. (The Queen’s Medical Center), Aiea, Hawaii, USAc
; Department of Pathology and Department of Tropical Medicine, Medical Microbiology and Pharmacologye
and Pathology Residency Program,b
John A. Burns School of Medicine, University of Hawaii at Manoa, Honolulu, Hawaii, USA
The delayed reporting of antimicrobial susceptibility testing remains a limiting factor in clinical decision-making in the
treat-ment of bacterial infection. This study evaluates the use of forward laser light scatter (FLLS) to measure bacterial growth for the
early determination of antimicrobial susceptibility. Three isolates each (two clinical isolates and one reference strain) of
Staphy-lococcus aureus,
Escherichia coli, and
Pseudomonas aeruginosa
were tested in triplicate using two commercial antimicrobial
testing systems, the Vitek2 and the MicroScan MIC panel, to challenge the BacterioScan FLLS. The BacterioScan FLLS showed a
high degree of categorical concordance with the commercial methods. Pairwise comparison with each commercial system
serv-ing as a reference standard showed 88.9% agreement with MicroScan (two minor errors) and 72.2% agreement with Vitek (five
minor errors). FLLS using the BacterioScan system shows promise as a novel method for the rapid and accurate determination of
antimicrobial susceptibility.
R
apid, accurate identification and antimicrobial susceptibility
testing (AST) is necessary for optimal clinical
decision-mak-ing and resource utilization. Timely antibiotic therapy is
particu-larly critical to outcomes in patients with sepsis (
1
), because each
hour of delay within the first 6 h for patients with septic shock
results in a 7.6% decrease in survival (
2
). Long turnaround times
(TAT) for either identification or AST result in empirical rather
than pathogen-specific therapy. As a result, patients are often
given empirical broad-spectrum antibiotics based on clinical
sus-picion and epidemiology.
Delays in both pathogen identification and AST have led to
inappropriate or unnecessary antibiotic use in 20 to 50% of
pa-tients in acute-care hospitals in the United States (
3–8
). Such care
provides uncertain clinical benefit and may increase the risk for
unexpected side effects, such as
Clostridium difficile
infection,
hep-atotoxicity, cardiac arrhythmias, or hemolysis (
9–12
). Standard
identification and susceptibility methods based on traditional
phenotype testing in the past typically required 24 to 72 h, with an
average TAT of 40 h as reported by Kerremans et al. (
13
).
Fortu-nately, TATs have decreased due to advances in technology. For
example, in a recent report by Machen et al., the average TAT for
both identification and AST was 11.4 h using the lysis-filtration
method for both Vitek MS and VITEK2 compared with 56.3 h for
conventional methods (
14
).
Molecular-based platforms are an increasingly popular option
that offers rapid TAT for the detection of genes such as
mecA
,
which confers antibiotic resistance to methicillin-resistant
Staph-ylococcus aureus
(MRSA). These assays may provide results in less
than 2 h (
15–17
). However, molecular detection of the gene
tar-gets is far from a perfect solution, targeting only select genetic loci,
typically responsible for only a fraction of important resistance
patterns. In addition, findings are not always specific. For
exam-ple, methicillin resistance by genotyping does not always indicate
phenotypic resistance. This is evidenced by the finding of “
mecA
dropout” or “empty cassette” strains (
17
,
18
).
There is a widespread effort to improve pathogen-specific
an-tibiotic use. In order to support this goal, the Centers for Disease
Control and Prevention (CDC) have recommended that all
acute-care hospitals implement antibiotic stewardship programs (ASPs)
(
8
). The goal of ASPs is to optimize appropriate antimicrobial
treatment, thereby reducing adverse outcomes (
19–21
) and
pre-venting further antimicrobial resistance. Technologies have
evolved to address these needs, and they include not only
molec-ular methods but also methods based on the use of microfluidics,
cell lysis detection, mass spectrometry, rapid cytometry,
isother-mal microcalorimetry, and magnetic bead rotation, among others
(
22–25
). Forward laser light scatter (FLLS) is another promising
emerging technology that depends on electro-optical technology
to measure bacterial growth prior to visual assessment. It has the
potential of offering the sensitivity of phenotypic methodology
with the rapid TAT of a molecular test. This study provides initial
proof-of-principle data regarding the use of FLLS technology for
AST testing, comparing accuracy and TAT to those of
conven-tional AST systems.
MATERIALS AND METHODS
Study design.Three isolates each ofStaphylococcus aureus,Escherichia
coli, andPseudomonas aeruginosawere used, including two delinked
clin-Received8 July 2016 Returned for modification24 July 2016 Accepted15 August 2016
Accepted manuscript posted online24 August 2016
CitationHayden RT, Clinton LK, Hewitt C, Koyamatsu T, Sun Y, Jamison G, Perkins R, Tang L, Pounds S, Bankowski MJ. 2016. Rapid antimicrobial susceptibility testing using forward laser light scatter technology. J Clin Microbiol 54:2701–2706.
doi:10.1128/JCM.01475-16. Editor:R. Patel, Mayo Clinic
Address correspondence to Randall T. Hayden, [email protected].
Supplemental material for this article may be found at
http://dx.doi.org/10.1128/JCM.01475-16.
Copyright © 2016, American Society for Microbiology. All Rights Reserved.
on May 16, 2020 by guest
http://jcm.asm.org/
ical isolates and one reference strain. All isolates were coded and tested blindly in triplicate using FLLS and in singlet using two commercial AST systems. The commercial systems used were the automated Vitek2 (bio-Mérieux, Marcy l’Etoile, France) and the manual MicroScan (Siemens, Erlangen, German). The commercial AST systems were compared to FLLS using the BacterioScan 216R system (BacterioScan, Inc., St. Louis, MO). Errors were characterized using standard definitions as described in
the CLSI M23-A3 document as very major, major, and minor (26).
Cation-adjusted Mueller-Hinton broth (CAMHB) was used to dilute the stock solution of each antimicrobial using a 2-fold increment dilution
scheme with concentrations based on CLSI guidelines (M100-S25) (27).
Bacterial inocula were prepared as follows. Isolated colonies were picked from an 18- to 24-h agar plate and suspended in saline to achieve a tur-bidity equivalent to a 0.5 McFarland standard. Within 15 min of prepa-ration, this suspension was further diluted 1:150 in saline to give an
ap-proximate concentration of 1⫻106CFU/ml of organism. A final 2-fold
dilution occurred when 1 ml of the adjusted inoculum was added to each tube containing 1 ml of antimicrobial agent in the dilution series. The final volume for each of the bug-drug combination dilutions was 2 ml. The 2-ml aliquot was then used for inoculation of the BacterioScan system. Broth microdilution using the MicroScan panel system and MIC testing using the Vitek2 system were performed at Diagnostic Laboratory Services (DLS). BacterioScan FLLS system testing was performed at the St. Jude Children’s Research Hospital.
Forward laser light scatter system.There is a long history of using laser light scatter instrumentation to study microbiological samples,
in-cluding the effects of antibiotics (28–31). The BacterioScan system uses a
laser light source to measure a liquid sample’s optical density (OD) as well as the scattered intensity in a direction that passes near the laser beam. This low-angle forward scattered signal allows the instrument to approx-imate the sample’s OD value to levels significantly lower (1 or 2 orders of magnitude) than those obtainable using a simple ratiometric transmit-tance type measurement. The BacterioScan system uses a low-power laser (typically in the visible wavelength range, i.e., 400 to 700 nm) passing through approximately 25 mm of a liquid sample in a specially designed cuvette to minimize noise signals from various sources. Since typical bac-terial samples have sizes in the 100- to 10,000-nm range, the sample size is comparable to the light wavelength; thus, Mie scattering theory is appro-priate. Mie scattering theory is named after its developer, German physi-cist Gustav Mie, and refers to a series solution of Maxwell’s equations for scattering by spheres or by infinite cylinders or other geometries where one can write separate equations for the radial and angular dependence of solutions. The formalism is generally used to calculate either how much light is scattered, the total optical cross section, or where it goes in the form factor. The laser beam transmitted through the sample and the low-angle forward-scattered signals are captured on a CMOS 2-dimensional camera sensor. The instrument mathematically processes the sensor im-age to minimize background noise and clutter, calibrates the measured values against predetermined baselines, and generates values for organism density. Multiple measurements over time are compared to calculate growth rates and generation times.
The BacterioScan model 216 tabletop instrument used for this study uses light scattering to measure the concentration of particles in a liquid sample and can be used to estimate the density of microorganisms in a liquid sample. Initially developed for measurement of actively growing organisms in urine, the instrument performs reliably down to a minimum density of 10,000 CFU/ml, which is commonly considered a diagnostic threshold for bacteriuria. Therefore, the laser microbial growth monitor (LMGM) technology has potential for other applications, such as AST. The system capacity accommodates up to 16 samples, which can be run simultaneously with a volume of 2 to 3 ml each. Samples are maintained at a thermostatically controlled elevated temperature to promote growth (onboard incubation), and repeated measurements are automatically col-lected at approximately 3-min increments to provide real-time continu-ous measurement of organism growth.
In the present study, each bacterial strain was tested using serial dilu-tions of three antimicrobials. Antimicrobials tested by FLLS depended on
the organism: forS. aureus, clindamycin (0.25 to 4g/ml), moxifloxacin
(0.5 to 4g/ml), and oxacillin (0.25 to 4g/ml); forE. coli, cefepime (2 to
32g/ml), ciprofloxacin (0.5 to 4g/ml), and gentamicin (1 to 16g/
ml); forP. aeruginosa, cefepime (2 to 32g/ml), ciprofloxacin (0.5 to 4
g/ml), and gentamicin (1 to 16g/ml). After inoculation, growth was
measured by FLLS for 24 h at 36.7 to 37.3°C, with light scatter plotted against incubation time. The MIC of each antimicrobial corresponded to the lowest concentration at which all three replicate inocula showed growth inhibition, as defined below (see the Statistical Analysis section). Interpretation of MIC results as susceptible (S), susceptible-dose depen-dent (SDD), intermediate (I), and resistant (R) were based on CLSI
guide-lines (27).
Categorization of errors.According to standard terminology listed in CLSI M23-A3, errors were classified as very major, major, and minor. A very major error (VME) occurred when the reference method result was resistant and the test method result was susceptible. A major error (ME) occurred when the reference method result was susceptible and the test method result was resistant. A minor error (mE) occurred when the ref-erence method result was either susceptible or resistant with a test method result of intermediate, or the reference method result was intermediate
with a test method result of susceptible or resistant (26).
Statistical analysis.For each sample (representing one replicate of a given bacterial strain at a single concentration of antimicrobial), a dense series of OD measurements was obtained over time. The area under the curve (AUC) of the OD measurements, as a function of time, next was computed for each sample. For each treated sample, the relative area un-der the curve (rAUC) was computed as the ratio of the complete AUC (cAUC) of the treated sample to the cAUC of the control sample. For each set of three replicates of a particular organism strain treated with a partic-ular agent, bacteria were defined to be inhibited if all three rAUC values were less than or equal to 0.10. In this way, for each organism-agent pair, a series of inhibition calls was obtained as a function of agent dose. The MIC was defined as the lowest dose at which an inhibition call was made. For each treated sample among a set of three replicates declared as
inhib-ited, the partial area under the curve until each time point, pAUC(t), was
calculated. For each of these treated samples, the relative partial area
un-der the curve from each time pointt, rpAUC(t), was further determined as
the ratio of the pAUC(t) for the treated sample to the untreated sample.
Time to inhibition was defined as the earliest time point,T, at which all
calculated rpAUC(t) values of the set of three replicates were less than
0.10 for all subsequent time points (tⱖT). Figures S1 and S2 in the
supplemental material illustrate the calculation of the variables used in the statistical analysis. All analyses were performed using SAS, Win-dows version 9.3.
RESULTS
There were 360 experimental samples and 120 control samples
collected for 27 drug-bacterium pairs. Strong bacterial growth was
observed for all 120 control samples. One experimental sample
was dropped from analysis for
E. coli
9992 with cefepime at a
concentration of 4
g/ml, due to insufficient length (duration) of
data collection. A total of 27 drug-bacterium pairs were
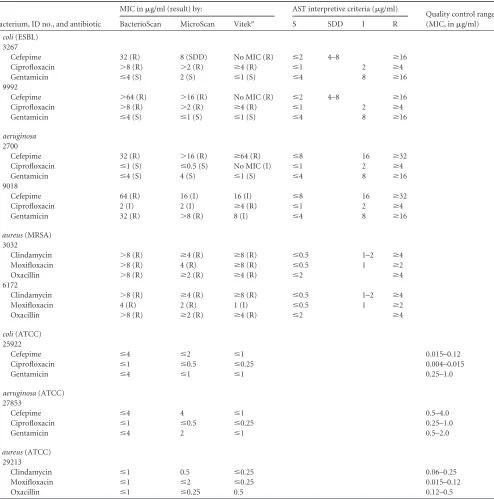
investi-gated, and 19 (70%) revealed inhibition for at least one tested
concentration of antimicrobial (
Table 1
). The remaining 8
drug-bacterium pairs gave a MIC greater than the highest tested
con-centration of antimicrobial. Data quality was adequate for
inter-pretation for all drug-bacterium pairs tested. The MICs for
S.
aureus
,
E. coli
, and
P. aeruginosa
were similar for cefepime,
cip-rofloxacin, and gentamicin on all three platforms,
Bacte-rioScan, Vitek, and MicroScan (
Table 1
). The expected MICs on
Vitek and MicroScan are shown for the ATCC reference strains.
Between Vitek and MicroScan, the only disparate results (showing
on May 16, 2020 by guest
http://jcm.asm.org/
⬎
2 dilution difference) were seen for the
P. aeruginosa
isolate
27853 (cefepime) and for the
S. aureus
isolate 29213
(moxifloxa-cin).
[image:3.585.46.540.76.575.2]A comparison of the interpretative results across the
plat-forms is included in
Tables 1
and
2
. The overall agreement
between BacterioScan and Vitek was 72.2% (13/18), and the
over-all agreement between BacterioScan and MicroScan was 88.9%
(16/18). There was one minor error (mE) for the
E. coli
3267
extended-spectrum beta-lactam (ESBL), where BacterioScan
in-dicated that the organism was resistant to cefepime but MicroScan
TABLE 1MIC from BacterioScan, MicroScan, and Vitek
Bacterium, ID no., and antibiotic
MIC ing/ml (result) by: AST interpretive criteria (g/ml)
Quality control rangeb
(MIC, ing/ml)
BacterioScan MicroScan Viteka S SDD I R
E. coli(ESBL) 3267
Cefepime 32 (R) 8 (SDD) No MIC (R) ⱕ2 4–8 ⱖ16
Ciprofloxacin ⬎8 (R) ⬎2 (R) ⱖ4 (R) ⱕ1 2 ⱖ4
Gentamicin ⱕ4 (S) 2 (S) ⱕ1 (S) ⱕ4 8 ⱖ16
9992
Cefepime ⬎64 (R) ⬎16 (R) No MIC (R) ⱕ2 4–8 ⱖ16
Ciprofloxacin ⬎8 (R) ⬎2 (R) ⱖ4 (R) ⱕ1 2 ⱖ4
Gentamicin ⱕ4 (S) ⱕ1 (S) ⱕ1 (S) ⱕ4 8 ⱖ16
P. aeruginosa
2700
Cefepime 32 (R) ⬎16 (R) ⱖ64 (R) ⱕ8 16 ⱖ32
Ciprofloxacin ⱕ1 (S) ⱕ0.5 (S) No MIC (I) ⱕ1 2 ⱖ4
Gentamicin ⱕ4 (S) 4 (S) ⱕ1 (S) ⱕ4 8 ⱖ16
9018
Cefepime 64 (R) 16 (I) 16 (I) ⱕ8 16 ⱖ32
Ciprofloxacin 2 (I) 2 (I) ⱖ4 (R) ⱕ1 2 ⱖ4
Gentamicin 32 (R) ⬎8 (R) 8 (I) ⱕ4 8 ⱖ16
S. aureus(MRSA) 3032
Clindamycin ⬎8 (R) ⱖ4 (R) ⱖ8 (R) ⱕ0.5 1–2 ⱖ4
Moxifloxacin ⬎8 (R) 4 (R) ⱖ8 (R) ⱕ0.5 1 ⱖ2
Oxacillin ⬎8 (R) ⱖ2 (R) ⱖ4 (R) ⱕ2 ⱖ4
6172
Clindamycin ⬎8 (R) ⱖ4 (R) ⱖ8 (R) ⱕ0.5 1–2 ⱖ4
Moxifloxacin 4 (R) 2 (R) 1 (I) ⱕ0.5 1 ⱖ2
Oxacillin ⬎8 (R) ⱖ2 (R) ⱖ4 (R) ⱕ2 ⱖ4
E. coli(ATCC) 25922
Cefepime ⱕ4 ⱕ2 ⱕ1 0.015–0.12
Ciprofloxacin ⱕ1 ⱕ0.5 ⱕ0.25 0.004–0.015
Gentamicin ⱕ4 ⱕ1 ⱕ1 0.25–1.0
P. aeruginosa(ATCC) 27853
Cefepime ⱕ4 4 ⱕ1 0.5–4.0
Ciprofloxacin ⱕ1 ⱕ0.5 ⱕ0.25 0.25–1.0
Gentamicin ⱕ4 2 ⱕ1 0.5–2.0
S. aureus(ATCC) 29213
Clindamycin ⱕ1 0.5 ⱕ0.25 0.06–0.25
Moxifloxacin ⱕ1 ⱕ2 ⱕ0.25 0.015–0.12
Oxacillin ⱕ1 ⱕ0.25 0.5 0.12–0.5
a
No MIC refers to an expert interpretation using the Vitek2 instrument.
bRanges for cation-adjusted Mueller-Hinton broth (see Table 5A in reference27).
TABLE 2Summary of minor errorsa
Test comparison ID no. Bacterium Antibiotic
BacterioScan vs. MicroScan 3267 E. coli Cefepime
BacterioScan vs. MicroScan 9018 P. aeruginosa Cefepime
BacterioScan vs. Vitek 9018 P. aeruginosa Cefepime
BacterioScan vs. Vitek 9018 P. aeruginosa Gentamicin
BacterioScan vs. Vitek 2700 P. aeruginosa Ciprofloxacin
BacterioScan vs. Vitek 9018 P. aeruginosa Ciprofloxacin
BacterioScan vs. Vitek 6172 S. aureus Moxifloxacin
aNo very major or major errors were seen.
on May 16, 2020 by guest
http://jcm.asm.org/
[image:3.585.298.544.629.716.2]indicated it was susceptible, dose dependent. There was also one
mE with cefepime for
P. aeruginosa
9018 where the MicroScan
result was intermediate and the BacterioScan result was resistant.
There was a high degree of concordance for bacterial resistance
with Vitek with only five mEs (
Tables 1
and
2
). These mEs
oc-curred with ciprofloxacin for
P. aeruginosa
2700 and 9018, with
cefepime and gentamicin for
P. aeruginosa
9018, and with
moxi-floxacin for
S. aureus
6172.
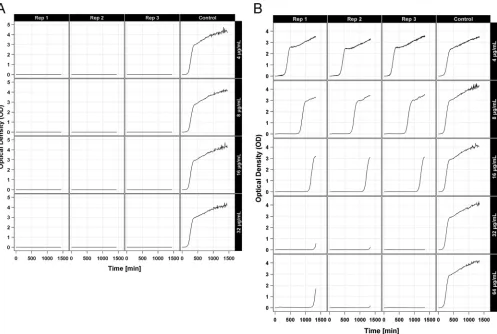
Optical density plots for
E. coli
3267 are shown in
Fig. 1
for
both gentamicin (susceptible) and cefepime (resistant). The
trip-licate growth curves for cefepime at 4
g/ml were identical to the
control with no antimicrobial agent. It should be noted that as the
dose of cefepime increased, the growth curves shifted to the right
until growth was inhibited with a cefepime dose of 32
g/ml. The
triplicate growth curves for all concentrations of gentamicin show
no growth, while the control with no antimicrobial agent showed
rapid growth. The remainder of the optical density plots can be
seen in the supplemental material (see Fig. S3).
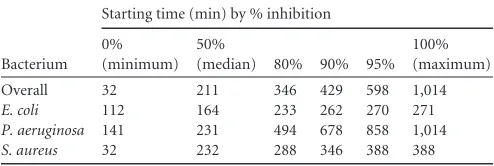
The distribution of time to inhibition for
E. coli
,
P. aeruginosa
,
and
S. aureus
is shown in
Fig. 2
. The minimum time to inhibition
was 32 min for
S. aureus
, and the maximum time to inhibition was
1,014 min for
P. aeruginosa
. Note that 80% of organisms were
inhibited within 346 min (less than 6 h), and 95% of organisms
were inhibited within 598 min (less than 10 h). There was more
variability in the time to inhibition for
P. aeruginosa
with more
than 20% of
P. aeruginosa
organisms inhibited beyond 350 min
(
Fig. 2
and
Table 3
).
DISCUSSION
This study demonstrates proof of principle for the use of
for-ward laser light scatter to rapidly determine MICs for several
bacterial isolates of high clinical importance. Representative
Gram-positive and Gram-negative pathogens, tested against a
va-riety of antimicrobial agents, demonstrated close agreement with
FIG 1Optical density (OD) plots for treated replicates and controls forE. coli3267 with gentamicin (A) and cefepime (B).
FIG 2Distribution of time to inhibition.
on May 16, 2020 by guest
http://jcm.asm.org/
[image:4.585.45.542.65.399.2] [image:4.585.300.544.524.711.2]results achieved by more conventional testing modalities, with 7
categorical errors (all minor errors). Results were obtained for
most organism-drug pairs in less than 6 h. These results suggest
promise for this technology to markedly reduce the time to
sus-ceptibility testing results in the clinical laboratory.
While a fairly stringent metric was used to determine MIC, in
most cases the drop-off at MIC was marked and could be
deter-mined by casual visual inspection of the light scatter curves, or by
using a much more liberally defined cutoff, without affecting
re-sults. However, there were some cases where this was not
ob-served. Moreover, the rapidity of time to result was also not
com-pletely uniform. Although most isolates produced rapid results,
5% required greater than 10 h and rarely up to 12 h.
Pseudomonas
aeruginosa
appeared to take the longest to produce a result, with
one bug-drug combination requiring nearly 17 h to generate a
final MIC. The latter finding may represent a weakness of the
system, in that a potentially significant proportion of isolates may
require read time approaching that of conventional methods.
However, most results easily challenged the longer conventional
MIC turnaround time (TAT). Given that accuracy and
reproduc-ibility were maintained and no read times exceeded those of
con-ventional methods, one could envision using such a system for a
majority of testing and reserving conventional MIC testing for use
as a reflex method.
Several methods for rapid AST have been described in the
lit-erature (
22–25
). Those in clinical use are primarily genotypic and
sensitive and offer a rapid TAT. However, correlation between
genotype and phenotype is imperfect, and as genotypic
mecha-nisms of resistance continue to rapidly evolve, it is difficult for
manufacturers to keep pace with new assays. Moreover, such
mo-dalities target relatively few genes in a well-defined subset of
bac-teria for which clear genotypic mechanisms are responsible for a
large number of cases of clinically significant antibiotic resistance.
Therefore, it remains unlikely that even a majority of
bacterium-drug-mechanism combinations can be detected through clinical
genotypic tests. On the other hand, rapid phenotypic tests have
been increasingly seen as having the potential to decrease TAT
while not compromising sensitivity of resistance detection or
clin-ical correlation. FLLS is one of the newest entries in this field, and
the data here suggest that this technology will prove to be a flexible
and accurate alternative to broth microdilution or other
tradi-tional methods.
This pilot study was limited by the narrow selection of bacteria
and antibiotics used and the fact that only a few clinical strains of
each bacterial species were included in the testing. Further studies
with a broader range of bacterial strains, antimicrobials, and
previously defined genotypes will be necessary to assess the
appli-cability of this method, relative error rates, and the potential
ad-vantage in TAT. Unlike some methods, this technique is not
in-herently limited by the number of optical channels, the
production and validation of specific probes, or the definition of
proteomic profiles or other surrogate markers of metabolism or
growth. It may well be amenable to improving the speed of MIC
for determination in a wide variety of clinical settings. This would
include routine Gram-positive and -negative isolates as well as
even more challenging bacteria, such as nontuberculous
myco-bacteria (NTM).
We used AUC metrics to quantitatively characterize the
ob-served growth patterns in this study. Future research that explores
the utility of other quantitative metrics of the growth patterns may
yield algorithms for calling resistance or sensitivity that improve
clinical performance. A practical limitation of the AUC metric is
that it cannot be computed until after the entire series has been
acquired. A more practical metric for real-time utilization may be
the time until the OD measurements exceed a specific threshold.
Future research should seek to determine the best threshold value.
The speed and accuracy of this innovative system holds great
potential for clinical use in expediting AST results, improving the
choice of appropriate antimicrobial treatment, and supporting
antibiotic stewardship. Findings reported in this study suggest a
broader evaluation of clinical isolates and antimicrobials to
fur-ther explore the correlation between current methods of MIC
de-termination and rapid phenotypic testing by FFLS. In addition,
clinical outcome studies will be critical to demonstrate the
poten-tial clinical impact of such methods on clinical decision making,
resource utilization, and clinical outcome.
ACKNOWLEDGMENTS
We thank BacterioScan, Inc. (St. Louis, MO), for providing instrumenta-tion and reagents for this study.
This work was supported in part by ALSAC.
We also thank the clinical and molecular staff of the Microbiology Department at Diagnostic Laboratory Services, Inc. (The Queen’s Medi-cal Center), for their superior techniMedi-cal support.
REFERENCES
1.Ibrahim EH, Sherman G, Ward S, Fraser VJ, Kollef MH.2000. The influence of inadequate antimicrobial treatment of bloodstream
infec-tions on patient outcomes in the ICU setting. Chest118:146 –155.http:
//dx.doi.org/10.1378/chest.118.1.146.
2.Kumar A, Roberts D, Wood KE, Light B, Parrillo JE, Sharma S, Suppes R, Feinstein D, Zanotti S, Taiberg L, Gurka D, Kumar A, Cheang M.
2006. Duration of hypotension before initiation of effective antimicrobial therapy is the critical determinant of survival in human septic shock. Crit
Care Med34:1589 –1596.http://dx.doi.org/10.1097/01.CCM.0000217961
.75225.E9.
3.Camins BC, King MD, Wells JB, Googe HL, Patel M, Kourbatova EV, Blumberg HM.2009. Impact of an antimicrobial utilization program on antimicrobial use at a large teaching hospital: a randomized controlled
trial. Infect Control Hosp Epidemiol30:931–938.http://dx.doi.org/10
.1086/605924.
4.Ingram PR, Seet JM, Budgeon CA, Murray R.2012. Point-prevalence study of inappropriate antibiotic use at a tertiary Australian hospital. Int
Med J42:719 –721.http://dx.doi.org/10.1111/j.1445-5994.2012.02809.x.
5.Levin PD, Idrees S, Sprung CL, Weissman C, Weiss Y, Moses AE, Benenson S.2012. Antimicrobial use in the ICU: indications and
accura-cy–an observational trial. J Hosp Med7:672– 678.http://dx.doi.org/10
.1002/jhm.1964.
6.Patel SJ, Oshodi A, Prasad P, Delamora P, Larson E, Zaoutis T, Paul DA, Saiman L.2009. Antibiotic use in neonatal intensive care units and adherence with Centers for Disease Control and Prevention 12 step
cam-paign to prevent antimicrobial resistance. Pediatr Infect Dis J28:1047–
1051.http://dx.doi.org/10.1097/INF.0b013e3181b12484.
[image:5.585.40.287.78.161.2]7.Dellit TH, Owens RC, McGowan JE, Jr, Gerding DN, Weinstein RA, Burke JP, Huskins WC, Paterson DL, Fishman NO, Carpenter CF, TABLE 3Summary of starting times for inhibition (minutes)
Bacterium
Starting time (min) by % inhibition
0% (minimum)
50%
(median) 80% 90% 95%
100% (maximum)
Overall 32 211 346 429 598 1,014
E. coli 112 164 233 262 270 271
P. aeruginosa 141 231 494 678 858 1,014
S. aureus 32 232 288 346 388 388
on May 16, 2020 by guest
http://jcm.asm.org/
Brennan PJ, Billeter M, Hooton TM, Infectious Diseases Society of America, Society for Healthcare Epidemiology of America.2007. Infec-tious Diseases Society of America and the Society for Healthcare Epidemi-ology of America guidelines for developing an institutional program to
enhance antimicrobial stewardship. Clin Infect Dis44:159 –177.http://dx
.doi.org/10.1086/510393.
8.Fridkin S, Baggs J, Fagan R, Magill S, Pollack LA, Malpiedi P, Slayton R, Khader K, Rubin MA, Jones M, Samore MH, Dumyati G, Dodds-Ashley E, Meek J, Yousey-Hindes K, Jernigan J, Shehab N, Herrera R, McDonald CL, Schneider A, Srinivasan A, Centers for Disease Control and Prevention.2014. Vital signs: improving antibiotic use among
hos-pitalized patients. MMWR Morb Mortal Wkly Rep63:194 –200.
9.Alshammari TM, Larrat EP, Morrill HJ, Caffrey AR, Quilliam BJ, LaPlante KL.2014. Risk of hepatotoxicity associated with
fluoroquinolo-nes: a national case-control safety study. Am J Health Syst Pharm71:37–
43.http://dx.doi.org/10.2146/ajhp130165.
10. Boggs SR, Cunnion KM, Raafat RH.2011. Ceftriaxone-induced hemo-lysis in a child with Lyme arthritis: a case for antimicrobial stewardship.
Pediatrics128:e1289 –1292.http://dx.doi.org/10.1542/peds.2010-1570.
11. Hensgens MP, Goorhuis A, Dekkers OM, Kuijper EJ.2012. Time inter-val of increased risk for Clostridium difficile infection after exposure to
antibiotics. J Antimicrob Chemother 67:742–748. http://dx.doi.org/10
.1093/jac/dkr508.
12. Lapi F, Wilchesky M, Kezouh A, Benisty JI, Ernst P, Suissa S. 2012. Fluoroquinolones and the risk of serious arrhythmia: a population-based
study. Clin Infect Dis55:1457–1465.http://dx.doi.org/10.1093/cid/cis664.
13. Kerremans JJ, Verboom P, Stijnen T, Hakkaart-van Roijen L, Goessens W, Verbrugh HA, Vos MC.2008. Rapid identification and antimicrobial susceptibility testing reduce antibiotic use and accelerate
pathogen-directed antibiotic use. J Antimicrob Chemother61:428 – 435.
14. Machen A, Drake T, Wang YF.2014. Same day identification and full panel antimicrobial susceptibility testing of bacteria from positive blood culture bottles made possible by a combined lysis-filtration method with MALDI-TOF VITEK mass spectrometry and the VITEK2 system. PLoS
One9:e87870.http://dx.doi.org/10.1371/journal.pone.0087870.
15. Wang XP, Ginocchio CC.2009. Automation of the BD GeneOhm me-thicillin-resistant Staphylococcus aureus assay for high-throughput
screening of nasal swab specimens. J Clin Microbiol47:1546 –1548.http:
//dx.doi.org/10.1128/JCM.00114-09.
16. Paule SM, Hacek DM, Kufner B, Truchon K, Thomson RB, Jr, Kaul KL, Robicsek A, Peterson LR.2007. Performance of the BD GeneOhm me-thicillin-resistant Staphylococcus aureus test before and during
high-volume clinical use. J Clin Microbiol45:2993–2998.http://dx.doi.org/10
.1128/JCM.00670-07.
17. Grobner S, Dion M, Plante M, Kempf VA.2009. Evaluation of the BD GeneOhm StaphSR assay for detection of methicillin-resistant and meth-icillin-susceptible Staphylococcus aureus isolates from spiked positive
blood culture bottles. J Clin Microbiol47:1689 –1694.http://dx.doi.org
/10.1128/JCM.02179-08.
18. Deresinski S.2011. Missing mec. Clin Infect Dis53:iii–iv.http://dx.doi .org/10.1093/cid/cir648.
19. Davey DD, Neal MH, Wilbur DC, Colgan TJ, Styer PE, Mody DR.2004. Bethesda 2001 implementation and reporting rates: 2003 practices of par-ticipants in the College of American Pathologists Interlaboratory
Com-parison Program in Cervicovaginal Cytology. Arch Pathol Lab Med128:
1224 –1229.
20. Davey P, Brown E, Charani E, Fenelon L, Gould IM, Holmes A, Ramsay CR, Wiffen PJ, Wilcox M. 2013. Interventions to improve antibiotic prescribing practices for hospital inpatients. Cochrane Database Syst Rev
4:CD003543.
21. Malani AN, Richards PG, Kapila S, Otto MH, Czerwinski J, Singal B.
2013. Clinical and economic outcomes from a community hospital’s
an-timicrobial stewardship program. Am J Infect Control41:145–148.http:
//dx.doi.org/10.1016/j.ajic.2012.02.021.
22. van Belkum A, Dunne WM, Jr.2013. Next-generation antimicrobial
susceptibility testing. J Clin Microbiol51:2018 –2024.http://dx.doi.org/10
.1128/JCM.00313-13.
23. Pulido MR, Garcia-Quintanilla M, Martin-Pena R, Cisneros JM, Mc-Connell MJ.2013. Progress on the development of rapid methods for
antimicrobial susceptibility testing. J Antimicrob Chemother68:2710 –
2717.http://dx.doi.org/10.1093/jac/dkt253.
24. Huang TH, Ning X, Wang X, Murthy N, Tzeng YL, Dickson RM.2015. Rapid cytometric antibiotic susceptibility testing utilizing adaptive
multi-dimensional statistical metrics. Anal Chem87:1941–1949.http://dx.doi
.org/10.1021/ac504241x.
25. Mohan R, Mukherjee A, Sevgen SE, Sanpitakseree C, Lee J, Schroeder CM, Kenis PJ.2013. A multiplexed microfluidic platform for rapid
anti-biotic susceptibility testing. Biosens Bioelectron49:118 –125.http://dx
.doi.org/10.1016/j.bios.2013.04.046.
26. CLSI.2008. Development of in vitro susceptibility testing criteria and quality control parameters; approved guideline, 3rd ed. CLSI document M23-A3. Clinical and Laboratory Standards Institute, Wayne, PA. 27. CLSI.2016. Performance standards for antimicrobial susceptibility
test-ing; twenty-fourth informational supplement. CLSI document M100-S26. Clinical and Laboratory Standards Institute, Wayne, PA.
28. Murray J, Evans P, Hukins DW. 1980. Light-scattering methods for
antibiotic sensitivity tests. J Clin Pathol33:995–1001.http://dx.doi.org/10
.1136/jcp.33.10.995.
29. Conville PS, Witebsky FG, MacLowry JD.1994. Antimicrobial suscep-tibilities of mycobacteria as determined by differential light scattering and correlation with results from multiple reference laboratories. J Clin
Mi-crobiol32:1554 –1559.
30. Berkman RM, Wyatt PJ, Phillips DT.1970. Rapid detection of penicillin
sensitivity in Staphylococcus aureus. Nature228:458 – 460.http://dx.doi
.org/10.1038/228458a0.
31. Minton AP.2016. Recent applications of light scattering measurement in
the biological and biopharmaceutical sciences. Anal Biochem501:4 –22.
http://dx.doi.org/10.1016/j.ab.2016.02.007.