6
I
January 2018
310
©IJRASET (UGC Approved Journal): All Rights are Reserved
"Technical and Economic Comparison between
Absorption Processes and Membranes for Carbon
Dioxide Removal of Associated Gas for Electricity
Generation in an Oil Field"
Gonzalo Chiriboga1, Diego E Montesdeoca2, Ghem Carvajal C3, Katherine Navarro4 1, 2, 3, 4,
Central University of Ecuador – Chemical Engineering Faculty. Ritter s/n and Bolivia Ciudad Universitaria, Quito – Ecuador
Abstract: The technical and economic comparison between the processes of absorption with amines and by membranes was carried out in order to remove the CO2 presented in the associated natural gas from oil block 49. This project is located in the
northeast of Ecuador.
Using the historical information of flows and compositions of the associated gas from the Tena basal reservoir, a statistical model was designed to forecast these variables until the year 2021. With this information, the processes were designed and the equipment was dimensioned for the two options, with amines (diethanolamine, DEA) and with ethyl cellulose membranes. The validation of the calculations was carried out by simulation in computerized packages specialized in the oil industry. The operational and investment costs were determined and the Leveled Cost of Electricity (LCOE) was calculated for the two technologies and finally its value was compared with the cost of the electricity supplied by the utility grid.
It is concluded that with the two options it is possible to meet the energy requirement of the well and its operation facilities. However, the best option is the treatment with membranes because the results of the technical analysis indicate that this process generates a greater CO2 removal. In the same way, the results of the economic analysis reflected a lower cost with the treatment
of membranes.
Keywords: CO2 Removal/ Associated Gas/ Absorption DEA / Membrane Separation / LCOE / Ecuador Oil Field
I. INTRODUCTION
Ecuador has a large oil area that is divided into blocks. Block 49 is located northeast of the province of Sucumbíos[1], on the border with Colombia. The total energy demand for the development of its activities and operations is estimated around 10 MW per day, this demand is completely covered by self-generation, for which it uses generators (CATERPILLAR G3304-G3306) that work with associated gas.
In general, the gas produced in most of the northeast of Ecuador is associated gas, which accompanies the crude oil extracted from the wells. This sort of gas is constituted by a mixture of hydrocarbons such as ethane, propane, butane, naphtha and acid gases such as CO2 and H2S[2]. In recent years, the percentage of wells producing this gas has decreased due to the decline of the exploitation of
the wells and activities such as reinjection for secondary recovery.
The process of sweetening the associated gas refers to the elimination of acid gases, whose presence in conjunction with water produces corrosive effects and decreases the calorific value of the gas[3]. The sweetening is necessary because it allows the gas to enter the generators under favorable technical conditions.
The electricity generation in block 49 is carried out using associated gas that should meet physicochemical characteristics of calorific value and composition according to the equipment specifications. However, currently the gas does not receive any kind of pre-treatment and therefore, operational and technical issues can occur[4].
The objective of this project is to analyze the technical aspects of sweetening processes focused on CO2 reduction, for which
technics like chemical absorption and separation by membranes will be assessed by verifying the variation of the quantity and composition of the gas as a function of time.
311
©IJRASET (UGC Approved Journal): All Rights are Reserved
II. METHODOLOGY
The analysis is based on the comparison of two techniques that can lead to the effective sweetening of the associated gas that will be used in the electric generators. An analysis will be carried out focused on a baseline of the current gas situation and the physicochemical specifications that it must meet to operate the generator. The sizing of the equipment will be calculated according to the necessary operating specifications and its operation will be simulated with professional packages specialized in the oil industry.
III.CHARACTERIZATIONOFPHYSICOCHEMICALPROPERTIESOFGAS
The associated gas has the advantage of being a clean fuel compared to oil derivatives[6]. The actual composition of a mixture of natural gas is determined through chromatographic analysis, these analysis results in the composition and the percentage of each of the components usually present in the gas as well as other substances that deserve special attention because they can cause problems in the operations, handling, treatment and industrial processing of the gas. The main components that cause acidity are: hydrogen sulphide (H2S), carbon monoxide (CO) and carbon dioxide (CO2) and if the gas is going to be used as fuel for reboilers, heaters,
compression motors or generators, up to 10 grains of H2S / 100 PCN can be accepted [7].
Gas sweetening processes consist of removing part of or all impurities that affect the gas performance, according to the content of impurities, three process are possible: removal only of CO2 / H2S, simultaneous, removal of CO2 and H2S and selective removal of
H2S with the presence of CO2[8]. This project only focuses on the sweetening of associated gas based on the removal of carbon
dioxide, for which it has been considered separation by membranes and chemical absorption.
Block 49, also called Campo Bermejo, is operated by the multinational Tecpetrol since 1999. It is responsible for its exploration and operation in an integral manner: technical, economic and administrative operations. As a first point, the quality of the gas produced in the sub-saturated reservoirs "Basal Tena (BT)" and "Hollín (H)" of block 49 must be analyzed. BT is a reservoir that contains and produces associated gas with very good characteristics such as good calorific properties and with negligible amounts of impurities (acid gases), the disadvantage in this reservoir is its declination of sweet gas with respect to the time, on the other hand is the reservoir H that contains and produces gas of poor calorific properties, due to its high content of CO2 and its high variability, which
leads to a defective performance combustion.
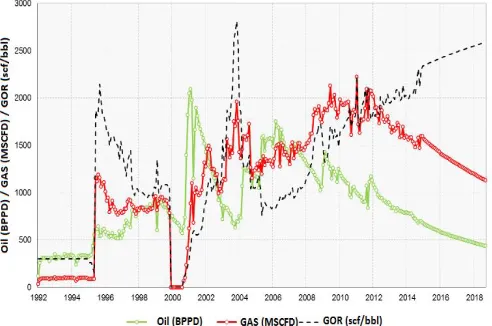
[image:3.612.189.435.406.569.2]Fig. 1 Variation of oil and gas content of the well throughout the exploitation process
Fig. 1 shows a steady decline in the production of gas and oil for the Basal Tena reservoir from 2010 until the end of 2017 and an extrapolation of the same trend for 2018. The GOR is the oil-gas ratio and is given by the associated gas flow produced by each barrel of oil from a producing well under conditions of pressure and given temperature
In the same figure the trend of GOR indicates the reduction of gas in the well and consequently the scarcity of fuel to run the generators in future; therefore, it is compulsory to design a system that allows to harness the acid gas by mean of sweetening. The main objective of the gas treatment is to ensure a low content of CO2 and a high value of calorific power, which means that the gas
312
©IJRASET (UGC Approved Journal): All Rights are Reserved
The gas composition of the analyzed wells comes from the Basal Tena reservoir, the concentrations of carbon dioxide and hydrogen sulphide of the gas are determined by chromatography analyses of the last 10 years in which an increase in CO2 is evidenced, and
this is due to the secondary recovery projects that have been implemented in the well.
TABLEI
METHANE CONTENT BY MEANS OF CHROMATOGRAPHY AND LINEAR REGRESSION
Date % molar CH4
Chromatography
% molar CH4
Linear Regression
% Error
Apr-07 55,78 50,71 10%
Jul-07 47,18 50,62 -7%
Nov-07 49,09 50,51 -3%
Jan-08 52,16 50,44 3%
May-08 56,71 50,23 13%
Nov-08 56,49 50,05 13%
Jan-09 50,77 50,03 1%
May-09 51,75 49,82 4%
Jul-09 50,03 49,84 0%
Dec-09 46,12 49,61 -7%
Mar-10 44,07 49,49 -11%
Jul-10 42,91 49,42 -13%
Mar-11 48,18 49,16 -2%
Jul-11 48,9 48,97 0%
Sep-11 44,41 48,94 -9%
Oct-11 47,32 48,83 -3%
Feb-12 46,27 48,71 -5%
Feb-14 45,54 47,93 -5%
Aug-15 51,89 47,32 10%
Apr-16 52,04 47,05 11%
TABLE I shows how the presence of methane is decreasing during time, according to the chromatography analysis. The data obtained in chromatography are utilized for creating a trend line to forecast the methane content of the gas until 2021, this is the date until when the well will be exploited by Tecpetrol.
TABLEII
CARBON DIOXIDE CONTENT BY MEANS OF CHROMATOGRAPHY AND LINEAR REGRESSION
Date % molar CO2
Chromatography
% molar CO2
Linear Regression
% Error
Jul-09 28,87 25,17 15%
Dec-09 33,7 25,68 31%
Mar-10 34,78 26,04 34%
Jul-10 36,8 26,46 39%
313
©IJRASET (UGC Approved Journal): All Rights are Reserved
Jul-11 32,71 27,84 17%
Sep-11 32,08 28,05 14%
Oct-11 34,93 28,15 24%
Feb-12 35,91 28,52 26%
Feb-14 38,85 31,14 25%
Aug-15 37,07 33,01 12%
[image:5.612.189.426.75.190.2]Apr-16 36,72 33,8 9%
TABLE II shows how the presence of carbon dioxide is increasing during time, according to the chromatography analysis. As for methane, the chromatography data are utilized for creating a trend line to forecast the CO2 content of the gas until 2021.
A. Quantification of the Components of the Gas Mixture
The Amagat´s Law of additive volumes is applied.
Where
Fi = Individual volumetric flow
FT = Total volumetric flow
B. Molecular Weight of Gas Mixture
Where
xi = Volumetric Fraction
MWi = Molecular weight of each component
C. Calculation of the Density of the Gas Mixture
To calculate the density of a real gas, it is necessary to know the compressibility factor, for which Kay's rule is applied, which consists in treating the mixture of real gases as a pseudo-pure substance. That is to say, a substance that is not pure can be treated as such with certain conditions; in this way, critical properties (called pseudo-critical properties) can be defined for each mixture based on the critical properties of the components[8]. As this is an associated gas and contains contaminants (CO2 and H2S), the Wichert
and Aziz correction (adjustment factor) must be used to calculate the pseudo-critical pressure and temperature[9].
Where
Ɛ = Adjustment factor, °R.
In the chromatographic data it is shown that the gas does not contain H2S, therefore only carbon dioxide is considered for this correction and for the rest of the calculations.
D. Pseudo- Critical Temperature
Where
T´scM = Pseudo-critical temperature
Tci = Critical temperature of component i. ° R
314
©IJRASET (UGC Approved Journal): All Rights are Reserved
Where
P´scM = Pseudo-critical pressure
Once the values of the pseudo critical variables are obtained, the value of the reduced variables is determined
F. Pseudo-reduced Variables
Where Tr and Pr are the pseudo-reduced variables of temperature and pressure, respectively. From the graph of Standing and Katz
the value of the compressibility factor z can be obtained. Finally the density is determined
Where
P = Operation pressure [PSI] MW = Molecular weight [lb/lb-mol] R = Ideal gases constant [PSI ft3 / lb-mol °R.]
z = Compressibility factor T = Operation Temperature, [°R]
IV.DESIGNOFTHEASSOCIATEDGASSWEETENINGSYSTEMBYMEANSOFCHEMICALABSORPTION
Operating pressures and temperatures are determined through logarithmic means of the flows that commute the total flow of the gas. Finally, an estimate of the mass with the density previously obtained, especially for the amount of carbon dioxide, is carried out in order to design the absorption tower. In these sense, the starting values for design are: design pressure: 89.76 PSI, design Temperature: 544.7 oR and total Flow: 486.000 [lbm/day]
A. Sizing of the Absorption Tower
The solvent used will be DEA (Diethanolamine)[10], a secondary amine that will be used in a solution of 27% by weight, since it meets the necessary characteristics of CO2 removal and also in a range of 25 to 30% by weight, avoids corrosion problems. The DEA absorption is about 0.33 moles of acid gas per mole of DEA (3.8-5.0 ft³ of acid gas / gallon of amine). To estimate the recirculation ratio of the amine we will use the Jones & Pearce equation.
Where
GPM = Gallons per minute of DEA Q = Acid gas flow to be sweetened [MMSCFD] y = Total concentration of CO2 and H2S in the gas [% molar].
x = Concentration of DEA [% peso]
315
[image:7.612.196.418.460.647.2]©IJRASET (UGC Approved Journal): All Rights are Reserved
Fig. 2 Chart of DEA – Carbon Dioxide equilibrium. Source: ARTHUR L. Absorption and Stripping, Program Manager, Rocketdyne Division Rockwell International. California.
The DEA-CO2 equilibrium data were obtained from the figure, which must be used in the molar ratios and to obtain the final equilibrium curve
TABLEIII
INLET AND OUTLET CONDITIONS OF ASSOCIATED GAS
Variable Value
Gas flow [MSCFD] 900
Temperature [°F] 85
Pressure [PSI] 90
Molecular Weight CO2 [lb/lb-mol] 44
Molecular Weight DEA [lb/lb-mol] 105.14
y1 [%molar CO2 inlet - gas] 0,4
y2 [%molar CO2 outlet - gas] 0,14
x2 [%molar CO2 inlet - liquid] 0
Molecular Weight [lb/lb-mol] 29,3
Density of gas [lb/pie3] 0,54
Density of liquid [lb/pie3] 62,21
Viscosity of DEA [cP] 380
316
©IJRASET (UGC Approved Journal): All Rights are Reserved
Where
Xi = Molar ratio liquid phase Yi = Molar ratio gas phase xi = molar ratio liquid phase yi = Molar ratio gas phase
TABLEIV
MOLAR RATIOS FOR DESIGNING
Molar ratios Molar fractions
Bottom Y1 0.67 y1 0,40
Head Y2 0.16 y2 0,14
Bottom X1 0.71 x1 0,42
Head X2 0 x2 0
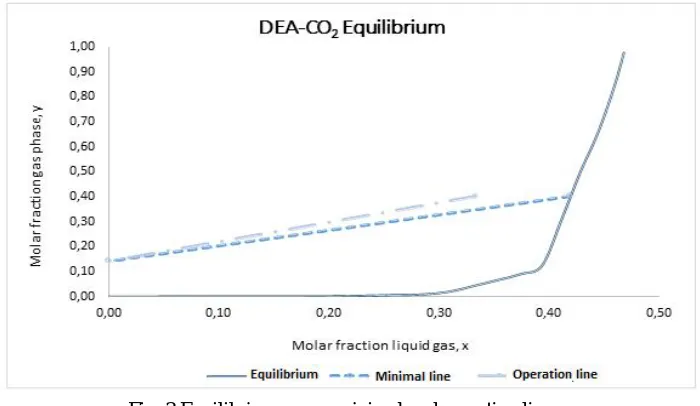
[image:8.612.136.486.301.504.2]The data in the table are used to construct the balance curve and the minimum operating states of the tower
Fig. 3 Equilibrium curve, minimal and operation line
From Fig. 3 the minimal ratio solvent / gas can be obtained 0,62 in the same way the ratio solvent / gas of operation 0,78 assuming a correction factor of 1,25. The concentration of the outlet in liquid phase is determined x1 = 0,33.
TABLEV
FLOW AND PROPERTIES OF THE GAS AND LIQUID ENTERING AND LEAVING THE PROCESS
Variable / Property Gas inlet Gas outlet Liquid inlet Liquid outlet
Molar concentration of CO2 0,40 0,14 0 0,33
Molar ratio 0,67 0,16 0,21
Volumetric flow [ft3/h] 37500 26162 254,16 382,26
Molecular weight [lb/lb-mol] 29,30 37,38 36,30 36,30
Density [lb/ft3] 0,54 0,54 62,21 62,01
[image:8.612.113.504.589.710.2]317
©IJRASET (UGC Approved Journal): All Rights are Reserved
C. Calculation of Pure Solvent Flow (DEA solution)Where
´G = Mass flow [lb/h] L´= 15810 [lb/h]
D. Calculation of the Abscissa of the Flood Area Diagram
Where
= Gas density
=Liquid density
From the flood chart it is obtained x = 0,073 this chart can be found at Coulson and Rirachdson´s [11]. The filling selected to the tower is Pall rings, whose dimensions are diameter (D) = 0,17 ft, area (a) = 31 ft2/ft3and porosity (ξ3) = 0,96 ft3/ft2.
Gv= Flow per unit area g= Acceleration of gravity uL= Viscosity of the liquid
ξ = Porosity of the filling a= Interfacial area
Solving the equation Gv = 15317 [lb / h ft2], then the flood area is 1,32 ft2 given by the equation:
Operation area is twice the flood area = 2,64 ft2. The tower is considered a cylinder, so from its transversal area the diameter if the towers is obtained 3,37 ft.
E. Calculation of the Height of the Tower
Given the equations of design:
Where
Ḡv = Average gas flow in the tower [lb / h ft2]
KG = Total mass transport coefficient of the gas phase [lb-mol]/[h ft2]
a = Interfacial area of the filling
The calculation of the total mass transfer coefficient KG is reduced to empirical equations that have been determined in previous
investigations. As is the case with the equation determined by Norman WS [12].
Where
KG= Total transport coefficient of the gas phase [lb-mol / h ft2 atm]
a= Specific area of the filling [ft2 / ft3]
μ = Viscosity of the amine [cP]
C = CO2 concentration in the liquid [moles/moles DEA]
D = Diethanolamine (DEA) concentration in the liquid [g mole / liter]. t = Temperature [°F]
318
©IJRASET (UGC Approved Journal): All Rights are Reserved
It is clear that KG times a is equals to 1.277 [lbmol / h ft3 atm] so HOG is 11,99 ft. NOG is calculated from cumulative integral of
1/(1-y)(y-y*); therefore NOG = 3.23. Finally the height of the tower is 38,76 ft.
The column to be designed is a packed or filler column, since this type of column is used for the continuous countercurrent contact of a gas and a liquid in the absorption; the gas enters the distribution space that is below the packed section and rises through the openings in the fill, thus coming into contact with the descending liquid flowing through the same openings. The packing provides an extensive intimate contact area between gas and liquid [13].
F. Energy Balance
TABLE6
REQUIREMENTS OF HEAT EXCHANGERS [14]
Equipment Load BTU/h Area ft2 Requirement hp Actual area ft2
Reboiler 72000 GPM 11,3 GPM 1,698 678
Heat exchanger 45000 GPM 11,25 GPM 1,061 675
Amine cooler 15000 GPM 10,20 GPM 353 612
Reflux condenser
30000 GPM 5,20 GPM 707 312
The requirements of main pump and amine’s booster are given by
TABLEVII
POWER REQUIREMENTS [14]
Main pump, hp GPM psig x
0.00065
3,5
Booster of amine, hp GPM 0.06 3,6
This design requires a container for DEA. Since the recirculation rate of the DEA is 60 GPM, it is necessary to interpolate the values given by GPSA [14] to determine the size of the regeneration equipment.
The height of the regenerator equals 10% more than the height of the absorber tower then
The final dimensions of the system are given next
TABLEVIII
SPECIFICATIONS OF THE SYSTEM –ABSORPTION DEA
Dimensions Supplier tank Reflux accumulation Flash tank
Diameter ft 4,30 3,3 4,27
Height ft 12,8 8,1 12,8
Finally the heat reaction of CO2 = 680 BTU/lbm for the determination of the required heat to eliminate CO2
The self-consumption energy is equal to the sum of the energy required by all the equipment in the treatment plant: 3.2 MWh
V. DESIGNOFAGASSWEETENINGSYSTEMASSOCIATEDWITHMEMBRANES
319
©IJRASET (UGC Approved Journal): All Rights are Reserved
A. Pre-treatmentIn order for the membrane to function properly, it is necessary for the gas to enter it at high pressures and without the presence of liquids, from the chromatographic history we can deduce that there is no water, so a dehydrating unit is not necessary, but if a compressor that raises the pressure[15]
TABLEIX
INLET CONDITIONS IN THE COMPRESSOR
Property Value
Capacity 900
[MSCFD] Inlet pressure (P1abs) 104,7 [psi] Outlet pressure (P2
abs)
764,7 [psi]
Inlet temperature 85 [°F]
The compression ratio should be maintained below 4, since a higher value produces an outlet temperature very high, this could cause failures in the refrigeration system of the compressor. Since the compression ratio found is 7,30 > 4, a 2-stage compressor will be needed[16].
Where n = 2, so the compression ratio is 2,70. To calculate the heat capacity of a gaseous mixture it is necessary to know the composition of the mixture and also the heat capacity of each of its components; the following equation is used [17]
Where
Cpi = Specific heat of component i
xi = Molar fraction of component i
Then the relation k = 1.268 for this gas with its respective composition.
The power of the compressor will be assessed by stages. From the discharge pressure of the first stage Pd = 2.70 * 104.7 = 282.96 psi. Then next equation is applied [18]
Where
z = Compressibility Q = Gas flow T= Inlet temperature
e = Constant of the compressor efficiency k = Constant k of the gas
Pl = Standard pressure Tl = Standard temperature
Pd = Discharge pressure Ps = Suction pressure in each stage
320
©IJRASET (UGC Approved Journal): All Rights are Reserved
The discharge pressure of the second stage corresponds to the pressure at which the gas needs to enter the membrane because, as mentioned, it is advisable to enter at high pressures in this case 750 psi. The same procedure that for first stage is followed and the outcomes are: PHB2 = 62.58 hp and the total power is the summation of power in stage 1 and stage 2: PHPT = 116.14 hp
B. Membrane System Sizing
For the dimensioning of the membrane next input conditions are given
TABLEX
INLET CONDITIONS
Property Value
Feed Pressure [psi] 750
Temperature [°F] 85
Flow [MSCFD] 900
CO2 Content inlet [%
molar]
0,40
CO2 Content outlet [%
molar]
0,14
Membrane Material Ethyl
Cellulose
Width [cm] 2,54 x10⁻³
Permeate pressure [psi g] 20
The values of permeability established for the membrane of ethyl cellulose will be used. The ideal separation factor will depend on the permeability of the components to the membrane [19]:
Where
P´A = Permeability of component A
P´B = Permeability of component B
The calculation of the composition of the permeated substance is given by the equation
The values obtained in next three equations are replaced in Yp,
Where
Ph= Feed pressure
Pl= Permeate solution pressure xo= Desired composition
xf = Feed composition
θ= Feed permeate fraction
321
©IJRASET (UGC Approved Journal): All Rights are Reserved
Where ƫ is the membrane´s width. Finally the area corresponds to 1,11x10⁻⁴ m2
VI.TECHNICALANDECONOMICANALYSIS
After having analyzed the technical parameters prior to implementing an associated gas treatment system, it is necessary to determine the profitability of the project through an economic study; the same one that consists of analyzing the costs that the treatment plant will have, the new surface facilities and the operation of these facilities, which allows to establish an estimated amount of the investment and its profitability[20].
To carry out the economic analysis, information provided by the planning and development department of Tecpetrol was used; in which the range of variation of the calculations (investment costs and operating costs) is ± 30% because it is the conceptualization stage[21], so the results are preliminary.
A. Estimation of Costs for the System with Diethanolamine DEA
TABLEXI
UNITS AND EQUIPMENT AND COST IN LOCAL MARKET ECUADOR
Unit Cost $1
Absorption tower 188017,60
Regeneration tower 243250,00
Reboiler 189985,25
Amine exchanger rich /
poor 165763,65
Amine cooler 139546,50
Reflux condenser 108963,85
Main pump 23056,30
Booster pump 23265,35
Supply tank 69803,00
Reflux accumulator 48480,00
Flash tank 72083,00
Total 1272934,50
The most common way to carry out the associated gas sweetening process is through the use of solvents, alkanolamines are the solvents of greatest use and acceptance in this process of CO2 and H2S removal, so that within a gas sweetening plant it is important to know the expense of amine consumption[21]; for this project the calculation will be made based on the price per pound of diethanolamine DEA set at $ 0,52 2. It is determined the DEA pounds needed to remove the concentration of CO2 present in the
incoming gas stream lb DEA = 52.488 lb /day
The cost of DEA is determined
For this project, the relationship estimate was used, which is based on cost data from plants of similar type with an accuracy of ± 30% [22]
Information provided by Tecpetrol Engineering Project Department Equipment Division
322
©IJRASET (UGC Approved Journal): All Rights are Reserved
TABLEXII
TOTAL COST OF CO2 REMOVAL BY DIETHANOLAMINE DEA
Item Investment range % Cost [$]
Total cost of equipment 30-50 % 45% 1272934,50
Installation 6-14 % 12% 152752,14
Instrumentation and control
2-8 % 6% 76376,07
Piping 3-20 % 15% 190940,18
Electric component 2-10 % 8% 101834,76
Surface preparation 2-5 % 3% 38188,04
Engineering and supervision 10% 127293,45
Construction 7% 89105,42
Unexpected values 5% 63646,73
TOTAL 2113071,27
B. Estimation of Costs for the System with Ethyl Cellulose Membrane
TABLEXIII
UNITS AND EQUIPMENT AND COST IN LOCAL MARKET ECUADOR
Unit Cost $
Compressor 487800,50
Separator 58860,50
Membrane 575950,00
Total 1122611,00
TABLEXIV
TOTAL COST OF CO2REMOVAL BY MEMBRANES
Item Investment range % Cost [$]
Total cost of equipment 30-50 % 45% 1122611,00
Installation 6-14 % 12% 134713,32
Instrumentation and control 2-8 % 6% 67356,66
Piping 3-20 % 15% 168391,65
Electric component 2-10 % 8% 89808,88
Surface preparation 2-5 % 3% 33678,33
Engineering and supervision 10% 112261,1
Construction 7% 78582,77
Unexpected 5% 56130,55
TOTAL $ 1863534,26
C. Economic Analysis for Comparing both Technologies
323
©IJRASET (UGC Approved Journal): All Rights are Reserved
flow must be built it should contains incomes, outcomes depreciations and the discount rate established be the company in this sort of projects.
It has been established that the economic limit for a project of this nature is approximately 5 years; time that the oil company's contract lasts with the Ecuadorian state, taking into account that it can be extended provided that the quality of the gas has not undergone a sudden change; However, to calculate the depreciation, a value of 20 years was taken, which is what the EPRI report suggests[23]. The regulations established by the Hydrocarbons Regulation and Control Agency (ARCH) must be taken into account, it establishes the payment for use of natural or associated gas in operations of exploitation, transportation and burning [24] this value is included as fuel cost.
oreover, in the present project, the cost of production refers to the capital that must be invested in the gas treatment once the project has been put into operation: fixed costs, variables costs, fuel cost and depreciation.
TABLEXV
OPERATIONAL COST OF ABSORPTION AND MEMBRANE SEPARATIONS
Type of Cost Cost $ DEA Cost $ Membranes
Fixed Costs $ 79490,00 $ 79490,00
Variable Costs $ 254891,00 $ 143400,90
Fuel Costs $ 3000,00 $ 3000,00
Depreciation $ 105653,56 $ 93176,71
TOTAL $ 443034,76 $ 319067,61
The income that will be generated in this project is equivalent to the energy produced with the treated gas, taking into account the utility price for the industrial zone: 0.093 $ / kWh for 2017[25]. In addition, the average caloric power of the gas from each of the alternatives found in the simulation and efficiencies of the electric generators used in block 49 is estimated in order to calculate a real energy production.
TABLEXVI
ANNUAL INCOME
Description Absorption
DEA
Membranes separation
Calorific value [BTU/lb-mol] 341000 400800
Turbine Efficiency 35% 35%
Electricity generated [kW-h] 17149761,12 17844269,82
Generator efficiency 90% 90%
Energy per year [kW-h] 15434785,00 16059842,84
Utility Electricity Price
[$/kW-h] 0,093 0,093
Income [$] 1435435,01 1493565,38
The criterion used to evaluate the economic advantage of one technology over the other is LCOE, which includes all the major components of a cash flow. Finally, the LCOE value of each technology will be compared with the objective of determining the most convenient option. It should be noted that the LCOE includes in its flow important components such as operating costs, fuel, depreciation and the cost of the plant, which makes it an integrated and highly reliable tool[26].
324
©IJRASET (UGC Approved Journal): All Rights are Reserved
Where
It = Investment expenditures in year t (including financing) Mt = Operations and maintenance expenditures in year t
Ft = Fuel expenditures in year t Et = Electricity generation in year t
r = Discount rate n = Life of the system
TABLEXVII
LCOECALCULATIONS AND RESULTS
Description Unit
DEA Absorption Data
Membrane separation Data
Plant Capacity MW-h 2,8 2,91
Capacity factor % 80,00% 80,00%
Fixed costs $ 79490 79490
Variables costs $ 254891,2 143400,9
Calorific value Btu/h 6900 6900
Fuel costs $ 947761,92 984995,42
Plant cost $ 1272934,5 1112611
Total cost of plant $ 2113071,27 1863534,26
Discount rate % 12,00% 12,00%
Depreciation $ 63646,73 55630,55
Production hours per
year MWh-y 19622,4 20393,28
Cash flow $ 840136,77 750923,26
LCOE $/MWh 77,13 69,25
The LCOE is a very easy tool to interpret, so the technology with the lowest value represents the most likely option. It is also inferred that the production of electricity by means of the combustion of the associated gas is cheaper than buying electricity from the utility 93$/MWh, therefore, it is convenient the self-generation of electricity in the field
VII. RESULTSANDSIMULATIONS
325
[image:17.612.109.517.290.402.2]©IJRASET (UGC Approved Journal): All Rights are Reserved
Fig. 4 Chemical absorption of CO2 simulation in Hysys
The simulator indicates that the system will deliver a natural gas with a CO2 content of 7.5% with the conditions and equipment calculated, which is very acceptable considering that the model was designed to reach 14% of CO2 content
Fig. 5 Removal of CO2 by means of membranes in Hysys
In this case, the operation performed by the separation by means of membranes with the components and starting data established in the calculations is simulated. The results indicate that through this technique the well would be producing a gas associated with less than 3% of CO2 content.
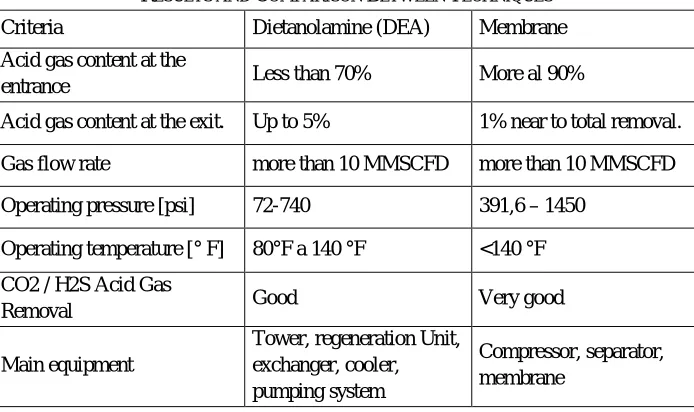
The following table contains the most important results that allow concluding in an objective way about the most viable option and the advantages that one technique can present versus another in the removal of CO2 in the associated gases of petroleum.
TABLEXVIII
RESULTS AND COMPARISON BETWEEN TECHNIQUES
Criteria Dietanolamine (DEA) Membrane
Acid gas content at the
entrance Less than 70% More al 90%
Acid gas content at the exit. Up to 5% 1% near to total removal.
Gas flow rate more than 10 MMSCFD more than 10 MMSCFD
Operating pressure [psi] 72-740 391,6 – 1450
Operating temperature [° F] 80°F a 140 °F <140 °F
CO2 / H2S Acid Gas
Removal Good Very good
Main equipment
Tower, regeneration Unit, exchanger, cooler, pumping system
[image:17.612.133.480.533.739.2]326
©IJRASET (UGC Approved Journal): All Rights are Reserved
Materials Stainless Steel / Carbon
Steel
Stainless steel / Ethyl cellulose
Required services Heater, power, reactive Power, compressor
Type of operation Complex Simple
Investment costs High High
Operational costs Medium Medium
VIII. DISCUSSION
The statistical model used for the prediction of the amount of CO2 is based on the establishment of linear correlation. However, the
variability derived from the production conditions due to changes made in the extraction technology (natural flow system, mechanical pumping and electro-submersible pumping) has not been considered, which alters the linearity of the data, an aspect that is reflected in the values of R2. This particularity led to take as starting point the most pessimistic scenario for all calculations in the design.
Regarding the concentration of CO2, the most pessimistic scenario was taken for the sizing of the two processes, that is, an initial
molar concentration of CO2 of 40%. The design of both sweetening systems considered the reduction of the concentration of CO2 in
the associated gas at a level that is within the specifications of the generators.
Since entropy is a state function, the compression cycle was divided into a real part and an ideal part, which ensures a much more reliable compression work consumption value. To perform the calculations of the work of the compressor, the enthalpy deviation factor was used because it is a real gas.
In the process with amines it was considered to use the regenerated solvent for 5 days, which could vary depending on the increase of the environmental temperature, with the consequent evaporation of the solvent, thus varying the operating costs.
Although the gas has the same initial conditions for the two scenarios, the thermodynamic model in the simulator differs from one scenario to another. This is because in the process with DEA the reactions and properties of the amines must be included, so the Amine PKG package was used, while for the membrane process the Peng Robison package was used, which is recommended when it deals with hydrocarbons.
All calculations are projected over an estimate of 5 years, which is currently the duration of the extraction contract by the operating company of block 46. For the depreciation, the recommendation given by the EPRI was taken into account for plants of natural gas (20 years).
IX.CONCLUSION
The chromatographic analyses of recent years determined that the gas belonging to Block 49 is acid because of high content of Co2
(molar percentage of 40%), so it is necessary to carry out a sweetening before using it for electricity generation. The aim is to
complying with the parameters of the generators requirement (maximum% molar CO2 = 17%).
The simulation allows concluding that the membrane removal process has a higher percentage of acid gas removal that means a
better performance, since the outlet gas has a molar percentage of 6% CO2 in the membrane process versus a 10% in the process
with amines.
The results obtained through the conceptual engineering and the Hysys simulator, are similar, which leads to the conclusion that the use of the simulator is suitable for the two sweetening techniques and that the proposal process is reliable.
The absence of heavy liquid hydrocarbons in the gas to be treated, verified through the chromatographic analysis, allows to assure the stability in the operation of the membrane during its useful life, even more if it is considered that the model includes a separator before the entrance of the gas to the membrane, according to safety criteria.
The technical analysis allows concluding that the process with membranes presents greater removal efficiency, moreover it demands less quantity of equipment and less difficulties for its implementation; In addition, the membranes allow to treat a gas with a greater acid content 90%, which ensures the plant's operation despite possible abrupt changes in its composition.
The investment of the process through membranes is approximately two hundred thousand dollars less than the investment in absorption process, the same happens with the operation and maintenance costs.
327
©IJRASET (UGC Approved Journal): All Rights are Reserved
X. ACKNOWLEDGMENT
A special acknowledgment is for Tecpetrol that facilitated our work by supporting the investigation with data and important information in de design stage.
REFERENCES
[1] J. Berk and P. Demarzo, Corporate finance. 2013.
[2] R. Khalilpour and I. A. Karimi, “Evaluation of utilization alternatives for stranded natural gas,” Energy, vol. 40, no. 1, pp. 317–328, 2012.
[3] A. K. Datta and P. K. Sen, “Optimization of membrane unit for removing carbon dioxide from natural gas,” J. Memb. Sci., vol. 283, no. 1–2, pp. 291–300, 2006.
[4] N. Jadidi and E. Rahmandoust, “CO2 Capturing from Industrial Flue Gases,” Am. J. Oil Chem. Technol., vol. 3, no. 2, pp. 34–40, 2015.
[5] M. Vaccarelli, R. Carapellucci, and L. Giordano, “Energy and Economic Analysis of the CO2 Capture from Flue Gas of Combined Cycle Power Plants,” Energy Procedia, vol. 45, pp. 1165–1174, 2014.
[6] A. Elgowainy, J. Han, H. Cai, M. Wang, G. S. Forman, and V. B. Divita, “Energy efficiency and greenhouse gas emission intensity of petroleum products at U.S. Refineries,” Environ. Sci. Technol., vol. 48, no. 13, pp. 7612–7624, 2014.
[7] K. S. Perez, “Propiedades del Gas Natural,” Ingeniería, 2009. [Online]. Available: https://es.slideshare.net/kristiansaltaren/propiedades-del-gas-natural?from_action=save.
[8] G. M. Balza A., Ricaurte M., Nadales D., Viloria A., “Selección de tecnologías de endulzamiento de gas natural en diferentes áreas geográficas de venezuela,” in Planta, 2010.
[9] L. William, Working Guide to Petroleum and Natural Gas Production Engineering, 1st ed. Burlington, MA: Elsevier Inc., 2010.
[10] S. Nii and H. Takeuchi, “Removal of CO2 and/or SO2 from gas streams by a membrane absorption method,” Gas Sep. Purif., vol. 8, no. 2, pp. 107–114, 1994.
[11] C. Richardson, Chemical Engineering Design, no. 6. MA, USA: Elsevier Inc., 2005. [12] S. L. Norman W, “Wet Cooling Towers - Rule-Of-Thumb,” pp. 1–24, 1981.
[13] L. Wkren, M. C. Smith, and P. Harriott, Operaciones Unitarias en la Ingeniería Química. 1991. [14] Processors, “Suppliers Association,” Tulsa, 2004.
[15] D. D. and K. Doshi, “Recent Developments in CO 2 Removal Membrane Technology,” Uop Llp, pp. 1–32, 1999. [16] A. M. Rolt, N. J. Baker, and D. D. E. Uk, “Framework 6 NEWAC Programme,” Framework, pp. 1–10, 2009. [17] H. B. Callen, Thermodyancis and an Introduction to Thermostatistics, Second. Pennsylvania: John Wiley.
[18] S. M. Camporeale, B. Fortunato, and M. Mastrovito, “A Modular Code for Real Time Dynamic Simulation of Gas Turbines in Simulink,” J. Eng. Gas Turbines Power, vol. 128, no. 3, p. 506, 2006.
[19] C. J. Geankoplis, “Procesos de transporte y operaciones unitarias,” CECSA. Univ. Minnesota. Mex., no. 3, p. 1024, 1998.
[20] T. F. Edgar, “Control and operations: When does controllability equal profitability?,” Comput. Chem. Eng., vol. 29, no. 1, pp. 41–49, 2004. [21] C. J. H. Fowler and J. T. Mayes, “Learning relationships from theory to design,” Alt-J, vol. 7, no. 3, pp. 6–16, 1999.
[22] D. W. G. R. H. P. Perry’s, Chemical Engineers’ Handbook, AccessEngi. Ney York: McGraw-Hill Professional, 2008. [23] M. Management, “Descriptions of Past Research (1996–2010),” 2010.
[24] ARCH, “Resolución No. 002-DIRECTORIO-ARCH-2012 Valores por los servicios de Regulación, Control y Administración que presta la Agencia de Regulación y Control Hidrocarburífero.” Quito, 2012.
[25] ARCONEL, “Estadísticas del Sector Eléctrico,” Reportes Estadísitcos, 2017. [Online]. Available: http://www.regulacionelectrica.gob.ec/estadistica-del-sector-electrico/. [Accessed: 17-Jun-2017].