Mycobacterial Species Identification
Danila V. Zimenkov,aElena V. Kulagina,aOlga V. Antonova,aMaria A. Krasnova,bEkaterina N. Chernyaeva,d,e Vyacheslav Y. Zhuravlev,dAlexey V. Kuz’min,cSergey A. Popov,cAlexander S. Zasedatelev,aDmitry A. Gryadunova
Engelhardt Institute of Molecular Biology, Russian Academy of Sciences, Moscow, Russian Federationa
; Moscow Scientific and Clinical Antituberculosis Center, Department of Health of Moscow, Moscow, Russian Federationb
; Research Institute of Phthisiopulmonology, I. M. Sechenov First Moscow State Medical Academy, Moscow, Russian Federationc
; Research Institute of Phthisiopulmonology, St. Petersburg, Russian Federationd
; St. Petersburg State University, St. Petersburg, Russian Federatione
In addition to the obligatory pathogenic species of the
Mycobacterium tuberculosis
complex and
Mycobacterium leprae, the
ge-nus
Mycobacterium
also includes conditionally pathogenic species that in rare cases can lead to the development of
nontubercu-lous mycobacterial diseases. Because tuberculosis and mycobacteriosis have similar clinical signs, the accurate identification of
the causative agent in a clinical microbiology laboratory is important for diagnostic verification and appropriate treatment. This
report describes a low-density hydrogel-based microarray containing oligonucleotide probes based on the species-specific
se-quences of the
gyrB
gene fragment for mycobacterial species identification. The procedure included the amplification of a
352-nucleotide fragment of the gene and its hybridization on a microarray. The triple-species-specific probe design and the
algo-rithm for hybridization profile recognition based on the calculation of Pearson correlation coefficients, followed by the
construction of a profile database, allowed for the reliable and accurate identification of mycobacterial species, including
mixed-DNA samples. The assay was used to evaluate 543 clinical isolates from two regions of Russia, demonstrating its ability to detect
35 mycobacterial species, with 99.8% sensitivity and 100% specificity when using
gyrB, 16S, and internal transcribed spacer (ITS)
fragment sequencing as the standard. The testing of clinical samples showed that the sensitivity of the assay was 89% to 95% for
smear-positive samples and 36% for smear-negative samples. The large number of identified species, the high level of sensitivity,
the ability to detect mycobacteria in clinical samples, and the up-to-date profile database make the assay suitable for use in
rou-tine laboratory practice.
I
n addition to the obligatory pathogenic species of the
Mycobac-terium tuberculosis
complex (MTC) and
Mycobacterium leprae,
the genus
Mycobacterium
also includes conditionally pathogenic
species that in rare cases lead to the development of
nontubercu-lous mycobacterial disorders in humans (
1
). The main risk factors
for such diseases are immunosuppression and chronic obstructive
pulmonary disease (
2
). Because tuberculosis and mycobacteriosis
have common clinical signs, the proper identification of the
caus-ative agent in a clinical microbiology laboratory is one of the most
important tasks for diagnostic verification and treatment with the
correct medication (
3
).
The conventional microbiological and biochemical
meth-ods used to detect
Mycobacterium
are labor-intensive and
time-consuming. Efficient mycobacterial species identification using
high-performance liquid chromatography of mycolic acids (
4
)
re-quires expensive equipment and high-level personnel
qualifica-tions. Moreover, the spectrum of species that can be identified by
microbiological assays is rather narrow, making DNA-based
methods preferable (
5
). A number of molecular genetic
tech-niques have been developed, including
in situ
hybridization
species-specific probes (
6
), multiplex PCR for the detection of
specific genetic determinants (
7
,
8
), direct sequencing (
9–11
),
real-time PCR (
12
), restriction fragment length polymorphisms
(
13
), hybridization of PCR products with immobilized
oligonu-cleotide probes by dot blot (
14
), membrane strips (
15
,
16
), and
microarrays (
17–21
).
The most widely used genomic targets for species identification
are the 16S gene (
9
,
12
,
17
,
22–25
), the 16S-23S internal
tran-scribed spacer (ITS) (
20
), a combination of 16S and ITS (
26
), the
23S rRNA gene (
27
,
28
), the heat shock protein gene
hsp65
(
13
,
29
), and the
rpoB
(
14
),
secA1
(
10
), and
dnaJ1
(
11
) genes. The
gyrB
gene, which encodes the

-subunit of DNA gyrase, is particularly
attractive for this purpose. An analysis of this locus from different
Mycobacterium
species showed that the level of amino acid
se-quence homology varies from 82% to 99% (
30
). Interspecies
vari-ations of
gyrB
have allowed for the identification of
ⱖ
15 species
and the differentiation of species within the MTC and
Mycobacte-rium avium
complex (MAC) (
31
).
Three-dimensional low-density hydrogel microarrays (biochips)
were invented at the Engelhardt Institute of Molecular Biology
(EIMB) in the 1990s (
32
), and a number of tests are currently
imple-mented in clinical diagnostics in Russia and countries of the former
Soviet Union (
33
). In this work, we present the development of a
Received4 September 2014Returned for modification3 November 2014 Accepted12 January 2015
Accepted manuscript posted online21 January 2015
CitationZimenkov DV, Kulagina EV, Antonova OV, Krasnova MA, Chernyaeva EN, Zhuravlev VY, Kuz’min AV, Popov SA, Zasedatelev AS, Gryadunov DA. 2015. Evaluation of a low-density hydrogel microarray technique for mycobacterial species identification. J Clin Microbiol 53:1103–1114.doi:10.1128/JCM.02579-14. Editor:B. A. Forbes
Address correspondence to Danila V. Zimenkov, [email protected].
Supplemental material for this article may be found athttp://dx.doi.org/10.1128
/JCM.02579-14.
Copyright © 2015, American Society for Microbiology. All Rights Reserved.
doi:10.1128/JCM.02579-14
on May 16, 2020 by guest
http://jcm.asm.org/
method for mycobacterial species identification by hybridization
analysis of a
gyrB
gene fragment on a low-density hydrogel
microar-ray with species-specific oligonucleotide probes. This report includes
the results of an evaluation of the assay using clinical isolates obtained
from two regions of Russia, allowing us to estimate the frequencies
and spectrum of nontuberculosis mycobacteria isolated in routine
practice in the laboratories of tuberculosis centers.
MATERIALS AND METHODS
Experiment settings, sample collection, and mycobacterial DNA isola-tion.The initial evaluation of the described method was performed using 20 synthetic DNA fragments corresponding to 18 widely distributed my-cobacterial species (see Table S1 in the supplemental material).
A total of 543 isolates from three different collections were used for testing. Collection I consisted of 44M. tuberculosis, 2Mycobacterium bo-vis, and 291 nontuberculosis isolates obtained from patients at the Mos-cow Scientific and Clinical Antituberculosis Center, MosMos-cow Govern-ment Health DepartGovern-ment (Moscow, Russia). The reference methods for species identification were microbiological and biochemical tests, which were performed as described previously (34).
Collection II contained 98 clinical isolates (4M. tuberculosisand 94 non-tuberculosis) obtained at the Research Institute for Phthisiopulmonology, I.M. Sechenov First Moscow State Medical Academy (Moscow, Russia).
Collection III contained 108 isolates (8M. tuberculosisand 100 non-tuberculosis) obtained at the St. Petersburg Institute of Phthisiopul-monology (St. Petersburg, Russia).
To estimate the analytical sensitivity of the assay using clinical sam-ples, collection IV, which included 61 samples (predominatelyM. tuber-culosis) from various specimens (sputum, biopsy, bronchoalveolar lavage fluid, caseated material, urine, and cavity walls), was used. These speci-mens were obtained from patients (those with primary infections and previously treated) attending the Research Institute for Phthisiopul-monology I.M. Sechenov First Moscow State Medical Academy (Moscow, Russia) between January and March 2014. The clinical samples were di-vided into two parts: one part was used for smear preparation, and the other was used for DNA isolation. Smear grading was performed accord-ing to WHO recommendations (35).
Mycobacteria were isolated by classical bacteriological methods using cultivation on solid LJ medium and an automated Bactec MGIT-960 sys-tem. The BBL MycoPrep reagent (Becton Dickinson, Cockeysville, MD, USA), containingN-acetyl-L-cysteine (NALC) and NaOH, was used to decontaminate the samples, according to the manufacturer’s instructions. The DNA isolation methods varied for different collections: the Proba-NK DNA extraction kit (DNA-Technology Company, Moscow, Russia) was used for collections I, II, and IV, and the automated DNA isolation station based on Freedom EVO Clinical (Tecan Group Ltd., Männedorf, Germany) was used for collection III. The DNA samples were stored at⫺20°C, and the DNA concentrations were determined spectro-photometrically.
The identification of species was performed in parallel by GenoType MycobacteriumCM/AS (Hain Lifescience Gmbh, Nehren, Germany) (36) for collections II and III. Sequencing of thegyrB, 16S, and ITS fragments was used as the standard for species identification.
Genomic DNA samples ofEscherichia coli,Enterococcus faecalis, Staph-ylococcus aureus,Streptococcus oralis, andStreptococcus sanguinisused for the specificity tests were from the EIMB laboratory collection.
Assay design. (i) Selected strains and sequences.Multiple sequence alignments of thegyrBgene fragment (21 total sequences) were made using the BioEdit software (Ibis Therapeutics, Carlsbad, CA). The follow-ingMycobacteriumsequences were used (GenBank accession no.):M. tuberculosisstrain H37Rv (NC_000962),M. bovisstrain BCG Pasteur 1173P2 (AM408590),M. canettiistrain CIPT 140010059 (HE572590),M. marinumstrain MB2 (ANPM01000001),M. intracellularestrain KPM 3101 (AB014188),M. aviumstrain KPM 3012 (AB014189),M. avium strain 104 (NC_008595),M. aviumsubsp. paratuberculosisstrain K10
(NC_002944),M. aviumstrain 10-5581 (AYNT00000000),M. kansasii strain ATCC 12478 (NC_022663), M. gastri strain KPM 3503 (AB014295),M. scrofulaceumstrain KPM 2027(AB014207),M. szulgai strain KPM 2403 (AB014185), M. malmoense strain KPM 3401 (AB014187),M. asiaticumstrain ATCC 25274 (AB014206),M. gordonae strain KPM 2202 (AB014298),M. xenopistrain 3993 (JAOC01000008), M. simiaestrain KPM 1403 (AB014182),M. fortuitumstrain KPM 4003 (AB014199),M. smegmatisstrain MC2 155 (CP000480), andM. chelonae strain ATCC 35752 (GU143883).
(ii) Selection and synthesis of oligonucleotides for immobilization and primers for amplification.The microarray comprised 60 oligonucle-otide probes (13 to 23 nucleoligonucle-otides [nt]) specific to the selectedgyrB se-quences and corresponding to different species and subspecies of the My-cobacteriumgenus. The melting temperatures were calculated, and the secondary structures of the oligonucleotides were estimated with the Oligo analyzer (Integrated DNA Technologies). The lengths of the oligo-nucleotides were adjusted to keep the melting temperature differences within 2 to 3°C. The primers for amplification were selected to flank the highly polymorphic region of thegyrBgene (positions 6332 to 6679, Gen-Bank accession no.NC_000962.2). Three unique oligonucleotide probes were selected for each of the 21 sequences selected, except the probes for MTC: four probes matchedM. tuberculosis, and two probes were used for bothM. bovisandM. canettii. Three groups of probes were predominately located at positions 1248, 1308, and 1344 from thegyrBstart site (see Fig. S1 in the supplemental material).
The oligonucleotides for immobilization on the biochip and the prim-ers for amplification were synthesized and purified as described earlier (37). The molecular masses of the oligonucleotides were measured using a matrix-assisted laser desorption ionization–time of flight (MALDI-TOF) mass spectrometer (Compact MALDI 4; Kratos Analytical, Chestnut Ridge, NY) with sinapinic acid or 2-amino-5-nitropyridine as the matrix. (iii) Synthetic DNA constructs.Synthetic fragments ofgyrBwere re-constructed using PCR with four partially overlapping oligonucleotides (approximately 100 bp) (see Table S1 in the supplemental material). The oligonucleotides Synth-1 and Synth-4, acting as primers, were used at a 1 M concentration. The inner Synth-2 and Synth-3 oligonucleotides were used at a concentration of 33 nM. The PCR mix also contained 1 U of Qiagen HotStarTaq DNA polymerase and 1⫻Qiagen multiplex master-mix (Qiagen GmbH, Germany). The following PCR profile was used: denaturation at 95°C for 4 min, 40 cycles of denaturation at 95°C for 40 s, annealing at 55°C for 40 s, extension at 72°C for 40 s, and a final extension at 72°C for 4 min. A 385-bp-long fragment was purified using the QIAquick gel extraction kit (Qiagen) after amplification. The DNA con-centration was determined using a UV spectrophotometer. In total, 19 isolated fragments in serial dilutions were used as the DNA template for the test, as described below.
PCR amplification.For the amplification of 352-bp fragments of the gyrBgene, asymmetrical PCR was used with the primersgyrB-F (5=-CCG CAGTTCGAGGGCCAGAC-3=) andgyrB-R (5=-CGGMAGKATCGCCT GGAACATC-3=). The 30-l reaction volume contained 15l of Qiagen multiplex PCR master mix (Qiagen), 8M fluorescently labeled dUTP-ImD#49 (Biochip-IMB LLC, Moscow, Russia), 100MgyrB-F and 1 mM gyrB-R primers, and 3l of the DNA sample. The cycling conditions were the same as those described in the previous section.
Biochip manufacture and hybridization.The biochips were manu-factured as described earlier (38). The biochip was composed of 60 mean-ingful elements with immobilized oligonucleotides, three marker cells (M) for accurate positioning (image acquisition) with processing soft-ware, and four elements of empty gel (0) needed to calculate the reference fluorescence intensity (background). The biochip hybridization and anal-ysis of the results using dedicated software (Biochip-IMB LLC, Moscow, Russia) were performed as described previously (38).
Interpretation of the results.A complete series of 60 hybridization signals from microarray elements with immobilized p-1, p-2, . . ., p-60 Zimenkov et al.
on May 16, 2020 by guest
http://jcm.asm.org/
oligonucleotides constituted the hybridization profile for each analyzed sample.
Initially, 20 reference profiles obtained upon hybridization of the syn-thetic fragments (M. canettiiwas not tested) were analyzed. For every fragment, three or more (see Fig. S1 in the supplemental material) probes resulted in perfect hybridization duplexes, and the signals in these ele-ments were maximal. The average value⫾standard deviation for the signal from perfect duplexes for all elements of all reference profiles was calculated as 9.8⫾5.8. Thus, a 4.0-fold intensity difference between meaningful elements of the microarray with the average background sig-nal calculated from the reference gel pads without oligonucleotides al-lowed the identification of strong positive signals in an unknown analyzed profile.
The reference profiles were added to the database integrated in the software as sequential records of the mycobacterial species name and 60 intensity values.
An analysis of the unknown profile began from the identification of the number of positive signals: if the number of elements with positive signals was⬍3, this profile was considered weak and was excluded from further analysis. This rule was introduced to increase the reliability of profile identification. Upon analysis of the clinical strains and samples described in this paper, no profiles with one or two positive signals were found.
For every analyzed sample, a sequential comparison of the profile with the reference profiles from the database was made. A Pearson correlation coefficient was selected as the criterion for the comparison of two profiles, xandy:
r⫽ 60兺(xiyi)⫺兺xiyi
兹
(60兺xi2⫺(兺xi)2) (60兺yi2⫺(兺yi)2)(1)
wherexiandyiare signals of the pad with the p-i oligonucleotide probe
(1ⱕiⱕ60) for two profiles, and 60 is the number of meaningful elements in the microarray (Fig. 1). If therwith the best-matched profile from the database was higher than the threshold value of 0.9, the analyzed sample was considered to belong to the same species as the profile from the data-base. The threshold values have been determined from the analysis of a cross-correlation matrix of reference profiles (see Table S2 in the supple-mental material).
Profiles without significant similarity in the database (r⬍0.9) were grouped with reference profiles, and the cross-correlation matrix was cal-culated and subjected to cluster analysis using Statistica software version 10 (StatSoft, Inc., 2011). The same threshold value (0.9) was used for cluster recognition.
The samples with profiles of the same cluster were proposed to match the species (or subspecies) with thegyrBsequence that differed from the reference strains. Such samples were analyzed by sequencing three genomic loci to determine the species corresponding to the cluster (see Table S3 in the sup-plemental material). The representative profile of the cluster was added to the reference database to allow further recognition of similar profiles. The accu-racy of the threshold value was confirmed by a cross-correlation matrix of all representative profiles obtained in this work (see Table S4 in the supplemental material).
For the analysis of the profiles obtained from the mixture of two genomic DNA samples from different mycobacterial species, the follow-ing algorithm was used. If thervalue of this profile with the best-matched reference profile was in the range of 0.5 to 0.9, additional analysis of the profile signals was performed. The maximum signal in the profile was set to 1, the other signals were normalized to the maximum, and any values ⬎0.1 were considered significant. If the number of significant signals in an analyzed profile was greater than that in the reference profile for 3 to 7 units, the truncated profile was constructed from the analyzed profile by discarding significant signals common to both the reference and analyzed profiles (e.g., if the signal of element p-4 was defined as significant both for the analyzed and reference profiles, this signal was not considered fur-ther). Next, correlation coefficients with all reference profiles in the
data-base were calculated for such a truncated profile, and the second best-matched reference profile was selected.
To confirm the accuracy of the analysis of the mixed profile, a set of profiles corresponding to the superposition of the two profiles was calcu-lated. The signal of every profile element was calculated as follows:
zi⫽k1⫻xi⫹k2⫹yi (2)
wherexiandyidenote the normalized profile signals andk1andk2are
variable coefficients that were adjusted in a stepwise manner within two ranges (k1⫽1, 0ⱕk2ⱕ1 and 0ⱕk1ⱕ1,k2⫽1) to maximize thervalue
of the analyzed and superposition profiles. Maximalrvalues exceeding the threshold of 0.9 confirmed the hypothesis that the sample consisted of a DNA mixture.
Sequencing.Fragments of thegyrBand 16S genes and the ITS were am-plified with the following primers: gyrB-seq-F (5=-ACAAGGACCCCAACC TCACC-3=), gyrB-seq-R (5=-GCCTCACCTTCGATTTTCTTTAG-3=), 16S-seq-F (5=-AGAGTTTGATCCTGGCTCAG-3=), 16S-seq-R (5=-GTATTACC GCGGCTGCTG-3=), ITS-seq-F (5=-AAGTCGTAACAAGGTAGCCG-3=), and ITS-seq-R (5=-ATGCCAAGGCATCCACC-3=) (39) and subjected to dideoxy-sequencing using a terminal primer and an ABI Prism BigDye Ter-minator version 3.1 (Applied Biosystems, Foster City, CA, USA).
Sequence homology was identified using the BLAST program (40), with the NCBI nucleotide collection (nr/nt), NCBI genome (chromo-some), and whole-genome shotgun contig (WGS) sequence databases. For the 16S and ITS sequences, the RIDOM database (41) was also used. Nucleotide sequence accession numbers.The sequences without any perfect matches were submitted to GenBank under the accession numbers
KJ725311toKJ725344andKJ913783toKJ913788(see Table S3 in the supplemental material).
RESULTS
Evaluation of the oligonucleotide microarray using synthetic
DNA fragments.
The identification of mycobacterial species
based on the analysis of the
gyrB
gene fragment was performed by
biochip hybridization. The procedure consisted of two steps: (i)
asymmetric PCR to obtain fluorescently labeled predominantly
single-stranded DNA fragments and (ii) hybridization of the
la-beled product to the low-density microarray with gel elements
carrying immobilized oligonucleotides.
The primary evaluation of the assay was carried out using 20
synthetic DNA fragments that were used for oligonucleotide
se-lection (see Fig. S1 in the supplemental material). As a result, 20
individual hybridization profiles were obtained to be used as
ref-erences in the subsequent experiments. Every profile was
com-pared with the expected profile derived from the sequence
align-ments of the designed oligonucleotide and the
gyrB
gene fragment
(
Fig. 1A
and
B
).
The cross-correlation matrix for the reference profiles was
cal-culated (see Table S2 in the supplemental material). The average
coefficient for distinct profiles (r) was 0.04
⫾
0.15, whereas the
correlation for profiles obtained through the analysis of the same
fragment in three replicates was 0.995
⫾
0.004.
The highest interspecies correlation (0.80) was obtained for the
M. bovis
and MTC (non-M. bovis) profiles. Because the sequences
of the analyzed fragments for these two species varied in one
nu-cleotide position only, their hybridization profiles differed in the
fluorescent intensities of biochip elements with probes p-2 and
p-22.
The dependence of this method on the initial DNA
concentra-tion was also studied, using serial 10-fold diluconcentra-tions of the
synthe-sized DNA fragments. There was no significant difference in the
profiles produced at concentrations ranging from 10
8to 10
2on May 16, 2020 by guest
http://jcm.asm.org/
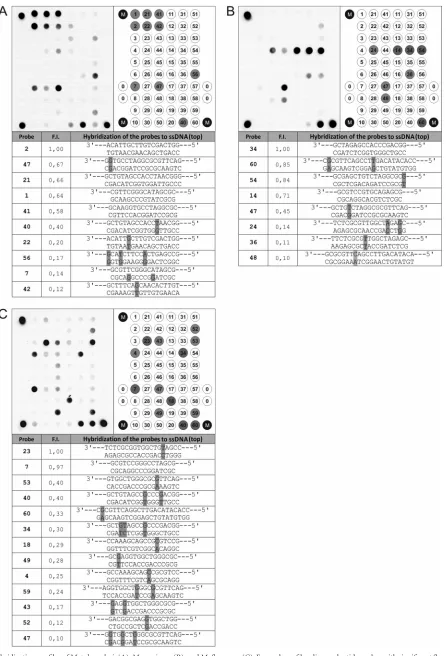
FIG 1Hybridization profiles ofM. tuberculosis(A),M. marinum(B), andM. flavescens(C). For each profile, oligonucleotide probes with significant fluorescence signals are shown on the microarray layout in gray. The pads on the array were designated as follows: M, marker pads; 0, empty pads; p-1 through p-60, pads with immobilized oligonucleotide probes. A list of probes with significant signals, their relative fluorescence intensities (F.I.), and corresponding hybridization duplexes with highlighted mismatches are shown in the tables. ssDNA, single-stranded DNA.
on May 16, 2020 by guest
http://jcm.asm.org/
[image:4.585.72.518.31.687.2]ies of DNA per reaction, regardless of the sequence of synthetic
DNA (e.g., for
M. tuberculosis
profiles, the correlation coefficient
[r] was 0.992
⫾
0.002).
Species identification using reference profiles.
Upon analysis
of the collections of isolates, 525 of 543 profiles had
ⱖ
3 positive
signals. The correlation coefficients with one of the reference
pro-files were
⬎
0.9 for 403 of the 543 (74%) analyzed samples.
Hy-bridization on the biochip correctly identified 11 of the 19
Myco-bacterium
reference profiles: MTC (non-M. bovis) (n
⫽
56
isolates),
M. bovis
(n
⫽
2 isolates),
M. intracellulare
(n
⫽
28
iso-lates),
M. avium(A) (n
⫽
83 isolates),
M. avium(B) (n
⫽
46
iso-lates),
M. avium(D) (n
⫽
9 isolates),
M. kansasii
(n
⫽
41 isolates),
M. gordonae
(n
⫽
25 isolates),
M. xenopi
(n
⫽
61 isolates),
M.
fortuitum
(n
⫽
37 isolates),
M. smegmatis
(n
⫽
1 isolate), and
M. chelonae
(n
⫽
14 isolates). Eight profiles corresponding to
M.
marinum,
M. avium(C),
M. gastri,
M. scrofulaceum,
M. szulgai,
M.
malmoense,
M. asiaticum, and
M. simiae
were not found.
The correlation coefficients of the profiles obtained by testing
synthetic DNA fragments and clinical isolate genomic DNA from
the same species were significantly higher than the threshold value
of 0.9. For example, for 56 profiles of MTC (non-M. bovis), the
average intercorrelation (r) was 0.97
⫾
0.03, and the average
cor-relation between the synthetic DNA fragment and genomic DNA
was 0.95
⫾
0.02. In every case, the microarray analysis results were
confirmed by the selective sequencing of the
gyrB, 16S, and ITS
loci (
Table 1
).
Cluster analysis of novel hybridization profiles.
In total, 117
of 543 isolates (22%) had profiles with
ⱖ3 positive signals;
how-ever, their correlation coefficients (r
values) did not exceed 0.75,
and the species were not reliably identified. These profiles were
subjected to cluster analysis, and 30 clusters were identified, with
an average intracluster correlation of 0.94
⫾
0.02 and an average
intercluster correlation of 0.19
⫾
0.18. The average correlation of
the novel cluster profiles with 20 reference profiles was 0.11
⫾
0.18. The novel clusters were assigned no. 21 to 50 (
Table 1
).
We proposed that such profiles were obtained due to the
am-plification and hybridization of
gyrB
fragments with sequences
that differ from the reference sequence. Thus, each cluster of
pro-files corresponds to the same species or subspecies with the
iden-tical or highly homologous
gyrB
sequence. This hypothesis was
confirmed by sequencing (
Table 1
). Detailed data on the analysis
of clinical isolates using microbiology, biochip testing, the
Geno-Type
Mycobacterium
CM/AS system, and the sequence analysis of
the
gyrB, 16S, and ITS loci are presented in Table S3 in the
sup-plemental material.
Figure 1C
shows an example of the hybridization profile for a
clinical isolate from collection I, corresponding to
M. flavescens
(
Table 1
, no. 44). The average
r
for the reference profiles was
0.13
⫾
0.16. The
gyrB
and 16S sequences were 100% homologous
with the published
M. flavescens
sequences (GenBank accession
no.
AB014310
and
AF547922
; see Table S3 in the supplemental
material). A sequence alignment of the
gyrB
fragment and
oligo-nucleotide probes was performed. Plausible meaningful biochip
elements and a probable chart of the probe interactions are shown
in
Fig. 1C
. There was an inverse relationship between the signal
intensity and the number of mismatches. However, this
depen-dency is not strict due to differences in the thermodynamic
prop-erties of noncanonical base pairs and the contribution of the
mis-match position; mismis-matches closer to the middle of probe have a
higher destabilizing effect on the hybridization duplex (
42
).
Thus, using a cluster analysis of the hybridization probes and
sequencing three loci in every group of isolates corresponding to
one profile cluster, 17 additional reference mycobacterial species
were identified. These
Mycobacterium
species are as follows:
M.
abscessus
(n
⫽
18 isolates),
M. lentiflavum
(n
⫽
7 isolates),
M.
septicum/M. peregrinum
(n
⫽
4 isolates),
M. mageritense
(n
⫽
2
isolates),
M. neoaurum
(n
⫽
2 isolates),
M. iranicum
(n
⫽
2
iso-lates),
M. flavescens
(n
⫽
2 isolates),
M. mantenii
(n
⫽
1 isolate),
M. intracellulare/M. colombiense
(n
⫽
1 isolate),
M.
kumamo-tonense
(n
⫽
1 isolate),
M. senuense
(n
⫽
1 isolate),
M. interjectum
(n
⫽
1 isolate),
M. intermedium
(n
⫽
1 isolate),
M. houstonense
(n
⫽
1 isolate),
M. mucogenicum
(n
⫽
1 isolate),
M. duvalii
(n
⫽
1
isolate), and
M. phlei
(n
⫽
1 isolate).
Intraspecific genetic diversity.
Eight identified
Mycobacte-rium
species,
M. intracellulare,
M. avium,
M. gordonae,
M.
lenti-flavum,
M. fortuitum,
M. septicum/M. peregrinum,
M. flavescens,
and
M. abscessus, were represented by more than one cluster of
profiles due to the intraspecific variability of the
gyrB
sequence.
The
M. gordonae
species had the highest variability, with five
different identified profiles corresponding to different
gyrB
and
16S sequences (
Table 1
, groups A to E). The previously described
five 16S sequevars of
M. gordonae
(
41
) corresponded to those we
identified in a specific manner: two groups of profiles (D and E)
were found for strains with 16S sequevar V, and one profile group
(A) included isolates with 16S sequevars I and II. The level of
homology of the
gyrB
fragments varied from 90 to 99%, and the
majority of the substitutions were synonymous. Only one group
of isolates,
M. gordonae(E), bore a sequence variant leading to an
I457M substitution (the position is given with respect to the
se-quence of
M. tuberculosis
strain H37Rv (GenBank accession no.
NC_000962.2
).
In addition to the 83, 46, and 9 isolates identified as
M.
avium(A),
M. avium(B), and
M. avium(D), respectively, one more
isolate was also determined to belong to
M. avium
(
Table 1
).
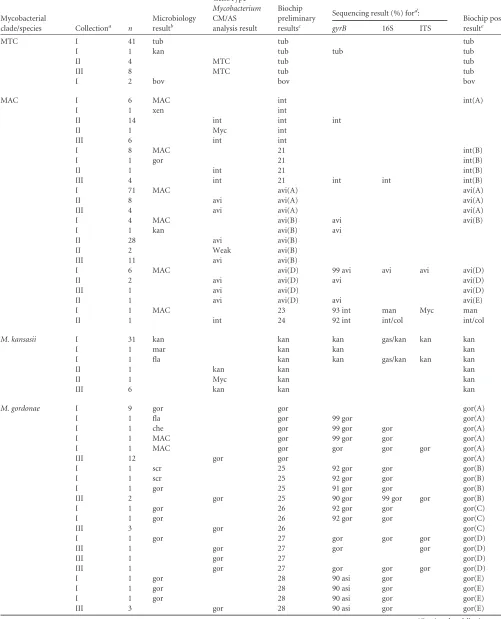
Table
2
contains summary data on the reliability of the
M. avium
sub-species identification by a microarray based on
gyrB
fragment
analysis. No isolates were found to correspond to the
M. avium(C)
profile, and the correlation coefficients for this profile were
calcu-lated during an analysis of the synthetic DNA fragment. The
com-parison of
gyrB
sequences from different groups of isolates and
published
M. avium
genomes enabled us to conclude that isolates
from the
M. avium(B) profile group belonged to the
M. avium
subsp.
hominissuis, and
M. avium(C) belonged to
M. avium
subsp.
paratuberculosis
(
Table 2
). For the other groups, there were no
strict matching profile groups or
M. avium
subspecies.
Two profile clusters (37 and 35 isolates) of
M. fortuitum,
des-ignated (A) and (B), also showed significant diversity: the
inter-cluster coefficient (r) was 0.60
⫾
0.05, while the intracluster
coef-ficients (r) were 0.98
⫾
0.01 and 0.98
⫾
0.2 for (A) and (B),
respectively. Sequencing of the
gyrB
gene revealed 1 to 3
nucleo-tide substitutions for the DNA samples in cluster (A) and 6 to 7
substitutions for cluster (B) compared with the reference
M.
for-tuitum
sequence used for oligonucleotide probe selection. The
amino acid sequences derived from the nucleotides were identical
for all sequenced isolates. Furthermore, the sequence of the 16S
gene was identical and corresponded to sequevar I of
M. fortuitum
(
41
).
The hybridization on the biochip identified one more
M.
fla-vescens
isolate (
Table 1
, no. 45, fla.B) in addition to that described
above (fla.A). The correlation of their profiles was only 0.72. The
on May 16, 2020 by guest
http://jcm.asm.org/
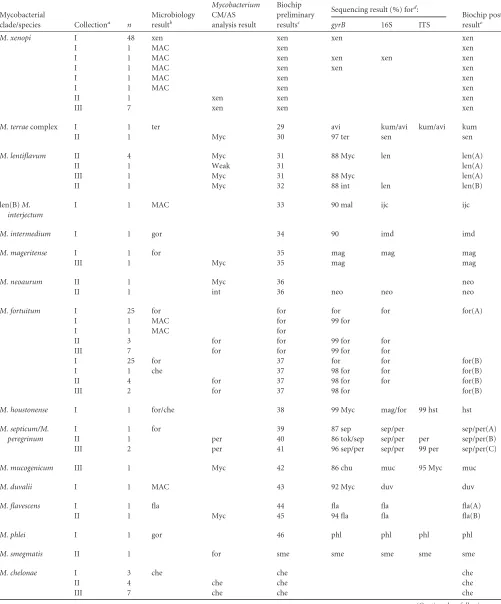
TABLE 1Comparison of microarray species identification results of clinical strains with microbiology data from the GenoTypeMycobacteriumCM/ AS system and sequence analysis of thegyrB, 16S, and ITS loci for three collections of clinical isolates
Mycobacterial
clade/species Collectiona n
Microbiology resultb
GenoType Mycobacterium CM/AS analysis result
Biochip preliminary resultsc
Sequencing result (%) ford:
Biochip post resulte
gyrB 16S ITS
MTC I 41 tub tub tub
I 1 kan tub tub tub
II 4 MTC tub tub
III 8 MTC tub tub
I 2 bov bov bov
MAC I 6 MAC int int(A)
I 1 xen int
II 14 int int int
II 1 Myc int
III 6 int int
I 8 MAC 21 int(B)
I 1 gor 21 int(B)
II 1 int 21 int(B)
III 4 int 21 int int int(B)
I 71 MAC avi(A) avi(A)
II 8 avi avi(A) avi(A)
III 4 avi avi(A) avi(A)
I 4 MAC avi(B) avi avi(B)
I 1 kan avi(B) avi
II 28 avi avi(B)
II 2 Weak avi(B)
III 11 avi avi(B)
I 6 MAC avi(D) 99 avi avi avi avi(D)
II 2 avi avi(D) avi avi(D)
III 1 avi avi(D) avi(D)
II 1 avi avi(D) avi avi(E)
I 1 MAC 23 93 int man Myc man
II 1 int 24 92 int int/col int/col
M. kansasii I 31 kan kan kan gas/kan kan kan
I 1 mar kan kan kan
I 1 fla kan kan gas/kan kan kan
II 1 kan kan kan
II 1 Myc kan kan
III 6 kan kan kan
M. gordonae I 9 gor gor gor(A)
I 1 fla gor 99 gor gor(A)
I 1 che gor 99 gor gor gor(A)
I 1 MAC gor 99 gor gor gor(A)
I 1 MAC gor gor gor gor gor(A)
III 12 gor gor gor(A)
I 1 scr 25 92 gor gor gor(B)
I 1 scr 25 92 gor gor gor(B)
I 1 gor 25 91 gor gor gor(B)
III 2 gor 25 90 gor 99 gor gor gor(B)
I 1 gor 26 92 gor gor gor(C)
I 1 gor 26 92 gor gor gor(C)
III 3 gor 26 gor(C)
I 1 gor 27 gor gor gor gor(D)
III 1 gor 27 gor gor gor(D)
III 1 gor 27 gor(D)
III 1 gor 27 gor gor gor gor(D)
I 1 gor 28 90 asi gor gor(E)
I 1 gor 28 90 asi gor gor(E)
I 1 gor 28 90 asi gor gor(E)
III 3 gor 28 90 asi gor gor(E)
(Continued on following page)
Zimenkov et al.
on May 16, 2020 by guest
http://jcm.asm.org/
TABLE 1(Continued)
Mycobacterial
clade/species Collectiona n
Microbiology resultb
GenoType Mycobacterium CM/AS analysis result
Biochip preliminary resultsc
Sequencing result (%) ford:
Biochip post resulte
gyrB 16S ITS
M. xenopi I 48 xen xen xen xen
I 1 MAC xen xen
I 1 MAC xen xen xen xen
I 1 MAC xen xen xen
I 1 MAC xen xen
I 1 MAC xen xen
II 1 xen xen xen
III 7 xen xen xen
M. terraecomplex I 1 ter 29 avi kum/avi kum/avi kum
II 1 Myc 30 97 ter sen sen
M. lentiflavum II 4 Myc 31 88 Myc len len(A)
II 1 Weak 31 len(A)
III 1 Myc 31 88 Myc len(A)
II 1 Myc 32 88 int len len(B)
len(B)M. interjectum
I 1 MAC 33 90 mal ijc ijc
M. intermedium I 1 gor 34 90 imd imd
M. mageritense I 1 for 35 mag mag mag
III 1 Myc 35 mag mag
M. neoaurum II 1 Myc 36 neo
II 1 int 36 neo neo neo
M. fortuitum I 25 for for for for for(A)
I 1 MAC for 99 for
I 1 MAC for
II 3 for for 99 for for
III 7 for for 99 for for
I 25 for 37 for for for(B)
I 1 che 37 98 for for for(B)
II 4 for 37 98 for for for(B)
III 2 for 37 98 for for(B)
M. houstonense I 1 for/che 38 99 Myc mag/for 99 hst hst
M. septicum/M. peregrinum
I 1 for 39 87 sep sep/per sep/per(A)
II 1 per 40 86 tok/sep sep/per per sep/per(B)
III 2 per 41 96 sep/per sep/per 99 per sep/per(C)
M. mucogenicum III 1 Myc 42 86 chu muc 95 Myc muc
M. duvalii I 1 MAC 43 92 Myc duv duv
M. flavescens I 1 fla 44 fla fla fla(A)
II 1 Myc 45 94 fla fla fla(B)
M. phlei I 1 gor 46 phl phl phl phl
M. smegmatis II 1 for sme sme sme sme sme
M. chelonae I 3 che che che
II 4 che che che
III 7 che che che
(Continued on following page)
on May 16, 2020 by guest
http://jcm.asm.org/
sequence of the
gyrB
gene was determined for the fla.B isolate
(GenBank accession no.
KJ725340
). The level of homology with
the sequence of the
M. flavescens
KPM 4713 strain (GenBank
ac-cession no.
AB014310
) was 94% (24 substitutions per 402 bp).
The 16S nucleotide and GyrB amino acid sequences were identical
for the two isolates.
Two profiles each for
M. abscessus,
M. intracellulare, and
M.
lentiflavum
were identified in a similar manner.
Analysis of weak and mixed profiles.
In total, 18 of the 543
isolate hybridization profiles were determined to be weak, as they
had no positive signals after hybridization. Mathematically, the
signal intensities of these profiles varied slightly within a narrow
range (
⬍
10%) that was close to the noise signal, as detected from
elements without oligonucleotides. The amplification of the 16S
rRNA gene fragment was positive in only 6 isolates, and the
se-quencing of these fragments revealed that three isolates contained
DNA from
Gordonia sputi, one isolate contained DNA from
Staphylococcus hominis, one isolate contained DNA from
Staphy-lococcus epidermidis, and one isolate contained DNA from
Myco-bacterium celatum.
[image:8.585.40.549.547.689.2]Six profiles of the 543 isolates were identified as containing
mixed DNA from two distinct species: 1 DNA sample contained a
mix of
M. avium
and
M. intracellulare, 1 contained a mix of
M.
avium
and
M. lentiflavum, and 3 had similar profiles of MTC
(non-M. bovis) and
M. avium. The mixed profiles had
intermedi-ate correlation coefficient (r
values) with one of the reference
pro-files, and they simultaneously had a greater number of significant
signals due to the contribution of additional DNA in the PCR
amplification and hybridization steps. A schematic of the
mixed-profile analysis is shown in
Fig. 2
, which provides the mixed
M.
tuberculosis
(MTC [non-M. bovis])-M. avium
profile as an
exam-ple. The best hit for the analyzed profile was the
M. avium
profile,
with a coefficient (r) of 0.85. Significant signals common to the
analyzed and reference profiles were discarded to obtain a
trun-cated profile with six significant signals (
Fig. 2C
). The subsequent
search for the best matches for the truncated profile showed
TABLE 1(Continued)Mycobacterial
clade/species Collectiona n
Microbiology resultb
GenoType Mycobacterium CM/AS analysis result
Biochip preliminary resultsc
Sequencing result (%) ford:
Biochip post resulte
gyrB 16S ITS
M. abscessus I 5 for 47 abs abs abs abs(A)
I 3 che 47 abs abs abs(A)
III 7 abs 47 abs(A)
II 2 abs 48 99 abs abs abs abs(B)
III 1 abs 49 bol abs bol
M. iranicum I 1 gor 50 91 sme ira 99 ira ira
I 1 for 50 91 sme ira 99 ira ira
a
Strains in collection I were isolated at the Moscow Scientific and Clinical Antituberculosis Center, Moscow, Russia; II, St. Petersburg State Research Institute of Phtisiopulmonology, St. Petersburg, Russia; III, collection of Moscow State Research Institute for Phthisiopulmonology, Moscow, Russia.
b
abs,M. abscessus; avi,M. avium; asi,M. asiaticum; bol,M. abscessussubsp.bolletii; bov,M. bovis; che,M. chelonae; chu,M. chubuense; col,M. colombiense; duv,M. duvalii; fla,M. flavescens; for,M. fortuitum; gor,M. gordonae; hst,M. houstonense; ijc,M. interjectum; imd,M. intermedium; int,M. intracellulare; ira,M. iranicum; kan,M. kansasii; kum,M. kumamotonense; len,M. lentiflavum; MAC,M. aviumcomplex; mag,M. mageritense; mal,M. malmoense; man,M. mantenii; muc,M. mucogenicum; Myc,Mycobacteriumsp.; nea,
M. neoaurum; per,M. peregrinum; phl,M. phlei; sim,M. simiae; sen,M. senuense; sep,M. septicum; sme,M. smegmatis; ter,M. terrae; tok,M. tokaiense; tub,M. tuberculosis; xen,M. xenopi. Profile clusters that correspond to the same species are designated with letters A, B, and C in parentheses.
cPreliminary results of microarray analysis for species identification; novel profiles with no homology are designated with a number.
d
Numerals represent homology percentages. Where no numeral is given, the homology is 100%. eReannotation of the hybridization profile upon analysis of thegyrB, 16S, and ITS sequences.
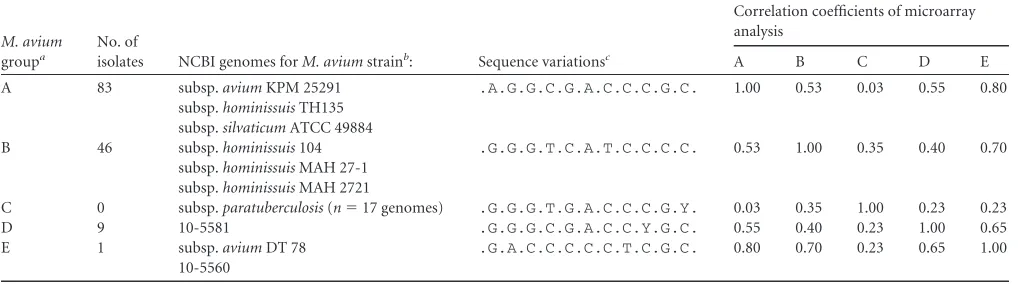
TABLE 2Specificity of theM. aviumsubspecies identification through hybridization microarray analysis
M. avium groupa
No. of
isolates NCBI genomes forM. aviumstrainb: Sequence variationsc
Correlation coefficients of microarray analysis
A B C D E
A 83 subsp.aviumKPM 25291 .A.G.G.C.G.A.C.C.C.G.C. 1.00 0.53 0.03 0.55 0.80 subsp.hominissuisTH135
subsp.silvaticumATCC 49884
B 46 subsp.hominissuis104 .G.G.G.T.C.A.T.C.C.C.C. 0.53 1.00 0.35 0.40 0.70 subsp.hominissuisMAH 27-1
subsp.hominissuisMAH 2721
C 0 subsp.paratuberculosis(n⫽17 genomes) .G.G.G.T.G.A.C.C.C.G.Y. 0.03 0.35 1.00 0.23 0.23
D 9 10-5581 .G.G.G.C.G.A.C.C.Y.G.C. 0.55 0.40 0.23 1.00 0.65
E 1 subsp.aviumDT 78 .G.A.C.C.C.C.C.T.C.G.C. 0.80 0.70 0.23 0.65 1.00 10-5560
a
Determined by a consensus of microarray analysis andgyrB, 16S, and ITS fragment sequencing. bPublished genomes with the best-matched sequence at thegyrB, 16S, and ITS loci.
c
Variations are given at positions 912, 918, 924, 930, 936, 972, 975, 984, 1011, 1014, and 1023, interspersed by dots in the 745 to 1161 range relative to the GenBank accession no.
AB014189sequence.
Zimenkov et al.
on May 16, 2020 by guest
http://jcm.asm.org/
a maximum correlation coefficient (r) of 0.83 with the MTC
(non-M. bovis) profile. The correlation coefficient of the
superpo-sition of the two profiles with the analyzed profile was 0.904,
which exceeds the threshold value (
Fig. 2E
).
Final performance of the assay.
Testing of the genomic DNA
samples from collection I using conventional microbiology
meth-ods and the biochip-based assay identified 35 discordant samples
of the 337 samples. Two isolates from collection II, identified by
the GenoType
Mycobacterium
CM/AS method as
M. intracellulare
and
M. fortuitum, were instead identified as
M. neoaurum
and
M.
smegmatis, respectively, by our assay. In all discordant cases, the
results of the microarray analysis were confirmed with
sequenc-ing. The final sensitivity of the conventional methods was
approx-imately 90%. Overall, upon analysis of the clinical isolates, 33 new
gyrB
fragment sequences (GenBank accession no.
KJ725311
through
KJ725343
), one new 16S rRNA gene fragment sequence
(GenBank accession no.
KJ725344
), and six new ITS sequences
with no identity in GenBank were obtained (GenBank accession
no.
KJ913783
through
KJ913788
).
The final list of identified species for the three collections of
isolates is shown in
Table 3
. In total, 525 of the 543 (96.7%)
iso-lates were identified by microarray analysis. The sensitivity of the
test might be even higher, considering that 17 of the 18
noniden-tified DNA samples did not contain mycobacterial DNA, as
con-cluded from the analysis of 16S rRNA gene sequencing. Thus, the
sensitivity of the test was calculated as 99.8% [(543
⫺
18)/(543
⫺
17)
⫻
100], and the specificity was 100% when 16S and ITS
frag-ment sequencing was used as the standard.
The average cross-correlation of all independent profiles was
0.13
⫾
0.19, allowing us to confidently recognize 50 distinct
pro-files corresponding to species and subspecies of
Mycobacterium.
The highest correlation between distinct profiles,
M. avium(A)
and
M. avium(E), was 0.80
⫾
0.02. However, this value was still
lower than the threshold value of 0.9, such that probable errors in
the identification of these profiles should not lead to the
misiden-tification of these species.
The specificity of this method was tested using genomic DNA
from
E. coli,
E. faecalis,
S. aureus,
S. oralis, and
S. sanguinis.
Analytical sensitivity was also estimated using DNA from 61
clinical samples from collection IV, which were isolated from
pa-tients and characterized by microscopy. The sensitivity was 95%
(18 of 19 samples) for 3
⫹
acid-fast bacilli (AFB), 93% (14 of 15)
for 2
⫹
AFB, 85% (11 of 13) for 1
⫹
AFB, 89% (8 of 9) for 1 to 9
AFB in 100 microscopy fields, and in 4 of the 11 for AFB
⫺
sam-ples. In one sample, the mixed
M. tuberculosis-M. avium
profile
was also identified, as described above.
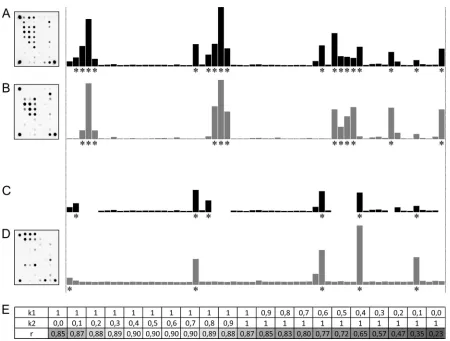
FIG 2Analysis of the mixed profile. For every profile, hybridization pictures and corresponding normalized fluorescence intensities are shown. Significant signals are marked with asterisks. (A) Analyzed profile. (B) Best-scored profile A database profile ofM. avium(group B). (C) Diminished mixed profile A with the exclusion of significant signals common to mixed and best-scored profiles. (D) Best-scored profile for the s diminished profile, corresponding to MTC (non-M. bovis). (E) Correlation coefficients (r) for the superposition of profiles B and D and mixed profile A, obtained upon variation of the linear coefficients k1andk2(see the text).
on May 16, 2020 by guest
http://jcm.asm.org/
[image:9.585.68.518.61.402.2]DISCUSSION
In this study, we developed a method for mycobacterial species
identification by
gyrB
gene fragment hybridization analysis on a
low-density hydrogel microarray (biochip) and evaluated it using
543 isolates and 61 clinical samples from two regions of Russia.
The genetic target for mycobacterial species identification was
selected based on data showing that the
gyrB
gene is more
poly-morphic than is the 16S rRNA gene. This difference might provide
the advantage of having a more detailed analysis of the causative
agent and a wider spectrum of the detected species. For example,
analysis of the 16S rRNA gene does not allow for the
differentia-tion of
M. gastri
and
M. kansasii
(
41
), which are clinically distinct
(
43
). Conversely, intraspecies
gyrB
gene diversity may lead to an
inability to identify isolates with a number of sequence
substitu-tions compared to the reference sequence used for probe selection.
To overcome this possibility, we used three oligonucleotide
probes for each species for the design of the microarray. This
ap-proach also lowered the probability of misidentifying rare species
through cross-reaction with a single probe (
42
).
The results of hybridization were interpreted using an original
algorithm of profile recognition, and the Pearson correlation
co-efficient for the hybridization signals was used as the criterion for
comparing two profiles. The software for species identification
included the database of reference profiles, and nucleotide
substi-tutions inside the analyzed fragment led to the generation of novel
profiles detected by the software as “unknown” due to a low
Pear-son correlation coefficient. Upon 16S and ITS sequence analyses,
the novel profile was attributed to a defined species or subspecies
and was added to the reference profile database, thus expanding
the spectrum of species that could be identified using this method.
In total, the number of identified profiles grew from 20 initial
profiles, which were obtained upon analysis of the synthetic
pro-files, to 50 upon analysis of the clinical isolates.
The influence of substitutions depends on the position in
com-parison with the oligonucleotide probe position: no effect on
hy-bridization is found if the substitution lays outside the probe
boundaries, with little effect when the mismatch is close to the
boundaries inside the probe and a large effect if it is close to the
center of any probe with a significant signal.
[image:10.585.41.542.77.443.2]The several-species-specific probe design also allowed the
identification of species in mixed samples. An algorithm included
a profile decomposition based on the extraction of significant
sig-nals, in which signals corresponding to one profile are cast out,
and the recognition of the second profile is accomplished with the
residual signals. Importantly, the number of significant signals
common to both profiles needs to be low.
TABLE 3Spectrum of identified mycobacterial species in three collections of clinical isolates
Group Species
No. in collection:
Total no.
I II III
MTC MTC (non-M. bovis) 44 4 8 56
M. bovis 2 0 0 2
MAC M. intracellulare 16 16 10 42
M. aviumsubspecies 82 41 16 139
M. mantenii 1 0 0 1
M. intracellulare/M. colombiense 0 1 0 1
M. kansasii 33 2 6 41
M. gordonae 22 0 23 45
M. xenopi 53 1 7 61
Terrae M. kumamotonense 1 0 0 1
M. senuense 0 1 0 1
M. lentiflavum 0 6 1 7
M. interjectum 1 0 0 1
M. intermedium 1 0 0 1
Neoaurum M. mageritense 1 0 1 2
M. neoaurum 0 2 0 2
Fortuitum M. fortuitum 56 7 9 72
M. septicum/M. peregrinum 1 1 2 4
M. houstonense 1 0 0 1
M. iranicum 2 0 0 2
Vaccae M. mucogenicum 0 0 1 1
Smegmatis M. duvalii 1 0 0 1
M. flavescens 1 1 0 2
M. phlei 1 0 0 1
M. smegmatis 0 1 0 1
Chelonae-abscessus M. chelonae 3 4 7 14
M. abscessussubspecies 8 2 8 18 Zimenkov et al.
on May 16, 2020 by guest
http://jcm.asm.org/
The assay allowed for the identification of 35 mycobacterial
species, which is larger than that previously reported (
18–21
), and
was able to differentiate between
M. tuberculosis
and
M. bovis. The
final list of
Mycobacterium
species detected by the assay includes
35 species, 27 of which were found in the clinical isolates of two
regions of Russia:
M. tuberculosis
complex (MTC) (non-M. bovis),
M. bovis,
M. intracellulare,
M. avium
subspecies,
M. mantenii,
M.
intracellulare/M. colombiense,
M. kansasii,
M. gordonae,
M. xenopi,
M. kumamotonense,
M. senuense,
M. lentiflavum,
M. interjectum,
M. intermedium,
M. mageritense,
M. neoaurum,
M. fortuitum,
M.
septicum/M. peregrinum,
M. houstonense,
M. iranicum,
M.
muco-genicum,
M. duvalii,
M. flavescens,
M. phlei,
M. smegmatis,
M.
chelonae, and
M. abscessus. The capability to detect 8 more species
(M. marinum,
M. avium
subsp.
paratuberculosis,
M. gastri,
M.
scrofulaceum,
M. szulgai,
M. malmoense,
M. asiaticum, and
M.
simiae) was tested with synthetic DNA fragments based on
Gen-Bank sequences of the
gyrB
gene.
The sensitivity of the assay was 99.8%, with 100% specificity
when 16S and ITS fragment sequencing was used as the standard.
The relevance of the assay might change if another set of samples is
analyzed, particularly those from other countries with different
spectra of nontuberculosis mycobacteria. However, considering
Russia, with a high level of migration, Moscow and St. Petersburg
are the largest cities that represent all countries of the former
So-viet Union, and we propose that the sensitivity and specificity
would not differ dramatically upon the evaluation of samples
from other regions of Russia. The most frequent nontuberculous
species identified were
M. aviumcomplex (39%), the
M. fortuitum
group (17%), and
M. xenopi
(13%). The clinical significance of
detection varies for different species.
M. kansasii, found in 9% of
cases (41 isolates), is strongly associated with disease pathology
(
43
). In contrast,
M. gordonae
was found in a similar number of
cases (45 isolates [10%]) and rarely causes clinical disease (
44
); in
fact, it is usually present in samples due to laboratory
contamina-tion (
45
).
The diagnostic kits based on hydrogel low-density microarrays
developed at the Engelhardt Institute of Molecular Biology are
widely used in a number of Russian antituberculosis centers for
the detection of
M. tuberculosis
resistance to rifampin/isoniazid
and fluoroquinolones (
33
,
37
), as well as for the genotyping of
MTC (
46
). The described method for mycobacterial species
iden-tification utilizes the same technique as the one tube, one biochip
format. This approach would be a good complementary method
for use with existing diagnostic tools. This combination of assays
will allow for the complex analysis of clinical material from
pa-tients based on a common biochip platform in a laboratory
set-ting.
ACKNOWLEDGMENTS
This work was supported by the by the Russian Science Foundation grant 14-50-00060 (for development and evaluation of the assay) and partially by a molecular and cell biology grant from the Russian Academy of Sci-ences (for nucleotide sequencing).
REFERENCES
1.Schlossberg D.2006. Tuberculosis & nontuberculous mycobacterial in-fections, 5th ed. McGraw-Hill, Medical Publishing Division, New York, NY.
2.Fusco da Costa AR, Falkinham JO, III, Lopes ML, Barretto AR, Felicio JS, Sales LH, Bahia JR, Conceição EC, Lima KV.2013. Occurrence of nontuberculous mycobacterial pulmonary infection in an endemic area of
tuberculosis. PLoS Negl Trop Dis 7:e2340. http://dx.doi.org/10.1371 /journal.pntd.0002340.
3.Somoskovi A, Salfinger M.2014. Nontuberculous mycobacteria in respi-ratory infections: advances in diagnosis and identification. Clin Lab Med 34:271–295.http://dx.doi.org/10.1016/j.cll.2014.03.001.
4. Butler WR, Guthertz LS. 2001. Mycolic acid analysis by high-performance liquid chromatography for identification ofMycobacterium species. Clin Microbiol Rev14:704 –726.http://dx.doi.org/10.1128/CMR .14.4.704-726.2001.
5.Chihota VN, van Halsema CL, Grant AD, Fielding KL, van Helden PD, Churchyard GJ, Gey van Pittius NC.2013. Spectrum of non-tuberculous mycobacteria identified using standard biochemical testing vs. 16S se-quencing. Int J Tuberc Lung Dis17:267–269.http://dx.doi.org/10.5588 /ijtld.12.0425.
6.Stender H, Lund K, Petersen KH, Rasmussen OF, Hongmanee P, Miorner H, Godtfredsen SE. 1999. Fluorescencein situhybridization assay using peptide nucleic acid probes for differentiation between tuber-culous and nontubertuber-culousMycobacteriumspecies in smears of Mycobac-teriumcultures. J Clin Microbiol37:2760 –2765.
7.Gopinath K, Singh S.2009. Multiplex PCR assay for simultaneous detec-tion and differentiadetec-tion of Mycobacterium tuberculosis,Mycobacterium aviumcomplexes and otherMycobacterialspecies directly from clinical specimens. J Appl Microbiol 107:425– 435.http://dx.doi.org/10.1111/j .1365-2672.2009.04218.x.
8.Nakajima C, Rahim Z, Fukushima Y, Sugawara I, van der Zanden AG, Tamaru A, Suzuki Y.2010. Identification ofMycobacterium tuberculosis clinical isolates in Bangladesh by a species distinguishable multiplex PCR. BMC Infect Dis10:118.http://dx.doi.org/10.1186/1471-2334-10-118. 9.Patel JB, Leonard DG, Pan X, Musser JM, Berman RE, Nachamkin I.
2000. Sequence-based identification ofMycobacteriumspecies using the MicroSeq 500 16S rDNA bacterial identification system. J Clin Microbiol 38:246 –251.
10. Zelazny AM, Calhoun LB, Li L, Shea YR, Fischer SH.2005. Identifica-tion ofMycobacteriumspecies bysecA1sequences. J Clin Microbiol43: 1051–1058.http://dx.doi.org/10.1128/JCM.43.3.1051-1058.2005. 11. Yamada-Noda M, Ohkusu K, Hata H, Shah MM, Nhung PH, Sun XS,
Hayashi M, Ezaki T.2007.Mycobacteriumspecies identification–a new approach via dnaJ gene sequencing. Syst Appl Microbiol30:453– 462.
http://dx.doi.org/10.1016/j.syapm.2007.06.003.
12. Shrestha NK, Tuohy MJ, Hall GS, Reischl U, Gordon SM, Procop GW. 2003. Detection and differentiation ofMycobacterium tuberculosisand nontuberculous mycobacterial isolates by real-time PCR. J Clin Microbiol 41:5121–5126.http://dx.doi.org/10.1128/JCM.41.11.5121-5126.2003. 13. Kim H, Kim SH, Shim TS, Kim MN, Bai GH, Park YG, Lee SH, Chae
GT, Cha CY, Kook YH, Kim BJ.2005. Differentiation ofMycobacterium species by analysis of the heat-shock protein 65 gene (hsp65). Int J Syst Evol Microbiol55:1649 –1656.http://dx.doi.org/10.1099/ijs.0.63553-0. 14. Lee H, Bang HE, Bai GH, Cho SN.2003. Novel polymorphic region of
therpoBgene containingMycobacteriumspecies-specific sequences and its use in identification of mycobacteria. J Clin Microbiol41:2213–2218.
http://dx.doi.org/10.1128/JCM.41.5.2213-2218.2003.
15. Tortoli E, Nanetti A, Piersimoni C, Cichero P, Farina C, Mucignat G, Scarparo C, Bartolini L, Valentini R, Nista D, Gesu G, Tosi CP, Crovatto M, Brusarosco G.2001. Performance assessment of new mul-tiplex probe assay for identification of mycobacteria. J Clin Microbiol 39:1079 –1084.http://dx.doi.org/10.1128/JCM.39.3.1079-1084.2001. 16. Richter E, Weizenegger M, Rusch-Gerdes S, Niemann S.2003.
Evalua-tion of genotype MTBC assay for differentiaEvalua-tion of clinicalMycobacterium tuberculosiscomplex isolates. J Clin Microbiol41:2672–2675.http://dx .doi.org/10.1128/JCM.41.6.2672-2675.2003.
17. Troesch A, Nguyen H, Miyada CG, Desvarenne S, Gingeras TR, Kaplan PM, Cros P, Mabilat C.1999.Mycobacteriumspecies identification and rifampin resistance testing with high-density DNA probe arrays. J Clin Microbiol37:49 –55.
18. Gingeras TR, Ghandour G, Wang E, Berno A, Small PM, Drobniewski F, Alland D, Desmond E, Holodniy M, Drenkow J.1998. Simultaneous genotyping and species identification using hybridization pattern recog-nition analysis of genericMycobacteriumDNA arrays. Genome Res8:435– 448.
19. Fukushima M, Kakinuma K, Hayashi H, Nagai H, Ito K, Kawaguchi R. 2003. Detection and identification ofMycobacteriumspecies isolates by DNA microarray. J Clin Microbiol41:2605–2615.http://dx.doi.org/10 .1128/JCM.41.6.2605-2615.2003.
on May 16, 2020 by guest
http://jcm.asm.org/
20. Park H, Jang H, Song E, Chang CL, Lee M, Jeong S, Park J, Kang B, Kim C.2005. Detection and genotyping ofMycobacteriumspecies from clinical isolates and specimens by oligonucleotide array. J Clin Microbiol43: 1782–1788.http://dx.doi.org/10.1128/JCM.43.4.1782-1788.2005. 21. Zhu L, Jiang G, Wang S, Wang C, Li Q, Yu H, Zhou Y, Zhao B, Huang
H, Xing W, Mitchelson K, Cheng J, Zhao Y, Guo Y.2010. Biochip system for rapid and accurate identification of mycobacterial species from isolates and sputum. J Clin Microbiol48:3654 –3660.http://dx.doi.org/10 .1128/JCM.00158-10.
22. Kox LF, van Leeuwen J, Knijper S, Jansen HM, Kolk AH.1995. PCR assay based on DNA coding for 16S rRNA for detection and identification of mycobacteria in clinical samples. J Clin Microbiol33:3225–3233. 23. De Beenhouwer H, Liang Z, De Rijk P, Van Eekeren C, Portaels F.1995.
Detection and identification of mycobacteria by DNA amplification and oligonucleotide-specific capture plate hybridization. J Clin Microbiol33: 2994 –2998.
24. Foongladda S, Pholwat S, Eampokalap B, Kiratisin P, Sutthent R.2009. Multi-probe real-time PCR identification of commonMycobacterium species in blood culture broth. J Mol Diagn11:42– 48.http://dx.doi.org/10 .2353/jmoldx.2009.080081.
25. Hatta M, Sultan AR, Tandirogang N, Masjudi, Yadi.2010. Detection and identification of mycobacteria in sputum from suspected tuberculosis patients. BMC Res Notes3:72.http://dx.doi.org/10.1186/1756-0500-3-72. 26. Richardson ET, Samson D, Banaei N. 2009. Rapid identification of Mycobacterium tuberculosisand nontuberculous mycobacteria by multi-plex, real-time PCR. J Clin Microbiol47:1497–1502.http://dx.doi.org/10 .1128/JCM.01868-08.
27. Padilla E, Gonzalez V, Manterola JM, Perez A, Quesada MD, Gordillo S, Vilaplana C, Pallares MA, Molinos S, Sanchez MD, Ausina V.2004. Comparative evaluation of the new version of the INNO-LiPA mycobac-teria and GenoTypeMycobacteriumassays for identification of Mycobac-teriumspecies from MB/BacT liquid cultures artificially inoculated with mycobacterial strains. J Clin Microbiol42:3083–3088.http://dx.doi.org /10.1128/JCM.42.7.3083-3088.2004.
28. Seagar AL, Prendergast C, Emmanuel FX, Rayner A, Thomson S, Laurenson IF.2008. Evaluation of the GenoType Mycobacteria direct assay for the simultaneous detection of theMycobacterium tuberculosis complex and four atypical mycobacterial species in smear-positive respi-ratory specimens. J Med Microbiol57:605– 611.http://dx.doi.org/10.1099 /jmm.0.47484-0.
29. Cooksey RC, Limor J, Morlock GP, Crawford JT. 2003. Identifying Mycobacteriumspecies and strain typing using a microfluidic labchip in-strument. Biotechniques35:786 –794.
30. Kasai H, Ezaki T, Harayama S.2000. Differentiation of phylogenetically related slowly growing mycobacteria by theirgyrBsequences. J Clin Mi-crobiol38:301–308.
31. Niemann S, Harmsen D, Rusch-Gerdes S, Richter E.2000. Differentia-tion of clinicalMycobacterium tuberculosiscomplex isolates bygyrBDNA sequence polymorphism analysis. J Clin Microbiol38:3231–3234. 32. Yershov G, Barsky V, Belgovskiy A, Kirillov E, Kreindlin E, Ivanov I,
Parinov S, Guschin D, Drobishev A, Dubiley S, Mirzabekov A.1996. DNA analysis and diagnostics on oligonucleotide microchips. Proc Natl Acad Sci U S A93:4913– 4918.http://dx.doi.org/10.1073/pnas.93.10.4913.
33. Gryadunov D, Dementieva E, Mikhailovich V, Nasedkina T, Rubina A, Savvateeva E, Fesenko E, Chudinov A, Zimenkov D, Kolchinsky A, Zasedatelev A.2011. Gel-based microarrays in clinical diagnostics in Russia. Expert Rev Mol Diagn 11:839 – 853. http://dx.doi.org/10 .1586/erm.11.73.
34. Litvinov VI, Makarova MV, Krasnova MA, Dorozhkova IR, Freiman GE.2010. Isolation and identification of non-tuberculosis mycobacteria. Vestn Ross Akad Med Nauk (3):7–11. (In Russian.)
35. WHO.1998. Laboratory services in tuberculosis control. Part II: microscopy. WHO/TB/98.258. World Health Organization, Geneva, Switzerland.http: //whqlibdoc.who.int/hq/1998/WHO_TB_98.258_%28part2%29.pdf. 36. Makinen J, Marjamaki M, Marttila H, Soini H.2006. Evaluation of a
novel strip test, GenoTypeMycobacteriumCM/AS, for species identifica-tion of mycobacterial cultures. Clin Microbiol Infect12:481– 483.http: //dx.doi.org/10.1111/j.1469-0691.2006.01380.x.
37. Zimenkov DV, Antonova OV, Kuz’min AV, Isaeva YD, Krylova LY, Popov SA, Zasedatelev AS, Mikhailovich VM, Gryadunov DA.2013. Detection of second-line drug resistance inMycobacterium tuberculosis using oligonucleotide microarrays. BMC Infect Dis13:240.http://dx.doi .org/10.1186/1471-2334-13-240.
38. Pan’kov SV, Chechetkin VR, Somova OG, Antonova OV, Moiseeva OV, Prokopenko DV, Yurasov RA, Gryadunov DA, Chudinov AV.2009. Kinetic effects on signal normalization in oligonucleotide microchips with labeled immobilized probes. J Biomol Struct Dyn27:235–244.http://dx .doi.org/10.1080/07391102.2009.10507312.
39. Harmsen D, Rothganger J, Singer C, Albert J, Frosch M.1999. Intuitive hypertext-based molecular identification of micro-organisms. Lancet353: 291.http://dx.doi.org/10.1016/S0140-6736(98)05748-1.
40. Altschul SF, Gish W, Miller W, Myers EW, Lipman DJ.1990. Basic local alignment search tool. J Mol Biol215:403– 410.http://dx.doi.org/10.1016 /S0022-2836(05)80360-2.
41. Harmsen D, Dostal S, Roth A, Niemann S, Rothganger J, Sammeth M, Albert J, Frosch M, Richter E.2003. RIDOM: comprehensive and public sequence database for identification ofMycobacteriumspecies. BMC In-fect Dis3:26.http://dx.doi.org/10.1186/1471-2334-3-26.
42. Naiser T, Kayser J, Mai T, Michel W, Ott A.2008. Position dependent mismatch discrimination on DNA microarrays– experiments and model. BMC Bioinformatics9:509.http://dx.doi.org/10.1186/1471-2105-9-509. 43. van Ingen J.2013. Diagnosis of nontuberculous mycobacterial infections.
Semin Respir Crit Care Med34:103–109.http://dx.doi.org/10.1055/s-0033 -1333569.
44. Mazumder SA, Hicks A, Norwood J. 2010.Mycobacterium gordonae pulmonary infection in an immunocompetent adult. N Am J Med Sci 2:205–207.
45. Arnow PM, Bakir M, Thompson K, Bova JL.2000. Endemic contami-nation of clinical specimens byMycobacterium gordonae. Clin Infect Dis 31:472– 476.http://dx.doi.org/10.1086/313940.
46. Bespyatykh JA, Zimenkov DV, Shitikov EA, Kulagina EV, Lapa SA, Gryadunov DA, Ilina EN, Govorun VM.2014. Spoligotyping of Myco-bacterium tuberculosiscomplex isolates using hydrogel oligonucleotide microarrays. Infect Genet Evol26C:41– 46.http://dx.doi.org/10.1016/j .meegid.2014.04.024.
Zimenkov et al.