Detection of Swine Hepatitis E Virus in Fecal Samples
Priscilla F. Gerber,a,bChao-Ting Xiao,aDianjun Cao,cXiang-Jin Meng,cTanja Opriessniga,d
Department of Veterinary Diagnostic and Production Animal Medicine, College of Veterinary Medicine, Iowa State University, Ames, Iowa, USAa; Laboratório de Pesquisa em Virologia Animal, Departamento de Medicina Veterinária Preventiva, Escola de Veterinária, Universidade Federal de Minas Gerais, Belo Horizonte, Brazilb; Department of Biomedical Sciences and Pathobiology, Center for Molecular Medicine and Infectious Diseases, College of Veterinary Medicine, Virginia Polytechnic Institute and State University, Blacksburg, Virginia, USAc; The Roslin Institute and The Royal (Dick) School of Veterinary Studies, University of Edinburgh, Midlothian, United Kingdomd
Hepatitis E virus (HEV) is a major cause of acute viral hepatitis in people in many developing countries and is also endemic in
many industrialized countries. Mammalian HEV (mHEV) isolates can be divided into at least four recognized major genotypes.
Several nucleic acid amplification techniques have been developed for mHEV detection, with great differences in sensitivity. The
aim of this study was to compare the performances of two singleplex real-time reverse transcriptase (RT) PCR assays for broad
detection of all four mHEV genotypes (assays A and B) and two duplex real-time RT-PCR assays for detection and differentiation
of mHEV genotypes 3 and 4 (assays C and D). RNAs extracted from 28 fecal samples from pigs experimentally inoculated with
HEV genotype 3 and 186 fecal samples from commercial pigs with unknown HEV exposure were tested by all four assays. In
ex-perimental samples, HEV RNA was detected in 96.4% (assay A), 39.2% (assay B), 14.2% (assay C), and 0% (assay D) of the
sam-ples. In field samples with unknown HEV exposure, HEV RNA was detected in 67.2% (assay A), 36.4% (assay B), 1.1% (assay C),
and 0.5% (assay D) of the samples. The assays showed overall poor agreement (
ⴝ
0.19 to 0.03), with differences in detection
rates between assays (
P
<
0.01). Assays A and B, which broadly detect HEV genotypes 1 to 4, had significantly higher detection
rates for HEV RNA than the duplex assays C and D, which were both designed to detect and differentiate between HEV
geno-types 3 and 4.
H
epatitis E virus (HEV) is the causative agent of hepatitis E in
humans (
1
). HEV infection in pregnant women may cause
particularly severe illness, with a mortality rate of 10 to 20%, and
recently, there have been numerous reports of persistent and
chronic HEV infection in immunocompromised patients, such as
organ transplant recipients (
2
). Currently, HEV is classified in the
genus
Hepevirus
in the family
Hepeviridae
(
3
). The virus is a
non-enveloped, positive-sense, single-stranded RNA virus that carries
three open reading frames (ORFs). ORF1 encodes nonstructural
proteins, ORF2 encodes the viral capsid, and ORF3, which
over-laps with ORF2, encodes a multifunctional small protein (
3
).
HEV has been identified in several animal species, including
domestic pigs, chickens, deer, wild boars, mongooses, rabbits,
rats, ferrets, bats, and fish (
4
), and based on the host tropism, the
strains genetically identified thus far can be clustered into
mam-malian HEV (mHEV), avian HEV (aHEV), and piscine HEV
(pHEV) strains. Within mHEV, there are at least four recognized
genotypes capable of infecting humans. Genotypes 1 and 2 are
associated with epidemics and restricted to humans in developing
countries, whereas genotypes 3 and 4 can infect a wide variety of
species, including humans and pigs, and are associated with
spo-radic and cluster cases of human hepatitis E in both developing
and industrialized countries (
2
). While mHEV genotype 3 has
worldwide distribution (
5
), genotype 4 was reported in Asia (
5
)
and more recently in Europe (
6
,
7
). In humans, infections with
genotypes 1 and 2 are mainly transmitted via consumption of
water contaminated with feces, while infections with genotypes 3
and 4 appear to occur primarily by food-borne zoonotic
transmis-sion through the consumption of raw or undercooked meat from
pigs, wild boars, or deer (
4
).
Due to its implication in public health and pork safety, several
nucleic acid amplification techniques and immunoassays have
been developed for mHEV detection; however, a reliable
diagnos-tic procedure for mHEV is still needed (
1
,
8
). Serological studies
comparing immunoassays widely used for mHEV diagnosis found
2.9- to 6.5-fold variation in anti-HEV antibody detection rates
(
9–11
), and only two of six commonly available IgM anti-HEV
detection assays had sensitivities and specificities above 95% (
11
).
Due to this overall low sensitivity, a combination of antibody
de-tection and nucleic acid dede-tection has been suggested for
optimiz-ing mHEV diagnosis (
12
,
13
).
Considering the heterogeneity of mHEV strains circulating in
humans and other animal species, several conventional reverse
transcriptase (RT) PCR and real-time RT-PCR assays have been
developed for the detection of HEV RNA in various types of
sam-ples, including sera, feces, and environmental samples (
14–19
).
Comparisons of RT-PCR assays have shown a 10- to 1,000-fold
variation in sensitivity when samples were tested in parallel in the
same laboratory (
20
,
21
). In a blinded study to investigate the
performance of conventional and real-time RT-PCR assays in 20
laboratories that performed HEV RNA detection on a regular
ba-sis, variations in sensitivity on the order of 100- to 1,000-fold were
found using a standard panel of HEV genotype 3 and 4 strains
(
12
). Currently, a real-time RT-PCR designed in 2006 (
17
) is the
Received6 November 2013Returned for modification26 November 2013
Accepted8 January 2014
Published ahead of print15 January 2014
Editor:Y.-W. Tang
Address correspondence to Tanja Opriessnig, [email protected].
Copyright © 2014, American Society for Microbiology. All Rights Reserved.
doi:10.1128/JCM.03118-13
on May 16, 2020 by guest
http://jcm.asm.org/
most widely used assay for detection of HEV infection in humans
(
12
,
22
), primarily based on the reported high sensitivity (limit of
detection, 4 genome equivalents [GE] of the HEV genome) and its
ability to detect all four recognized mHEV genotypes that are
ca-pable of infecting humans (
23
).
Although real-time RT-PCR assays targeting conserved
re-gions can provide accurate detection of the HEV genomes and
yield results more rapidly than conventional RT-PCR, commonly,
a second molecular method, such as sequencing or subtyping, is
required to further characterize strains. Recently, a real-time
du-plex RT-PCR assay for detection and identification of HEV
geno-types 3 and 4 in amounts as small as 50 GE copies per reaction has
been reported (
24
). This assay, targeting the ORF2-ORF3 overlap
region, was designed to allow sensitive and rapid detection of the
zoonotic HEV genotypes to potentially facilitate epidemiological
investigations and to better understand outbreak situations. The
aim of this study was to compare the performances of two
single-plex real-time RT-PCR assays for broad detection of all 4
recog-nized mHEV genotypes (assays A and B) and two duplex real-time
RT-PCR assays for detection and differentiation of mHEV
geno-types 3 and 4 (assays C and D). One singleplex and one duplex
real-time RT-PCR assay had been previously described (
17
,
24
),
while the other assays were developed in-house.
MATERIALS AND METHODS
Experimental samples.The experimental protocol was approved by the Virginia Polytechnic and State University Institutional Animal Care and Use Committee and by the Virginia Polytechnic and State University In-stitutional Biosafety Committee. Twenty-eight serial fecal samples were collected daily from two pigs experimentally inoculated with human HEV genotype 3 strain US-2 (GenBank accession numberAF060669) or swine HEV genotype 3 strain Meng (GenBank accession numberAF082843) from 2 to 14 days postinoculation (p.i.). The fecal samples were suspended in saline (10% [wt/vol]), and the fecal suspensions were stored at⫺80°C until use.
Field samples.A total of 186 pig fecal samples were chosen arbitrarily from routine diagnostic cases submitted during May 2013 to the Iowa
State University Veterinary Diagnostic Laboratory (ISU-VDL). These samples originated on 86 farms located in 12 U.S. states: Iowa, Illinois, Indiana, Minnesota, Missouri, North Carolina, North Dakota, Nebraska, Ohio, South Dakota, Texas, and Wisconsin. The fecal samples were ob-tained from different age groups of pigs: suckling (1 to 2 weeks of age), nursery (3 to 7 weeks of age), and grow-finish (8 to 25 weeks of age) pigs. Sample processing and RNA extraction.Fecal samples of⬃1 g were resuspended in phosphate-buffered saline (PBS), vigorously vortexed, and centrifuged at 1,500⫻gfor 10 min to obtain a final 10% (wt/vol) fecal suspension in PBS. Viral RNA extraction was carried out on 50l of the fecal suspension using a MagMax 96 Viral Isolation kit (Ambion, Foster City, CA, USA) according to the manufacturer’s instructions on an auto-mated extraction platform (KingFisher Flex; Thermo Fisher Scientific). Negative controls, using DNA- and RNA-free sterile water as a sample, and positive controls, using fecal suspensions from pigs experimentally infected with either mHEV genotype 3 or 4, were added to each extraction plate. The extracted RNA was stored at⫺80°C until use.
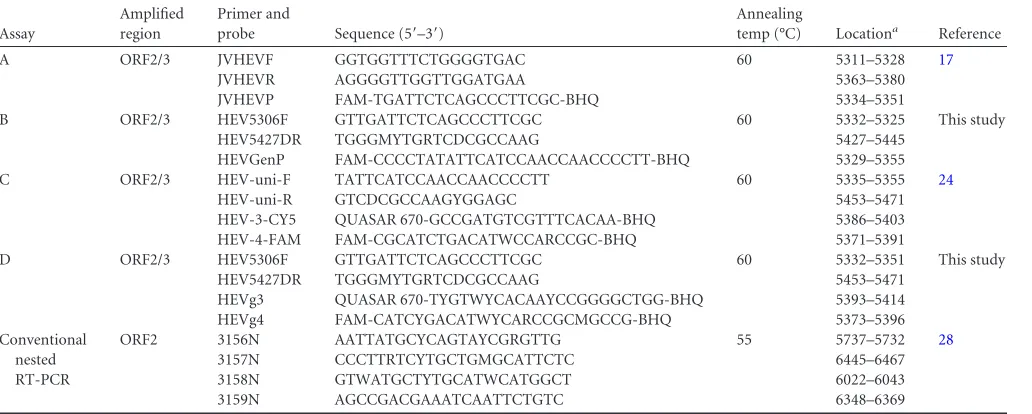
Primers and probes.All the primers and probes used in this study are listed inTable 1. The primers and probes from assays B and D developed in this study were designed manually based on a multiple-sequence align-ment of mHEV genotypes 1 to 4 in GenBank. The sequences were aligned using CLUSTAL W within DNASTAR (Lasergene 8). Specifically, a pair of primers (HEV5606F/HEV5427DR) and a probe (HEVGenP) located in the conserved ORF2-ORF3 overlap region and broadly reactive with mHEV genotypes 1 to 4 were selected (assay B). Additionally, probes specific for the detection of mHEV genotype 3 or 4 (HEVg3 and HEVg4; assay D) were selected in the same region. Oligonucleotide primers/ probes were analyzed for the absence of possible hairpins and dimers by Primer Express software (version 3.0; Applied Biosystems).
[image:2.585.41.557.78.285.2]Construction of plasmid DNA standards for the real-time RT-PCRs. Plasmid DNA standards were constructed by amplifying a genomic region at nucleotide positions 5311 to 5471 of a genotype 3 human HEV strain (US-2) (25) and a region at nucleotide positions 5285 to 5445 of a geno-type 4 human HEV strain (TW6196E) (26) using primers JVHEVF and HEV5427DR (described inTable 1). Conventional RT-PCRs were carried out in a total volume of 20l using the Qiagen OneStep RT-PCR kit (Qiagen, Valencia, CA, USA) according to the manufacturer’s recom-mendations. Purified PCR products were cloned into the pGEM-T Vector (Promega, Madison, WI, USA) and transfected into Escherichia coli TABLE 1Primers and probes used in this study
Assay
Amplified region
Primer and
probe Sequence (5=–3=)
Annealing
temp (°C) Locationa Reference
A ORF2/3 JVHEVF GGTGGTTTCTGGGGTGAC 60 5311–5328 17
JVHEVR AGGGGTTGGTTGGATGAA 5363–5380
JVHEVP FAM-TGATTCTCAGCCCTTCGC-BHQ 5334–5351
B ORF2/3 HEV5306F GTTGATTCTCAGCCCTTCGC 60 5332–5325 This study
HEV5427DR TGGGMYTGRTCDCGCCAAG 5427–5445
HEVGenP FAM-CCCCTATATTCATCCAACCAACCCCTT-BHQ 5329–5355
C ORF2/3 HEV-uni-F TATTCATCCAACCAACCCCTT 60 5335–5355 24
HEV-uni-R GTCDCGCCAAGYGGAGC 5453–5471
HEV-3-CY5 QUASAR 670-GCCGATGTCGTTTCACAA-BHQ 5386–5403
HEV-4-FAM FAM-CGCATCTGACATWCCARCCGC-BHQ 5371–5391
D ORF2/3 HEV5306F GTTGATTCTCAGCCCTTCGC 60 5332–5351 This study
HEV5427DR TGGGMYTGRTCDCGCCAAG 5453–5471
HEVg3 QUASAR 670-TYGTWYCACAAYCCGGGGCTGG-BHQ 5393–5414
HEVg4 FAM-CATCYGACATWYCARCCGCMGCCG-BHQ 5373–5396
Conventional nested RT-PCR
ORF2 3156N AATTATGCYCAGTAYCGRGTTG 55 5737–5732 28
3157N CCCTTRTCYTGCTGMGCATTCTC 6445–6467
3158N GTWATGCTYTGCATWCATGGCT 6022–6043
3159N AGCCGACGAAATCAATTCTGTC 6348–6369
aNucleotide positions are in accordance with GenBank accession numberAF060669, except for the HEV genotype 4 probes, which are in accordance with GenBank accession
numberHQ634346.
on May 16, 2020 by guest
http://jcm.asm.org/
TOP10 bacteria (Invitrogen, Foster City, CA, USA) following the instruc-tions in the cloning kit manual. Sequencing was performed on recombi-nant plasmids in both directions using the AB 3730xl DNA Analyzer (Ap-plied Biosystems, Foster City, CA, USA) at the Iowa State University DNA Facility (Ames, IA, USA). The recombinant plasmid stocks were quanti-fied using the NanoDrop ND-1000 spectrophotometer according to the manufacturer’s instructions (NanoDrop Technologies Inc., Wilmington, DE, USA) and converted into genome copy numbers. The total numbers of genome copies in the plasmid stock were calculated as follows: copy number ⫽ [(concentration of linearized plasmid)/(molar mass)] ⫻ (6.023⫻1023). The plasmid DNA was used to generate standard curves
using 101to 108GE copies of plasmid. The GE titers of HEV were
deter-mined based on the standard curve.
Real-time RT-PCR assays.The real-time RT-PCRs were carried out in 96-well plates using the TaqMan One-Step RT-PCR Master Mix Reagent (Applied Biosystems, Foster City, CA, USA) in a 25-l volume comprising 5l of extracted RNA and 20l of master mix according to the manufac-turers’ recommendation. All four assays (Table 1) were performed on the same day, and the same nucleic acid extracts were utilized. Singleplex assay B, capable of detecting mHEV genotypes 1 to 4, and duplex assay D, capable of detecting and differentiating mHEV genotypes 3 and 4, both utilized the same forward and reverse primers. The concentrations of the primers and probe or probes (duplex assays) were 400 and 200 nM for assay A, 800 and 200 nM for assay B, 400 and 200 nM for assay C, and 800 and 400 nM for assay D. One-step RT-PCR amplification was performed on an ABI 7500 real-time PCR instrument (Applied Biosystems, Foster City, CA, USA) under the following conditions: 15 min at 50°C for the RT reaction, 10 min at 95°C followed by 45 cycles at 95°C for 15 s for dena-turation, and 60°C for 45 s for annealing and extension. A sample was considered negative if the cycle threshold (CT) wasⱖ41 amplification cycles. Quality control of the real-time RT-PCR process included negative (nuclease-free water) and positive (HEV RNA and HEV plasmid DNA) controls added to each PCR plate.
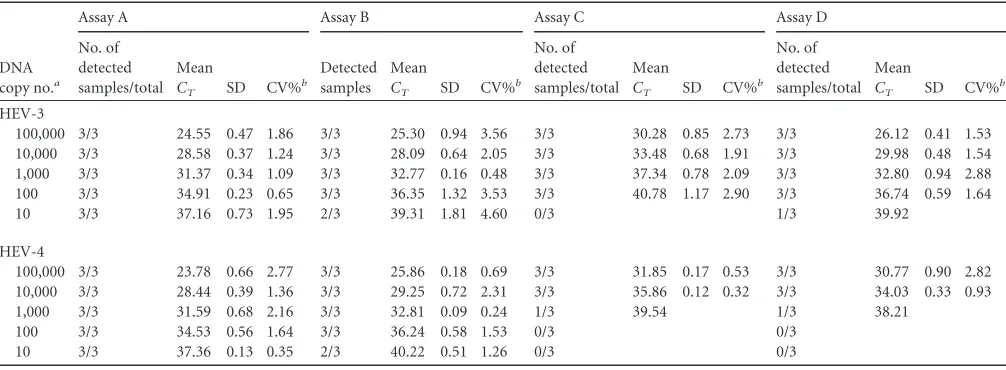
Efficiency, limit of detection, and intra-assay and interassay preci-sion of the RT-PCR assays.Verifications of assay sensitivity, specificity, and precision were performed as proposed previously (27). Standard curves of mHEV genotypes 3 and 4 ranging from 101to 108copies of HEV
plasmid DNA were used to determine the efficiency, limit of detection, and intra-assay and interassay precision of the real-time PCR assays. For assays A and B, which do not differentiate HEV genotypes, standard curves for genotypes 3 and 4 were tested separately. For assays C and D, which differentiate between HEV genotypes 3 and 4, the standard curves were tested as duplex assays or separately in singleplex assays. The ampli-fication efficiency (E) for each assay was calculated according to the fol-lowing formula to determine the performance of quantitative PCR (qPCR):E⫽[10⫺1/S]⫺1, whereSindicates the slope of the regression line. The limit of detection of each assay and the intra-assay variation were assessed with the standard curves tested in triplicate. The limit of detec-tion was specified as the smallest amount of DNA standard that could be detected with 100% probability. The interassay variation was determined by three independent runs of the standard curves in triplicate.
Conventional nested RT-PCR.Twenty field samples tested by all four real-time PCR assays that presented discrepant results, defined as a sample that exhibited a positive result in one assay but a negative result in another assay, were arbitrarily chosen for sequencing confirmation using a nested RT-PCR assay based on a partial HEV ORF2 fragment. Conventional nested RT-PCRs were performed using previously described primers (28) (Table 1). Briefly, for the first PCR, 6M (each) primers 3156N and 3157N and a Qiagen OneStep RT-PCR kit (Qiagen, Valencia, CA, USA) were used. The thermal cycler conditions for the first reaction were as follows: 50°C for 30 min; 95°C for 15 min; 35 cycles of 94°C for 30 s, 55°C for 30 s, and 72°C for 1 min; and a final elongation step at 72°C for 10 min. The second reaction was performed with 0.2M (each) primers 3158N and 3159N and ReadyMixTaqPCR Mix (Sigma-Aldrich, St. Louis, MO, USA). The thermal cycler conditions for the second PCR were as follows:
95°C for 5 min; 35 cycles at 94°C for 30 s, 55°C for 30 s, and 72°C for 30 s; and a final elongation step at 72°C for 7 min. The 348-bp second-round PCR products were visualized after electrophoresis on a 1% agarose gel.
Sequencing and phylogenetic analysis.Sequencing of PCR products from HEV RNA-positive samples was performed directly on both strands at the Iowa State University DNA Facility, Ames, IA, USA. The sequences were aligned with published data using BLAST at the National Center for Biotechnology Information (NCBI) (http://www.ncbi.nlm.nih.gov/). The sequences were compiled using Lasergene software and the Clustal W alignment algorithm (DNAStar, Madison, WI, USA). The nucleotide dis-tance of the sequences was evaluated by neighbor joining (NJ) using La-sergene MegAlign. Confidence in the NJ tree was estimated by bootstrap replicates.
Statistical analysis.Inter- and intra-assay variances were computed using theCTvalues, standard deviations, and coefficients of variation of the standard curves. The variance was analyzed by a one-way repeated-measures analysis of variance, followed by Bonferroni’s test for pairwise comparison. Cochran’s Q test for matched data, followed by McNemar’s test for pairwise comparisons, was used to determine whether the propor-tions of RT-PCR-positive samples were significantly different between assays. Differences between groups were considered significant if theP
value was⬍0.05. A kappa index was performed to determine the agree-ment of positive and negative results between assays. The strength of agreement was scored as follows, as previously described (37):ⱕ0, poor; 0.01 to 0.2, slight; 0.21 to 0.4, fair; 0.41 to 0.60, moderate; 0.61 to 0.80, substantial; and 0.81 to 1, almost perfect. Statistical analyses were per-formed using SAS version 9.2 (SAS Institute, Inc., Cary, NC, USA).
Nucleotide sequence accession numbers.The sequences reported in this paper have been deposited in the GenBank database under accession numbersKF719308toKF719310.
RESULTS
For assays C and D, which differentiate between HEV genotypes 3
and 4, there was no difference between the standard curves tested
as duplex or singleplex assays regarding PCR efficiency, limits of
detection, and intra- or interassay precision; therefore, only the
results of the duplex assays are presented. A purine-pyrimidine
mismatch was identified in the probes used to detect HEV
geno-type 4 for both assays C (base 19) and D (base 17) compared to the
strain used as a control (5389 C/A in the virus/probes).
Evaluation of real-time RT-PCR assays.
Standard curves were
established for each real-time PCR assay using the HEV genotype
3 and 4 DNA controls serially diluted from 1
⫻
10
8to 1
⫻
10
1copies and amplified in triplicate. The efficiency, regression
coef-ficient, slope, and intercept for each assay are shown in
Table 2
.
Assays A and B had similar performance regardless of the HEV
genotype used, while assays C and D showed a decrease in
effi-ciency of at least 11% when HEV genotype 4 was used (
Table 2
).
Limit of detection and inter- and intra-assay precision of the
four real-time PCR assays.
For each assay, interassay precision
was assessed by calculating the standard deviation and coefficient
of variation of the
C
Tobtained for each standard dilution tested in
three independent runs, and the coefficient of variation was found
to be
⬍
7% for all assays (data not shown). Intra-assay precision
was assessed by calculating the standard deviation and coefficient
of variation of the
C
Tobtained for each standard dilution tested in
triplicate, and the coefficient of variation was found to be
⬍
4%
(
Table 3
). The limit of detection of each assay was specified as the
lowest recognized concentration of genotype 3 or 4 mHEV DNA
control serially diluted from 1
⫻
10
5to 1
⫻
10
1in triplicate (
Table
3
). However, the GE copy numbers do not reflect the number of
RNA molecules, since the efficiency of the RT reaction was not
directly determined.
on May 16, 2020 by guest
http://jcm.asm.org/
Variation of detection limits was in the order of 10- to
1,000-fold among assays. Assay A was able to detect 10
1GE copies of the
plasmid HEV DNA per reaction (4
⫻
10
3copies ml
⫺1), assay B
detected all 10
2-GE-copy dilutions (4
⫻
10
4copies ml
⫺1) and
occasionally the 10
1-GE-copy dilution, and assays C and D were
able to detect all HEV DNA standards down to the 10
4-GE-copy
dilutions (4
⫻
10
6copies ml
⫺1) (
Table 3
). An impact of the HEV
genotype was observed for assays C and D, which could detect all
10
2-GE-copy dilutions of genotype 3 but only 1 of 3 10
3-GE-copy
dilutions of genotype 4. Assay A and B detection was genotype
independent.
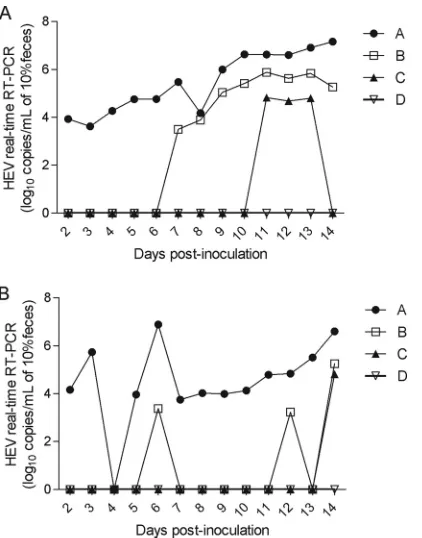
Detection of HEV RNA in experimental samples with known
mHEV exposure by the four real-time RT-PCR assays.
Detection
of mHEV RNA in experimental samples evaluated in parallel
us-ing the same RNA extracts is shown in
Fig. 1
. The GE titers of
mHEV were determined from the HEV genotype 3 standard curve
included in each run and for each assay. Considering RNA
detec-tion over time, assay A presented the highest rate of cumulative
positive detection (96.4%; 27/28) (
P
⬍
0.05), followed by assay B
(39.2%; 11/28), which presented a positive detection rate higher
than those of assays C (14.2%; 4/28) and D (0/28) (
P
⬍
0.05). The
detected viral-RNA loads ranged from 3.62 to 7.16 log
10HEV GE
copies ml
⫺1in 10% fecal samples for assay A; from 3.22 to 5.26
log
10HEV GE copies ml
⫺1in 10% fecal samples for assay B, and
from 4.68 to 4.81 log
10HEV GE copies ml
⫺1for assay C (
Fig. 1
). In
order to further investigate the reason for the low detection rates
found with assay C and the lack of detection of any positive sample
with assay D, the primer and probe sequences from each assay were
compared to the genome sequence of each of the HEV strains used.
Mismatches were not identified for any primer or probe (data not
shown), indicating that the detection rates achieved were due to
in-trinsic differences in the limits of detection for each assay.
[image:4.585.41.546.78.166.2]Detection of HEV RNA in field samples with unknown
mHEV exposure by each of the four real-time RT-PCR assays.
The rates of HEV RNA detection with the four assays on field
samples are summarized in
Table 4
. The overall detection rates of
HEV RNA-positive samples regardless of age were 67.2% (125/
186) for assay A, 36.4% (68/136) for assay B, 1.1% (2/136) for
assay C, and 0.5% (1/136) for assay D. The assays showed overall
poor agreement (
⫽
0.19 to 0.03), with differences in detection
rates between assays (
P
⬍
0.01). Assay A presented the highest
HEV RNA detection rate (
P
⬍
0.01). All positive samples with
assays C and D were also positive with assays A and B. Regarding
positive samples with assay B, 80.8% (55/68) were also positive by
assay A, indicating that assay B identified an additional 7.0% (13/
186) positive samples that were not identified by assay A.
How-ever, assay A identified an additional 37.6% (70/186) positive
samples that were not identified by assay B (
⫽
0.19;
P
⬍
0.01).
Further evaluation of 20 field samples with discrepant results
among real-time RT-PCR assays.
Twenty samples with
C
Tvalues
TABLE 2Efficiency, regression coefficient, slope, and intercept for real-time PCR assays A, B, C, and D
Variable
Valuea
A B C D
HEV-3 HEV-4 HEV-3 HEV-4 HEV-3 HEV-4 HEV-3 HEV-4
Efficiency (%) 95.9 98.7 88.2 90.7 95.6 82.1 93.3 82.3
Regression coefficient 0.992 0.99 0.991 0.992 0.990 0.993 0.990 0.991
Slope ⫺3.422 ⫺3.352 ⫺3.641 ⫺3.565 ⫺3.433 ⫺3.843 ⫺3.493 ⫺3.833
Intercept 42.7 42.1 43.0 42.4 47.82 50.88 43.6 48.7
aThe values were obtained by quantification of serially diluted plasmid DNA containing a HEV genotype 3 (HEV-3) or 4 (HEV-4) ORF2 and ORF3 overlapping region from 1⫻
108
to 1⫻101
copies of genome equivalents per reaction.
TABLE 3Limits of detection of four real-time PCR assays and intra-assay precision results of 10-fold dilutions of HEV genotype 3 or 4 DNA plasmid controls tested in triplicate
DNA copy no.a
Assay A Assay B Assay C Assay D
No. of detected samples/total
Mean
CT SD CV%b
Detected samples
Mean
CT SD CV%b
No. of detected samples/total
Mean
CT SD CV%b
No. of detected samples/total
Mean
CT SD CV%b
HEV-3
100,000 3/3 24.55 0.47 1.86 3/3 25.30 0.94 3.56 3/3 30.28 0.85 2.73 3/3 26.12 0.41 1.53
10,000 3/3 28.58 0.37 1.24 3/3 28.09 0.64 2.05 3/3 33.48 0.68 1.91 3/3 29.98 0.48 1.54
1,000 3/3 31.37 0.34 1.09 3/3 32.77 0.16 0.48 3/3 37.34 0.78 2.09 3/3 32.80 0.94 2.88
100 3/3 34.91 0.23 0.65 3/3 36.35 1.32 3.53 3/3 40.78 1.17 2.90 3/3 36.74 0.59 1.64
10 3/3 37.16 0.73 1.95 2/3 39.31 1.81 4.60 0/3 1/3 39.92
HEV-4
100,000 3/3 23.78 0.66 2.77 3/3 25.86 0.18 0.69 3/3 31.85 0.17 0.53 3/3 30.77 0.90 2.82
10,000 3/3 28.44 0.39 1.36 3/3 29.25 0.72 2.31 3/3 35.86 0.12 0.32 3/3 34.03 0.33 0.93
1,000 3/3 31.59 0.68 2.16 3/3 32.81 0.09 0.24 1/3 39.54 1/3 38.21
100 3/3 34.53 0.56 1.64 3/3 36.24 0.58 1.53 0/3 0/3
10 3/3 37.36 0.13 0.35 2/3 40.22 0.51 1.26 0/3 0/3
a
Number of plasmid DNA copies per reaction. bCV%, coefficient of variation.
on May 16, 2020 by guest
http://jcm.asm.org/
[image:4.585.41.544.523.708.2]lower than 36 on the real-time RT-PCR assay were arbitrarily
se-lected for amplification with a conventional nested RT-PCR assay,
followed by sequencing to further verify the results (
Table 5
).
Twelve of 20 samples positive in at least one real-time RT-PCR
assay were also positive in the nested RT-PCR, and 3/12 samples
that were successfully sequenced were determined to be mHEV
genotype 3 (GenBank accession no.
KF719308
,
KF719309
, and
KF719310
) (
Table 5
).
DISCUSSION
In this study, two singleplex real-time RT-PCR assays for
detec-tion of all four known mammalian HEV genotypes without
dif-ferentiation and two duplex real-time RT-PCR assays for
detec-tion and differentiadetec-tion of HEV genotypes 3 and 4 were evaluated.
All the assays were compared on the same real-time RT-PCR
in-strument on the same day, using the same RT-PCR enzymes,
stan-dard curves, and nucleic acid extracts. Under these conditions,
singleplex assays A and B, designed to broadly detect HEV
geno-types 1 to 4, showed significantly better performance (
P
⬍
0.01)
than duplex assays C and D, which both allow detection and
dif-ferentiation of HEV genotypes 3 and 4. On field samples, the
singleplex real-time RT-PCR assays detected at least 34-fold more
positive samples than the duplex real-time RT-PCR assays.
The design of a broadly reactive assay for detection of mHEV
genotypes is a complex and challenging task due to the
heteroge-neity among the various HEV strains (
5
,
29
). The sensitivities of
real-time assays can vary widely depending on the target region
and HEV genotype (
20
,
21
). Previous comparison of conventional
and real-time RT-PCR assays to detect HEV RNA have shown that
targeting a more conserved region, such as ORF2/3, appears more
reliable than the use of degenerate primers and probes targeting a
less conserved region, such as ORF2 (
20
,
21
,
30
). In this study, all
the real-time RT-PCR assays used target the overlap region of
ORF2 and ORF3; however, with the exception of assay A, the
assays used degenerate primers and probes. Degeneracies may
re-duce the sensitivity and specificity of an assay due to factors such
FIG 1Comparison of four real-time RT-PCR assays (A, B, C, and D) in [image:5.585.62.273.65.334.2]detecting and quantifying HEV RNA on fecal samples after experimental in-oculation of pigs with HEV genotype 3 strain US-2 (A) or Meng (B).
TABLE 4Detection rates for HEV RNA in fecal samples collected from pigs of unknown HEV status by real-time RT-PCR assays A, B, C, and D
Age group No. tested
No. (%) positivea
A B
C D
HEV-3 HEV-4 HEV-3 HEV-4
Suckling 46 25 (54.3) A 17 (36.9) A 0 B 0 B 0 B 0 B
Nursery 86 62 (72.0) A 24 (27.9) B 0 C 0 C 0 C 0 C
Grow-finish 54 38 (70.3) A 27 (49.1) B 2 (3.6) C 0 C 1 (1.8) C 0 C
Total 186 125 (67.2) A 68 (36.4) B 2 (1.1) C 0 C 1 (0.5) C 0 C
[image:5.585.298.546.86.341.2]aDifferent uppercase letters within each column indicate significant differences (P⬍0.05) within assays.
TABLE 5Detection of HEV RNA by conventional nested RT-PCR and real-time RT-PCR assays in 20 pig field samples
Sample
Detectiona
Real-time RT-PCR assay Conventional
nested RT-PCR
A B C D
19482 ⫺ 35.69 ⫺ ⫺ ⫹(w)
19702-C ⫺ 36.18 ⫺ ⫺ ⫹(w)
19714 ⫺ 36.00 ⫺ ⫺ ⫹(w)
19762-B 33.02 34.46 ⫺ ⫺ ⫹b
19775 36.97 ⫺ ⫺ ⫺ ⫺
19913 33.04 35.51 33.62 ⫺ ⫹b
19903-A ⫺ 35.63 ⫺ ⫺ ⫺
19912-B 36.06 ⫺ ⫺ ⫺ ⫹(w)
19955 37.41 36.06 ⫺ ⫺ ⫺
20354-A 35.99 38.99 ⫺ ⫺ ⫺
20361-A 36.40 ⫺ ⫺ ⫺ ⫹
20383-B 36.39 33.32 ⫺ ⫺ ⫺
20513 36.13 ⫺ ⫺ ⫺ ⫺
20517 36.88 ⫺ ⫺ ⫺ ⫹
20613 ⫺ 36.78 ⫺ ⫺ ⫹(w)
20467-E 36.59 38.05 ⫺ ⫺ ⫹
20468-D 36.31 37.84 ⫺ ⫺ ⫹b
20777-B 36.52 35.86 ⫺ ⫺ ⫺
20792-B 37.23 36.46 ⫺ ⫺ ⫹(w)
20855 35.93 ⫺ ⫺ ⫺ ⫺
a⫺, HEV RNA-negative sample;⫹, HEV RNA-positive sample; w, weak reaction.
b
HEV genotype 3 by sequencing.
on May 16, 2020 by guest
http://jcm.asm.org/
[image:5.585.43.545.619.716.2]as a lower effective concentration of each primer or difficulties
in estimating the suitable annealing temperatures and primer
lengths (
31
), which could partially explain the poor results
achieved with assays B, C, and D compared with assay A in the
present study. Analysis of the full-length genomes of various
hu-man and animal mHEV strains revealed that the HEV genomes
vary even in the conserved regions (
5
,
29
), and this genetic
vari-ability complicates reliable detection of different mHEV
geno-types and subgeno-types. In fact, recent studies found polymorphisms
in the region of the probe-binding site of the most widely used
real-time RT-PCR assay for HEV detection (assay A) (
17
), and a
modification of the probe and subsequent increase of the melting
temperature restored detection of the polymorphic strains (
22
,
23
). Employment of more than one set of primers targeting
dif-ferent regions of the HEV genome could increase the likelihood of
HEV detection (
30
). The same strategy has been used for detection
of other highly variable RNA viruses, such as influenza A virus
(
32
) and porcine reproductive and respiratory syndrome virus
(PRRSV) (
33
,
34
).
The best PCR performance on experimental samples was
ob-served for assay A (27/28), followed by assays B (11/28) and C
(4/28). Assay D could not detect a single positive sample. In PCR
comparisons similar to those presented here, assay A was
deter-mined to be the most suitable, reproducible, and reliable assay for
the detection of HEV RNA (
12
,
20
,
21
). It is well recognized that
fecal samples, such as those used in this study, could contain
met-abolic compounds that possibly interfere with RT-PCR. The
ad-dition of an internal control to monitor the presence of such
in-hibitors would ensure the reliability of negative results. Although
such a control was not included in this study, all assays used the
same nucleic acid extracts, and issues with the viral-RNA
extrac-tion recovery can therefore be excluded. No mismatch could be
found for any primer or probe compared to the mHEV strains
used to infect the pigs, indicating that the detection rates achieved
were due to intrinsic differences in the limits of detection for each
assay. Moreover, it is worth noting that the singleplex assay B and
the duplex assay D developed in the present study used the same
primer pair, and the difference in the positive detection rates
be-tween them (11/28 versus 0/28;
P
⬍
0.01) are likely due to the
differences in the nucleotide compositions of the targeted regions
of the probes.
HEV genome variability may also influence the quantification
of its RNA. Comparison of the analytical sensitivities of the assays
based on the detection of the plasmid DNA standards showed that
the sensitivities of assays A and B were independent of the HEV
genotype (3 or 4), and assay A was 10-fold more sensitive than
assays B, C, and D based on genotype 3 standard curve detection.
However, the sensitivities of assays C and D for HEV genotype 4
were 100-fold lower than the sensitivities yielded by using HEV
genotype 3 within the same assay, which could be partially
ex-plained by a single mismatch in the probe region. Although a
study has reported that probes with up to two mismatches showed
little variation in PCR efficiency and nucleic acid quantification
compared to probes that were fully complementary (
35
), another
study has shown that a single mismatch in the probe-binding
re-gion resulted in a quantification error of up to 33% (
36
). Due to
the use of plasmid DNA for quantification, reverse transcription
reaction, as one of the crucial steps of RT-PCR, was dismissed, and
the limit of detection presented here cannot be fully compared to
assays in which there is use of RNA standards.
In summary, real-time RT-PCR assays A and B, which broadly
detect HEV genotypes 1 to 4, showed better results for RNA
de-tection than the duplex assays C and D, which were both designed
to detect and differentiate between HEV genotypes 3 and 4. Assay
A presented the overall best performance among the tested assays.
REFERENCES
1.Purcell RH, Emerson SU.2008. Hepatitis E: an emerging awareness of an old disease. J. Hepatol.48:494 –503.http://dx.doi.org/10.1016/j.jhep.2007 .12.008.
2.Kamar N, Bendall R, Legrand-Abravanel F, Xia NS, Ijaz S, Izopet J, Dalton HR.2012. Hepatitis E. Lancet379:2477–2488.http://dx.doi.org /10.1016/S0140-6736(11)61849-7.
3.Meng XJ, Anderson D, Arankalle VA, Emerson SU, Harrison TJ, Jameel S, Okamoto H.2012. Hepeviridae, p 1021–1028.InKing AMQ, Adams MJ, Carstens EB, Lefkowitz EJ (ed), Virus taxonomy: 9th Report of the International Committee on Taxonomy of Viruses. Academic Press, Lon-don, United Kingdom.
4.Meng XJ.2013. Zoonotic and foodborne transmission of hepatitis E virus. Semin. Liver Dis.33:41– 49.http://dx.doi.org/10.1055/s-0033-1338113. 5.Lu L, Li C, Hagedorn CH.2006. Phylogenetic analysis of global hepatitis
E virus sequences: genetic diversity, subtypes and zoonosis. Rev. Med. Virol.16:5–36.http://dx.doi.org/10.1002/rmv.482.
6.Colson P, Romanet P, Moal V, Borentain P, Purgus R, Benezech A, Motte A, Gerolami R.2012. Autochthonous infections with hepatitis E virus genotype 4, France. Emerg. Infect. Dis.18:1361–1364.http://dx.doi .org/10.3201/eid1808.111827.
7.Hakze-van der Honing RW, van Collie E, Antonis AF, van der Poel WH.2011. First isolation of hepatitis E virus genotype 4 in Europe through swine surveillance in the Netherlands and Belgium. PLoS One 6:e22673.http://dx.doi.org/10.1371/journal.pone.0022673.
8.Kumar S, Subhadra S, Singh B, Panda BK.2013. Hepatitis E virus: the current scenario. Int. J. Infect. Dis.17:e228 – e233.http://dx.doi.org/10 .1016/j.ijid.2012.11.026.
9.Wenzel JJ, Preiss J, Schemmerer M, Huber B, Jilg W. 2013. Test performance characteristics of Anti-HEV IgG assays strongly influence hepatitis E seroprevalence estimates. J. Infect. Dis.207:497–500.http://dx .doi.org/10.1093/infdis/jis688.
10. Rossi-Tamisier M, Moal V, Gerolami R, Colson P.2013. Discrepancy between anti-hepatitis E virus immunoglobulin G prevalence assessed by two assays in kidney and liver transplant recipients. J. Clin. Virol.56:62– 64.http://dx.doi.org/10.1016/j.jcv.2012.09.010.
11. Drobeniuc J, Meng J, Reuter G, Greene-Montfort T, Khudyakova N, Dimitrova Z, Kamili S, Teo CG.2010. Serologic assays specific to immu-noglobulin M antibodies against hepatitis E virus: pangenotypic evalua-tion of performances. Clin. Infect. Dis.51:e24 – e27.http://dx.doi.org/10 .1086/654801.
12. Baylis SA, Hanschmann KM, Blumel J, Nubling CM.2011. Standard-ization of hepatitis E virus (HEV) nucleic acid amplification technique-based assays: an initial study to evaluate a panel of HEV strains and inves-tigate laboratory performance. J. Clin. Microbiol.49:1234 –1239.http://dx .doi.org/10.1128/JCM.02578-10.
13. Huang S, Zhang X, Jiang H, Yan Q, Ai X, Wang Y, Cai J, Jiang L, Wu T, Wang Z, Guan L, Shih JW, Ng MH, Zhu F, Zhang J, Xia N.2010. Profile of acute infectious markers in sporadic hepatitis E. PLoS One 5:e13560.http://dx.doi.org/10.1371/journal.pone.0013560.
14. Legrand-Abravanel F, Mansuy JM, Dubois M, Kamar N, Peron JM, Ros-taing L, Izopet J.2009. Hepatitis E virus genotype 3 diversity, France. Emerg. Infect. Dis.15:110 –114.http://dx.doi.org/10.3201/eid1501.080296. 15. Enouf V, Dos RG, Guthmann JP, Guerin PJ, Caron M, Marechal V,
Nicand E.2006. Validation of single real-time TaqMan PCR assay for the detection and quantitation of four major genotypes of hepatitis E virus in clinical specimens. J. Med. Virol. 78:1076 –1082. http://dx.doi.org/10 .1002/jmv.20665.
16. Ahn JM, Rayamajhi N, Gyun KS, Sang YH. 2006. Comparison of real-time reverse transcriptase-polymerase chain reaction and nested or commercial reverse transcriptase-polymerase chain reaction for the detec-tion of hepatitis E virus particle in human serum. Diagn. Microbiol. Infect. Dis.56:269 –274.http://dx.doi.org/10.1016/j.diagmicrobio.2006.04.010. 17. Jothikumar N, Cromeans TL, Robertson BH, Meng XJ, Hill VR.2006.
A broadly reactive one-step real-time RT-PCR assay for rapid and
on May 16, 2020 by guest
http://jcm.asm.org/
tive detection of hepatitis E virus. J. Virol. Methods131:65–71.http://dx .doi.org/10.1016/j.jviromet.2005.07.004.
18. Meng J, Dai X, Chang JC, Lopareva E, Pillot J, Fields HA, Khudyakov YE. 2001. Identification and characterization of the neutralization epitope(s) of the hepatitis E virus. Virology288:203–211.http://dx.doi .org/10.1006/viro.2001.1093.
19. Gyarmati P, Mohammed N, Norder H, Blomberg J, Belak S, Widen F. 2007. Universal detection of hepatitis E virus by two real-time PCR assays: TaqMan and Primer-Probe Energy Transfer. J. Virol. Methods146:226 – 235.http://dx.doi.org/10.1016/j.jviromet.2007.07.014.
20. Ward P, Poitras E, Leblanc D, Letellier A, Brassard J, Plante D, Houde A.2009. Comparative analysis of different TaqMan real-time RT-PCR assays for the detection of swine Hepatitis E virus and integration of Feline calicivirus as internal control. J. Appl. Microbiol.106:1360 –1369.http: //dx.doi.org/10.1111/j.1365-2672.2008.04104.x.
21. Mokhtari C, Marchadier E, Haim-Boukobza S, Jeblaoui A, Tesse S, Savary J, Roque-Afonso AM.2013. Comparison of real-time RT-PCR assays for hepatitis E virus RNA detection. J. Clin. Virol.58:36 – 40.http: //dx.doi.org/10.1016/j.jcv.2013.06.038.
22. Baylis SA, Blumel J, Mizusawa S, Matsubayashi K, Sakata H, Okada Y, Nubling CM, Hanschmann KM.2013. World Health Organization In-ternational Standard to harmonize assays for detection of hepatitis E virus RNA. Emerg. Infect. Dis.19:729 –735.http://dx.doi.org/10.3201/eid1905 .121845.
23. Garson JA, Ferns RB, Grant PR, Ijaz S, Nastouli E, Szypulska R, Tedder RS.2012. Minor groove binder modification of widely used TaqMan probe for hepatitis E virus reduces risk of false negative real-time PCR results. J. Virol. Methods 186:157–160. http://dx.doi.org/10.1016/j .jviromet.2012.07.027.
24. Zhang X, Li A, Shuai J, Dai Y, Zhu Z, Wu S, He Y.2013. Validation of an internally controlled multiplex real time RT-PCR for detection and typing of HEV genotype 3 and 4. J. Virol. Methods193:432– 438.http://dx .doi.org/10.1016/j.jviromet.2013.07.007.
25. Schlauder GG, Dawson GJ, Erker JC, Kwo PY, Knigge MF, Smalley DL, Rosenblatt JE, Desai SM, Mushahwar IK.1998. The sequence and phy-logenetic analysis of a novel hepatitis E virus isolated from a patient with acute hepatitis reported in the United States. J. Gen. Virol.79:447– 456. 26. Feagins AR, Opriessnig T, Huang YW, Halbur PG, Meng XJ. 2008.
Cross-species infection of specific-pathogen-free pigs by a genotype 4 strain of human hepatitis E virus. J. Med. Virol.80:1379 –1386.http://dx .doi.org/10.1002/jmv.21223.
27. Rabenau HF, Kessler HH, Kortenbusch M, Steinhorst A, Raggam RB, Berger A.2007. Verification and validation of diagnostic laboratory tests
in clinical virology. J. Clin. Virol.40:93–98.http://dx.doi.org/10.1016/j.jcv .2007.07.009.
28. Huang FF, Haqshenas G, Guenette DK, Halbur PG, Schommer SK, Pierson FW, Toth TE, Meng XJ.2002. Detection by reverse transcrip-tion-PCR and genetic characterization of field isolates of swine hepatitis E virus from pigs in different geographic regions of the United States. J. Clin. Microbiol. 40:1326 –1332. http://dx.doi.org/10.1128/JCM.40.4.1326-1332 .2002.
29. Smith DB, Purdy MA, Simmonds P.2013. Genetic variability and the classification of hepatitis E virus. J. Virol.87:4161– 4169.http://dx.doi.org /10.1128/JVI.02762-12.
30. Vasickova P, Kralik P, Slana I, Pavlik I.2012. Optimisation of a triplex real time RT-PCR for detection of hepatitis E virus RNA and validation on biological samples. J. Virol. Methods 180:38 – 42.http://dx.doi.org/10 .1016/j.jviromet.2011.12.007.
31. Rose TM, Henikoff JG, Henikoff S. 2003. CODEHOP (COnsensus-DEgenerate Hybrid Oligonucleotide Primer) PCR primer design. Nucleic Acids Res.31:3763–3766.http://dx.doi.org/10.1093/nar/gkg524. 32. Hoffmann B, Harder T, Lange E, Kalthoff D, Reimann I, Grund C,
Oehme R, Vahlenkamp TW, Beer M.2010. New real-time reverse trans-criptase polymerase chain reactions facilitate detection and differentiation of novel A/H1N1 influenza virus in porcine and human samples. Berl. Munch. Tierarztl. Wochenschr.123:286 –292.
33. Wernike K, Hoffmann B, Dauber M, Lange E, Schirrmeier H, Beer M. 2012. Detection and typing of highly pathogenic porcine reproductive and respiratory syndrome virus by multiplex real-time RT-PCR. PLoS One 7:e38251.http://dx.doi.org/10.1371/journal.pone.0038251.
34. Kleiboeker SB, Schommer SK, Lee SM, Watkins S, Chittick W, Polson D.2005. Simultaneous detection of North American and European por-cine reproductive and respiratory syndrome virus using real-time quanti-tative reverse transcriptase-PCR. J. Vet. Diagn. Invest.17:165–170.http: //dx.doi.org/10.1177/104063870501700211.
35. Yao Y, Nellaker C, Karlsson H.2006. Evaluation of minor groove bind-ing probe and Taqman probe PCR assays: influence of mismatches and template complexity on quantification. Mol. Cell Probes 20:311–316.
http://dx.doi.org/10.1016/j.mcp.2006.03.003.
36. Süß B, Flekna G, Wagner M, Hein I.2009. Studying the effect of single mismatches in primer and probe binding regions on amplification curves and quantification in real-time PCR. J. Microbiol. Methods76:316 –319.
http://dx.doi.org/10.1016/j.mimet.2008.12.003.
37. Landis JR, Koch GG.1977. An application of hierarchical kappa-type statistics in the assessment of majority agreement among multiple observ-ers. Biometrics33:363–374.