SERVICE DIFFERENTIATED CALL ADMISSION CONTROL
IN NEXT GENERATION WIRELESS NETWORKS
1CH. SREENIVASA RAO, 2K.CHENNA KESHAVA REDDY AND 3D. SRINIVASA RAO
1
Professor, Department of ECE, ACE Engineering College, Hyderabad. 2
Professor and Principal, Bharat Engineering College, Hyderabad. 3
Professor and Head, Department of ECE, JNTU CE, Hyderabad
E-mail: [email protected]
ABSTRACT
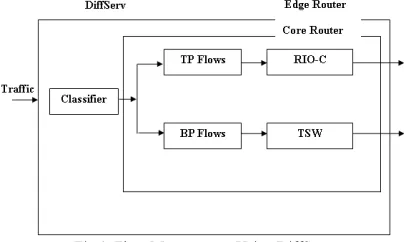
In wireless network, real time flows are prioritized over non-real time flows. Because of this prioritization, non-real time flows endures starvation. Furthermore, real time flows are handled quite generally as no specification is given to emergency flows. To consider all these difficulties, we propose a service differentiated call admission control mechanism for next generation wireless networks. Initially, flows are classified into Transmission Priority flow (TP) and Bandwidth Priority flow (BP) using DiffServ model. TP flows denote real time flows and BP belongs to non-real time flows. Further, both TP and BP flows are again categorized into sub flows based on delay and bandwidth constraints respectively. TP flows are controlled by RIO-C queuing mechanism and BP flows are handled by Time Sliding Window (TSW) algorithm. RIO-C assigns different dropping level for each sub flows and operates independently. On the other hand, TSW manage the BP flows by controlling their packet-sending rate. Thus, our mechanism lessens the starvation of non real time flows and handles emergency calls effectively. By simulation, we prove the efficiency of our mechanism.
Keywords:Wireless Network, Transmission Priority flow (TP), Call Admission Control (CAC), Quality of Service (QoS).
1. INTRODUCTION
1.1 Call Admission Control
The call admission control (CAC) mechanism manages the resources to all intents and purposes. It is a dominant radio resource management technique in the wireless networks. It reduces the call blocking probability in wireless network by optimizing the utilization of the radio resources. [1] further, CAC controls the congestion by lessening the number of calls and plays a prominent role in assuring quality of service (QoS). [2]
1.2 Wireless Network Traffic
In general, wireless network transmits mixture of traffic such as voice and video traffic, which requires stringent delay constraints and bulk data streaming traffic that necessitates only long-term throughput requirements. [3] In Differentiated Services (DiffServ) architecture, the priority queueing principle plays a prominent role to classify and prioritize packets into number of traffic classes. Different traffic classes with their priority are handled independently. [4]
Network traffic suffers from various performance demands due to the speedy development of telecommunication networks. Obviously, assuring Quality of Service (QoS) to all kinds of network traffic is an important task. [5] Network traffic can generally be distinguished into real time traffic and data traffic. Of the two, real time traffic requires stringent low delays and data traffic requires low packet loss constraints. [5]
1.3 Service Differentiation
Traffic services in wireless network are broadly classified into five classes of services. [6] They are ordered below in the direction of their priority. [7]
Unsolicited Grant Service (UGS)
The UGS service holds up real time data streams, which periodically generates static size data packets. T1/E1 and voice over internet protocol (VoIP) without silence suppression are some of the examples for UGS services.
ISSN: 1992-8645 www.jatit.org E-ISSN: 1817-3195
The real-time data stream that periodically generates variable size data packet such as Moving picture expert group (MPEG) video and streaming audio are included in rtPS.
Non-real time polling service (nrtPS)
The nrtPS is modeled to support delay tolerant application. It requires minimum reserved traffic rate. This service type makes use of multicast and broadcast polling mechanisms.
Extended real-time polling service (ertPS)
This is a hybrid polling service that combines the efficacy of both UGS and rtPS services. It transports real time data streams that generate VBR traffic.
Best effort (BE)
The BE service is a non-deterministic traffic and it is not sensitive to any QoS requirements. Web surfing can be taken as a best example for BE service type.
The need for Service Differentiation is more emerging task in the wireless networks. However, there exist more challenges in differentiating services. Some of the challenges are described below,
Since, the real time service requires stringent delay bounds; the network scheduler must be capable to differentiate the service based on delay constraint. In addition, scheduling information must include the QoS details of real time services. [8]
Diverse range of applications has different QoS requirements and each packet should be treated accordingly. This makes service differentiation more complicated task. [9]
The traditional approach prioritizes the real time traffic at the cost of data traffic to provision QoS. This brings in starvation of data traffic and may degrade network performance. [3]
1.4 Problem Identification and Solution
In our previous work [10], we have proposed QoS Based Adaptive Admission Controller (QAAC) for wireless networks. In that, we have classified the service request into two types as new or handoff calls. Flows are prioritized into two types as transmission priority (TP) and bandwidth priority (BP) flows.
To avoid the starvation of non real time packets, we have proposed admission control strategy. In
that, if a number of TP packets exceed some threshold value, then TP packets will be dropped. To avoid this challenging situation and to differentiate real time and non real time flows into more specific services, in this paper we propose a mechanism for call admission control using differentiated service (Diffserv) in wireless networks.
2. RELATED WORK
Suong H. Nguyen et al. [3] have proposed two-phase scheme. First, they have proposed a scheme called “proportional tradeoff” which provides better service for both traffic types, by judicious choice of CWmin and TXOP limit for the two ACs. Second, they have used a game theoretic model. Their proposed scheme does not eliminate data users’ incentive to use the real time class, despite providing better service for data users than the default EDCA parameters. Hence, their scheme is modified by reducing the data class’s CWmin slightly to give throughput-sensitive applications the incentive to use the bulk-data service. This modification is called “proportional incentive adjusted” or “PIA”.
Xiaolong Jin et al. [4] have extended the well-known Empty Buffer Approximation (EBA) method, which was widely used for modeling priority queueing systems under only two traffic flows but they have used with multi-class traffic. Further, they have developed a novel queue decomposition approach to isolate the original priority queueing system into a group of equivalent single-server single-queue (SSSQ) systems. Using the Large Derivation Principle and the extended Empty Buffer Approximation, they have derived the service capacities of individual SSSQ systems and presented the analytical upper and lower bounds for the queue length distributions of individual traffic flows.
Dimitrios Komnakos et al. [8] have proposed a Delay Aware Channel Prioritization (DACP) criterion, which is optimized for real-time services. Furthermore, they have also proposed ACP-based packet Scheduler (DACP-S). Their scheduler is able to manage the Enhanced Dedicated Channel’s (E-DCH) dynamically. DACP calculation is based on the packet delay of the real time flows at each UE and its sensitivity can be fine-tuned through a system-defined variable. In their approach, the service priority can also be controlled through the level of QoS differentiation parameter (k) between ongoing connections.
Stylianos Dimitriou et al. [9] have proposed a new scheme to differentiate service based on packet size. Their scheme is based on the axiom that ‘different types of applications typically utilize different packet sizes’. Their classification is based on binary classification. A buffer almost full of big packets should be able to accommodate and serve a small packet; however, as more small packets arrive, less small packets should be favored at the expense of the bigger packets. By their scheme, small sized packets can benefit and transmit on higher rates, increasing the total system fairness.
Jingui Xie et al. [11] have proposed a multi-class priority queueing system with customer transfers that occur only from lower priority queues to higher priority queues. According to their approach, conditions for the queueing system to be stable/ unstable are obtained. Further, they have introduced an auxiliary queueing system, for which an explicit product-form solution is found for the stationary distribution of queue lengths.
3. SERVICE DIFFERENTIATED CALL ADMISSION CONTROL
3.1 Overview
In this paper, we propose a service differentiated call admission control mechanism for next generation wireless networks. By this mechanism, flows that enter the network are made pass through the DiffServ model. The classifier differentiates the flow into two types as Transmission Priority (TP) flows and Bandwidth Priority (BP) flows. TP flows denote real time flows and BP belongs to non-real time flows. TP flows are further divided into interactive voice (TP s1) and interactive video (TP s2) flows based on their delay constraint. BP flows are classified into two as bulk data transfers (BP s1) and streaming data (BP s2) as per their bandwidth requirements. TP flows are handled by RIO-C queue management algorithm and BP flows are
[image:3.595.305.507.223.344.2]controlled by Time Sliding Window (TSW) mechanism. RIO-C assigns different dropping level for each sub flows and operates independently. On the other hand, TSW manage the BP flows by controlling their packet-sending rate. In BP flows, when a flow does not obtain its minimum required bandwidth, then the network status is intimated to the user by sending network status message.
Fig 1. Flow Management Using DiffServ
3.2 Diffserv Model
Quality of Service (QoS) can be guaranteed in IP networks through the DiffServ model. The DiffServ model differentiates the traffic into various traffic classes with accurate priorities. Among differentiated classes, the best effort (BE) class has the lowest priority. Other classes can be termed as QoS classes. During packet scheduling, the traffic class that has high priority obtains QoS assured network service than the low priority classes. Each DiffServ node regulates the packet dropping and queuing characteristics. [12]
DiffServ model encompass of the classifier and traffic conditioner. The classifier classifies the flow as one of the QoS services. The traffic conditioner consists of meter, marker, shaper and dropper. The meter measures the traffic flow according to traffic conditioning agreement (TCA) and the marking scheme marks the state of the packet. The shaper shapes the flow corresponding to service level agreement (SLA) and then drop or forward the packet based on network status. [13]
3.3 Service Classification
Flows that enter the network are made pass through the DiffServ model. The edge router classifies the flow as either Transmission Priority (TP) queue or Bandwidth Priority (BP) queue. Here, TP flows denote real time flows and BP belongs to non-real time flows.
ISSN: 1992-8645 www.jatit.org E-ISSN: 1817-3195
Transmission priority (TP) flows are further classified into two types as interactive voice (TP s1) and interactive video (TP s2) based on delay constraint. Each packet is traffic conditioned by Multiple Average Multiple Threshold (MAMT) active queue management approach. [14] TP flows are handled and implemented using RED with In/Out and Coupled virtual Queues (RIO-C).
Each packet of TP flow is marked with dropping probability by the edge router. MAMT sets up dropping function separately for both TP s1 and TP s2. Dropping function is assigned to each class as a function of number of packets in the queue. Thereby, emergency flows are isolated from low priority class flows.
In MAMT, packets are marked red, green and yellow colors. In RIO-C, the virtual queue size of red packet is calculated by summing all the packets in the queue. Further, the queue size of yellow packet is estimated by summing the number of green and yellow packets. The virtual queue (VQ) size of yellow, red, green packets can be estimated using Bernoulli (binomial) distribution.
The probability of virtual queue size of yellow packet (VQy) is shown below, [15]
[
VQ y Q x]
P y= | = =( )
x
y
(
)
y x y g y y
g p p p
p + ) 1− − −
(
(1) Where,
( )
xy is a binomial coefficient, VQ denotes virtual queue, Q represents physical queue and
p
g andp
yare the number of green andyellow packets in VQ.
The probability of virtual queue size of green packet (VQg) is given below,
[
]
( )
( ) (
)
x yg y g x y
g y Q x p p
VQ
P −
− =
=
= | 1 (2)
Virtual queue size of green packet is estimated by considering only green packets. Packet drop probabilities of red, yellow and green packets can be formulated as below, [15]
) ( max 0 x ρ π D Q x dr x r
∑
= = Ρ (3)[
]
max0 1 max 0 | ) ( Q x y y dy Q x x
y π ρ y PVQ y Q x π
D = = = +
Ρ
∑
∑
= −
=
(4)
[
]
max0 1 max 0 | )
( g Q
x y dg Q x x
g π ρ yPVQ y Q x π
D = = = +
Ρ
∑
∑
= −
=
(5)
In equations (3), (4) and (5), the termΡDr, ΡDg
and ΡDy are the dropping probabilities of red,
yellow and green respectively. Qmax is the maximum queue size and
π
x is the stateprobability value.
The overall packet drop probability of RIO-C is symbolized by,
D
Ρ = prΡDr +pyΡDy +pgΡDg (6) The system good put is expressed as below,
(
D)
B
BOUT = 1−Ρ (7)
Using MAMT approach, TP s1 and TP s2 are assigned with different dropping functions and they are handled independently. Priority is given to the emergency flows.
3.3.2 Handling Bandwidth Priority (BP) Queue
Bandwidth Priority (BP) flow is again differentiated into two types as bulk data transfers (BP s1) and streaming data (BP s2) as per their bandwidth requirements. BP s2 includes best effort services. BP flows are traffic conditioned by time sliding window (TSW) marker.
In TSW algorithm, the rate estimator estimates the rate of the packets over a particular time. The rate of a packet is estimated on the basis of received packet size, inter-arrival time and history over a time window.
As per TSW, the packet rate at k- th observation over the time window is measured as below, [16]
Rk = k k T OW S OW R + + −1 (8)
Where, OW is the observation window size, T is inter arrival time of packets and S is the size of the packet.
When the estimated packet rate (Rk) exceeds min TER value, the feedback is sent to the ingress node. On receiving the feedback, the ingress adjusts its sending rate using Additive Increase and Multiplicative Decrease (AIMD) rate control algorithm. [17]
Consider OW interval as a unit of time. For every OW interval, if there is no negative feedback from the rate controller, then the packet-sending rate (R) is increased by,
) 1 (t+
R = R(t)+β
(
R(t))
(9)Where,
β
is the non-increasing factor, it reaches0 as R increases, that is
lim
R→+∞β
(
R
)
=
0
. If) 1 (t+
R =
(
1−μ)
n⋅R(t) (10)In the above equation, n is the number of negative feedbacks and
µ
is a constant parameter, (0<μ<1)Simultaneously, the feedback is also transmitted to the tagger, to mark packets with dropping probability. The probabilistic tagger tags the arriving packets as green, yellow or red. The process of marking is done based on the measured packet rate and two constant parameters namely Committed Information Rate (CIR) and Peak Information Rate (PIR) with the following conditions,
Let R be the estimated packet sending rate Let PIR be the Peak Information Rate Let CIR be the Committed Information Rate Let P be the probability factor
Consider P1 = CIR/ R, P2 = 1- CIR/R, P3 = PIR-CIR and P4 = 1- PIR/R
Case-1
While (0 < R
≤
CIR)Packets are marked as green
Case-2
While (CIR < R
≤
PIR) If (P = P1)Then
The packet is marked as green Else if (P = P2)
Then
The packet is marked as yellow End if
End if
Case-3
While (R > PIR) If (P = P1)
Then
The packet is marked as green Else if (P = P3)
Then
The packet is marked as yellow Else
The packet is marked as red End if
End if
Packets are marked and prioritized according to the above-mentioned conditions. When a flow that belongs to BPs1 and BPs2, does not obtain its minimum required bandwidth (min BW), the scheduler sends network status (NW-MSG) to the corresponding user. The NW-MSG comprehends IP
address of the user, sequence number and residual bandwidth of that path (RBW). The header of NW-MSG is shown below in table-1,
TABLE 1. FORMAT OF NW-MSG IP Address Sequence Number RBW
Algorithm that describes the over all process is shown below,
Algorithm
Step-1: Flows are passed through the DiffServ model
Step-2: The edge router classifies the flow as either TP flow or BP flow
Step-3: The edge router again categorize the TP flow as TP s1 and TP s2 based on their delay constraint
Step-4: The core router manages the TP flow using RIO-C queuing mechanism
Step-5: It assigns separate dropping function for TP s1 and TP s2 and operates accordingly
Step-6: Similarly, the edge router classifies the BP flow as BP s1 and BP s2 according to their bandwidth requirement
Step-7: BP flow is controlled by TSW algorithm
Step-8: Rate estimator of TSW estimates the packet-sending rate (R) of the flow
(8.1) If (R> TER) Then
Feedback is sent to the ingress node and to the tagger
Step-9: The ingress controls the packet-sending rate (R) using AIMD approach
Step-10: Simultaneously, the tagger assigns priority to the packets
Step-11: If BP flow does not obtain its minimum required bandwidth then NW-MSG is sent to the user
4. SIMULATION RESULTS
ISSN: 1992-8645 www.jatit.org E-ISSN: 1817-3195
Fig.2. Simulation Topology
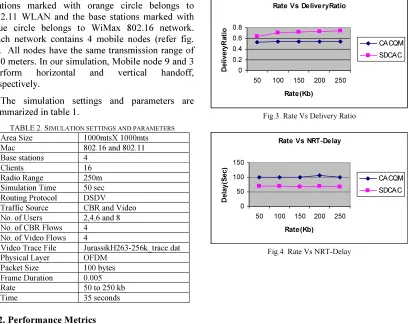
To simulate the proposed scheme, network simulator (NS2) [18] is used. In the simulation, clients (SS) and the base station (BS) are deployed in a 1000 meter x 1000 meter region for 50 seconds simulation time. It consists of 4 base stations among which, 2 are based on 802.16 WiMax and remaining 2 are based on 802.11 WLAN. The base stations marked with orange circle belongs to 802.11 WLAN and the base stations marked with blue circle belongs to WiMax 802.16 network. Each network contains 4 mobile nodes (refer fig. 2). All nodes have the same transmission range of 250 meters. In our simulation, Mobile node 9 and 3 perform horizontal and vertical handoff, respectively.
The simulation settings and parameters are summarized in table 1.
TABLE 2. SIMULATION SETTINGS AND PARAMETERS Area Size 1000mtsX 1000mts Mac 802.16 and 802.11 Base stations 4
Clients 16
Radio Range 250m Simulation Time 50 sec Routing Protocol DSDV Traffic Source CBR and Video No. of Users 2,4,6 and 8 No. of CBR Flows 4 No. of Video Flows 4
Video Trace File JurassikH263-256k_trace.dat Physical Layer OFDM
Packet Size 100 bytes Frame Duration 0.005
Rate 50 to 250 kb
Time 35 seconds
4.2. Performance Metrics
We compare our proposed Service Differentiated Call Admission Control in Next Generation (SDCAC) with the CACQM algorithm for power constrained cellular wireless systems [ ]. We mainly evaluate the performance according to the following metrics:
Throughput: It is the amount of traffic (real time or non-real time) that is received in the destination, represented in Megabits / second.
Delay: It is the average end to end delay occurred at the destination for all flows.
Packet Delivery Ratio: It is the ratio of packets received successfully to the total number of packets sent for both RT and NRT flows.
A. Based on Rate
In the initial experiment, we vary the rate of each traffic flow from 50kb to 250kb and measured the performance for real time (RT) and non-real time (NRT) traffic. In the simulation, both the CBR (NRT) and Video (RT) traffic are used. Among the 8 user requests, there are 4 video flows and 4 CBR flows. There are 4 uplink and 4 downlink flows.
Rate Vs DeliveryRatio
0 0.2 0.4 0.6 0.8
50 100 150 200 250
Rate(Kb)
D
e
li
v
e
ry
R
a
ti
o
CACQM
[image:6.595.97.506.414.738.2]SDCAC
Fig.3. Rate Vs Delivery Ratio
Rate Vs NRT-Delay
0 50 100 150
50 100 150 200 250
Rate(Kb)
Delay
(S
ec
)
CACQM SDCAC
Rate Vs NRT-Throughput
0 5 10 15
50 100 150 200 250
Rate(Kb)
T
h
ro
u
g
h
p
u
t
[image:7.595.84.510.88.619.2]CACQM SDCAC
Fig.5. Rate Vs NRT-Throughput
Rate Vs RT-Delay
0 20 40 60 80
50 100 150 200 250
Rate(Kb)
D
el
a
y(
S
ec) CACQM
SDCAC
Fig.6. Rate Vs RT-Delay
Rate Vs RT-Throughput
0 2 4 6 8 10
50 100 150 200 250
Rate(Kb)
T
h
ro
u
g
h
p
u
t
CACQM
SDCAC
Fig.7. Rate Vs RT-Throughput
From figure 3, we can see that the delivery ratio of our proposed SDCAC is higher than the existing CACQM technique.
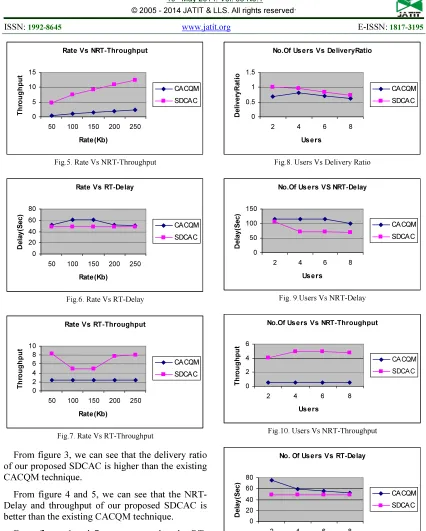
From figure 4 and 5, we can see that the NRT-Delay and throughput of our proposed SDCAC is better than the existing CACQM technique.
From figure 6 and 7, we can see that the RT-Delay and throughput of our proposed SDCAC is better than the existing CACQM technique.
B. Based On Users
In this experiment, the no. of user request (including CBR and Video) is varied from 2 to 8 with the traffic sending rate as 50kb.
No.Of Users Vs DeliveryRatio
0 0.5 1 1.5
2 4 6 8
Users
D
e
li
v
e
ry
R
a
ti
o
CACQM
SDCAC
Fig.8. Users Vs Delivery Ratio
No.Of Us ers VS NRT-Delay
0 50 100 150
2 4 6 8
Users
Delay
(S
ec
)
CACQM SDCAC
Fig. 9.Users Vs NRT-Delay
No.Of Users Vs NRT-Throughput
0 2 4 6
2 4 6 8
Users
T
h
ro
u
g
h
p
u
t
CA CQM
SDCAC
Fig.10. Users Vs NRT-Throughput
No. Of Users Vs RT-Delay
0 20 40 60 80
2 4 6 8
Users
Del
ay(
S
e
c)
CACQM SDCAC
ISSN: 1992-8645 www.jatit.org E-ISSN: 1817-3195
No.Of Users Vs RT-Throughput
0 5 10 15
2 4 6 8
Users
T
h
ro
u
g
h
p
u
t
CACQM SDCAC
Fig.12. Users Vs RT-Throughput
From figure 8, we can see that the delivery ratio of our proposed SDCAC is higher than the existing CACQM technique.
From figure 9 and 10, we can see that the NRT-Delay and throughput of our proposed SDCAC is better than the existing CACQM technique.
From figure 11 and 12, we can see that the RT-Delay and throughput of our proposed SDCAC is better than the existing CACQM technique.
C. Based on Time
In our third experiment we analysis the metrics based on the time.
Tim e Vs NRT-Delay
0 50 100 150
0 6 12 18 24 30
Tim e(Sec)
D
el
ay(
S
e
c)
CACQM
SDCAC
Fig.13. Time Vs NRT-Delay
Tim e Vs NRT-Throughput
0 1 2 3 4 5
0 6 12 18 24 30
Tim e(Sec)
T
h
ro
u
g
h
p
u
t
CACQM
SDCAC
Fig.14. Time Vs NRT-Throughput
Tim e Vs RT-Delay
0 50 100 150
0 6 12 18 24 30
Tim e(Sec)
D
e
la
y
(S
e
c
)
CACQM SDCAC
Fig.15. Time Vs RT-Delay
Tim e Vs RT-Throughput
0 2 4 6 8 10
0 6 12 18 24 30
Tim e(Sec)
T
hr
o
ugh
pu
t
CACQM
SDCAC
Fig.16. Time Vs RT-Throughput
From figure 13 and 14, we can see that the NRT-Delay and throughput of our proposed SDCAC is better than the existing CACQM technique.
From figure 15 and 16, we can see that the RT-Delay and throughput of our proposed SDCAC is better than the existing CACQM technique.
5. CONCLUSION
REFERENCES
[1] Ramesh Babu H.S, Gowrishankar and Satyanarayana P, “An Analytical framework for Call Admission Control in Heterogeneous Wireless Networks”, International Journal of 162 Computer Science and Network Security, (IJCSNS), 2009
[2] Xun Yang, Gang Feng and Chee Kheong Siew, “Call Admission Control for Multi-Service Wireless Networks with Bandwidth Asymmetry between Uplink and Downlink”, IEEE Transactions on Vehicular Technology, pp-360 – 368, 2006
[3] Suong H. Nguyen, Lachlan L. H. Andrew and Hai L. Vu, “Service Differentiation without Prioritization in IEEE 802.11 WLANs”, IEEE 36th Conference on Local Computer Networks (LCN), pp- 109 – 116, 2011
[4] Xiaolong Jin and Geyong Min, “Modelling Priority Queueing Systems with Multi-Class Self-Similar Network Traffic”, IEEE International Conference on Communications, (ICC '07), pp- 550 – 555, 2007
[5] Thomas Demoor, Joris Walraevens, Dieter Fiems, Stijn De Vuyst and Herwig Bruneel, “Influence of Real-Time Queue Capacity on System Contents in Diffserv’s Expedited Forwarding Per-Hop-Behavior”, Journal of Industrial and Management Optimization (JIMO), pp- 587 - 602, Volume 6, Issue 3, 2010.
[6] Sonia Ben Rejeb, Zièd Choukair and Sami
Tabbane, “The CAC Model and QoS
Management in Wireless Multiservice Network”, International Journal on Computer Science and Engineering, ((IJCSE)), Vol. 02, No. 02, pp-333-339, 2010
[7] Samuel K. Falowo and Neco Ventura, “An Efficient Connection Admission Control (CAC) for QoS Provisioning in IEEE 802.16”, Southern Africa Telecommunication Networks and Applications Conference (SATNAC), pp-4-7, 2011.
[8] Dimitrios Komnakos, Dimitrios N. Skoutas,
Demosthenes Vouyioukas and Angelos
Rouskas, “A Delay Optimal Scheduling Policy for Real Time Services in WCDMA Systems”, ACM Journal of Wireless Personal Communications, 2011.
[9] Stylianos Dimitriou, Vassilis Tsaoussidis, “A New Service Differentiation Scheme: Size Based Treatment”, IEEE International Conference on Telecommunications, (ICT 2008), pp- 1 – 5, 2008.
[10] Ch. Sreenivasa Rao, K. Chenna Keshava Reddy, and D. Srinivasa Rao, “QoS Based Adaptive Admission Controller for Next Generation Wireless Networks”, International Journal of Computer Theory and Engineering, 2011
[11] Jingui Xie, Qi-Ming He and Xiaobo Zhao, “On the stationary distribution of queue lengths in a multi-class priority queueing system with customer transfers”, SPRINGER, Queueing Systems, Volume 62, Number 3, pp- 255-277, 2009
[12] Yin Wang, Raimo Kantola and Shuping Liu, “Adding Multi-class Routing into the DiffServ Architecture”, Proceedings of IEEE Systems Communications, 2005
[13] Seyong Park, Kyungtae Kim, Doug C. Kim,
Sunghyun Choi and Sangjin Hong,
“Collaborative QoS Architecture between DiffServ and 802.11e Wireless LAN”, proceedings of the 57th IEEE Semiannual Vehicular Technology Conference, 2003 [14] Manali Joshi, Ajay Mansata, Salil Talauliker
and Cory Beard, “Design and Analysis of Multi-Level Active Queue Management Mechanisms for Emergency Traffic”, ACM Journal Computer Communications, 2005 [15] Rafał Stankiewicz and Andrzej Jajszczyk,
“Analytical models for Multi-RED queues serving as droppers in DiffServ networks”, IEEE Global Telecommunications Conference, (GLOBECOM '07), pp- 2667 – 2671, 2007 [16] Rafal Stankiewicz and Andrzej Jajszczyk,
“Analytical models for DiffServ
Meter/Markers”, IEEE International
Conference on Communications, (ICC’05), pp- 158 – 162, 2005
[17]Yunhong Gu, Xinwei Hong, and Robert L. Grossman “An analysis of AIMD algorithm with decreasing increases", First Workshop on Networks for Grid Applications (Gridnets 2004). CA, USA.2004.
[18] Network Simulator: