Development 139, 1188-1197 (2012) doi:10.1242/dev.073452 © 2012. Published by The Company of Biologists Ltd
INTRODUCTION
Understanding how shape is controlled during development is one of the greatest challenges in developmental biology. Not only do organisms develop into particular shapes according to their species, but some species are able to regenerate organs of the correct size and shape following amputation (Yin and Poss, 2008). How this is achieved largely remains a mystery, but the control of growth, and therefore of shape, has been shown to involve morphogens (Bénazet and Zeller, 2009; Lee et al., 2005; Schwank and Basler, 2010). Morphogens are mobile substances that can elicit the expression of different sets of genes at different concentrations, hence generating spatial patterns of gene expression that can instruct tissue differentiation or alter tissue growth (Schwank and Basler, 2010). Therefore, spatial patterns of gene expression lead to the correct spatial organization of the many cell and tissue types of an organism. As morphogens can affect growth, changes in shape and growth may, in turn, affect morphogen concentration and distribution, thus altering patterning processes.
Simulation modeling provides a way to test hypothetical mechanisms of growth and patterning that would otherwise be difficult to comprehend owing to the highly dynamic nature of development in time and space (Baker et al., 2008; Kondo and Miura, 2010; Meinhardt, 2009). In this paper, we use simulation modeling to explore how growth and patterning might be coordinated through the action of morphogens during the development and regeneration of bony fin rays in the zebrafish (Danio rerio), an emerging model system for the study of bone morphogenesis (Akimenko et al., 2003; Iovine, 2007; Poss et al., 2003).
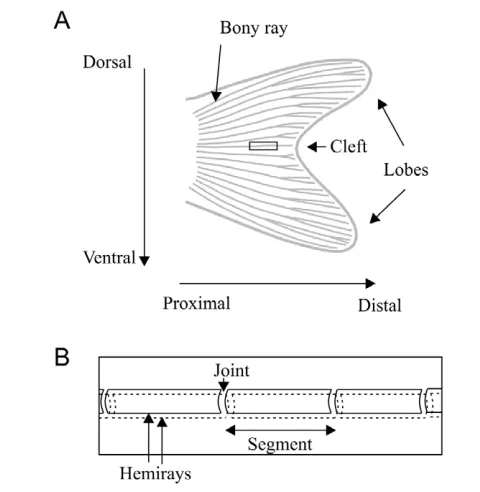
The zebrafish, like most teleost fish studied to date (Wagner and Misof, 1992), grows throughout its life and can regenerate many tissues, including its fin rays (Poss et al., 2003). The zebrafish caudal fin comprises 16 to 18 long dermal bony rays, each of which is composed of two hemirays that face each other (Fig. 1). Bone growth along the proximodistal axis of each ray occurs distally through discrete pulses of cell proliferation (Jain et al., 2007), and growth slows down as the fish ages (Iovine and Johnson, 2000). The caudal fin is bi-lobed (Fig. 1), indicating the lobe rays must grow faster than the rays between the lobes (cleft rays), at least during part of fin development. As a fin develops, each fin ray extends distally through the addition of bone matrix, and distal joint formation gives rise to segments (Haas, 1962) (Fig. 1). Mechanisms underlying fin growth and segment formation have been studied using morphological and genetic analyses (Iovine, 2007; Mari-Beffa and Murciano, 2010).
Upon shortening of the fin through partial amputation, a distal blastema forms, which then allows regeneration to proceed (Akimenko et al., 2003). After amputation, lobe rays regenerate faster than cleft rays (Lee et al., 2005), allowing the fin to regain its pre-amputation size and shape, and then to carry on growing normally. Molecular mechanisms at play during development and regeneration are thought to be similar (Iovine, 2007), although growth during regeneration is faster than ontogenetic growth (Iovine, 2007). The level of amputation has an effect on regeneration rates, as regeneration initially proceeds faster if the fin is cut in proximal positions than if it is cut in more distal positions (Lee et al., 2005). However, a fin cut in a proximal region and a fin cut in a distal region attain the pre-cut fin size in similar amounts of time (Iovine, 2007). At the molecular level, several factors, such as fibroblast growth factors (Fgfs), sonic hedgehog a (Shha) and the bone morphogenetic protein 2b (Bmp2b) have been implicated in distal ray growth (Lee et al., 2005; Quint et al., 2002). In particular, Fgfs have been shown to control rates of cell proliferation in the fin, during both ontogeny (Wills et al., 2008) and regeneration (Lee et al., 2005), and domains of active Fgf signaling and cell proliferation are larger after proximal 1Biology Department, University of Ottawa, Ottawa K1N 6N5, Canada. 2School of
Electrical Engineering and Computer Science, University of Ottawa, Ottawa K1N 6N5, Canada.
*Author for correspondence ([email protected])
Accepted 6 January 2012 SUMMARY
The fact that some organisms are able to regenerate organs of the correct shape and size following amputation is particularly fascinating, but the mechanism by which this occurs remains poorly understood. The zebrafish (Danio rerio) caudal fin has emerged as a model system for the study of bone development and regeneration. The fin comprises 16 to 18 bony rays, each containing multiple joints along its proximodistal axis that give rise to segments. Experimental observations on fin ray growth, regeneration and joint formation have been described, but no unified theory has yet been put forward to explain how growth and joint patterns are controlled. We present a model for the control of fin ray growth during development and regeneration, integrated with a model for joint pattern formation, which is in agreement with published, as well as new, experimental data. We propose that fin ray growth and joint patterning are coordinated through the interaction of three morphogens. When the model is extended to incorporate multiple rays across the fin, it also accounts for how the caudal fin acquires its shape during development, and regains its correct size and shape following amputation.
KEY WORDS: Pattern formation, Zebrafish, Bone development
Morphogen-based simulation model of ray growth and joint
patterning during fin development and regeneration
Anne-Gaëlle Rolland-Lagan1,2,*, Mathieu Paquette1, Valerie Tweedle1and Marie-Andrée Akimenko1
D
E
V
E
LO
P
M
E
N
amputations compared with distal amputations (Lee et al., 2005). It has been proposed that the amount of Fgf signaling depends upon positional information graded along the proximo-distal axis of the fin (Lee et al., 2005), but the mechanism involved is unknown.
Ray segments result from the formation of joints. Segment lengths in zebrafish vary within and between rays (Iovine and Johnson, 2000; Jain et al., 2007), and such variations have also been observed in Trichogaster sumatranus (Haas, 1962). In particular, within a ray, segments are longer in proximal positions than in distal positions (Iovine and Johnson, 2000; Sims et al., 2009), and segments are longer (Haas, 1962) and more numerous in lobe rays compared with cleft rays (Goldsmith et al., 2006). Mutants with altered fin lengths and segment lengths have been identified. In particular, the shortfin (sof) mutant is defective in connexin 43 (Iovine et al., 2005) and displays both shorter fins and shorter segments than does the wild type (Iovine and Johnson, 2000). Connexin 43 is involved in intercellular communication through gap junctions, and has been proposed to be involved in both cell proliferation (Hoptak-Solga et al., 2008; Iovine et al., 2005) and the control of joint location (Sims et al., 2009). On the other hand, the another long fin(alf) mutant (vanEeden et al., 1996) has both longer fins and longer segments than the wild type. The fact that fin length and segment length are both altered in sofand alf mutants suggests that mechanisms controlling fin growth and joint formation are closely related (Sims et al., 2009). However, the long fin(lof) mutant has long fins but only slightly longer segments than wild type (Iovine and Johnson, 2000), and the evx1 mutant, which lacks joints, has an apparently normal fin length (Schulte et al., 2011). Those two latter phenotypes provide evidence that ray growth and joint formation may be uncoupled.
Based on the above qualitative information on growth and joint patterns in caudal fins, we propose a simple plausible model for the control of fin ray growth and regeneration, as well as for joint patterning. The model involves three morphogens and accounts for qualitative data from the literature regarding growth rates during both ontogeny and regeneration, and variations in growth and segment length within and between rays. The model extended to multiple rays also accounts for the regeneration of a properly shaped fin following amputation.
MATERIALS AND METHODS
Modeling software and statistical analysis
Programs for the ray models, as well as programs for model output analysis, were developed using Matlab version R2010b for Windows (The Mathworks, Natick, MA), and are available at http://mysite.science.uottawa.ca/arolland/. Analysis of variance was carried out using SPSS Statistics 19 (IBM corporation, Somers, NY).
Model assumptions and simplifications
Mechanisms of bony fin ray development involve ray growth and regeneration, joint formation and ray bifurcation. Rays can grow and form segments even in the absence of neighboring tissue (Marí-Beffa et al., 1999), whereas grafting experiments have shown that inter-ray tissue is important in the control of ray bifurcation (Murciano et al., 2002). Here, we only consider the mechanisms of ray growth in length and joint pattern formation; hence, we do not need to consider inter-ray tissue. In addition, although rays are composed of two facing hemirays, single hemirays can grow and form segments normally in absence of their facing hemiray (Murciano et al., 2007). Therefore, we decided to consider rays as a whole without making a distinction between the two hemirays. In the present model, we only focus on mechanisms controlling growth along the proximodistal axis of the rays, and ignore growth along the dorsoventral axis of the fin (Fig. 1). Bifurcation formation and growth along the dorsoventral axis of the fin will be examined in separate studies.
In the model implementation, a fin ray is discretized into compartments. Each compartment is treated as if it were a cell, and given an arbitrary length lequal to one (unit length). Compartments are numbered from one at the base of the ray to n at the distal end. However, owing to the large number of cells involved in whole rays, each compartment in reality represents a group of cells.
The control of growth in fins has been shown to involve gradients (Lee et al., 2005). In molecular terms, such gradients could arise from signal transport from cell to cell, and/or from a cell lineage-based mechanism (Wartlick et al., 2009). The fact that the sof mutant, which is defective in the gap-junction protein connexin 43 (Iovine et al., 2005), has shorter fins and shorter ray segments than the wild type (Iovine and Johnson, 2000) indicates that signal transport is important in the control of fin ray growth and joint patterning. The most parsimonious model to simulate transport involves the use of diffusion equations. As pointed out by Kondo and Miura (Kondo and Miura, 2010), even if in complex systems the specific mode of transport at the molecular level might not involve free diffusion, diffusion equations often correctly recapitulate the behavior of the system, which justifies the use of such equations as a simple way to model complex patterning phenomena. For more information on simulation models of pattern formation and growth involving diffusion equations, we refer the reader to the classical models of sea shell patterns (Meinhardt, 2009).
Our model does not explicitly consider the role of the nervous system or the vasculature; however, it has been shown that the nervous system is necessary for a blastema to form following fin amputation in Fundulus
[image:2.612.51.291.58.304.2](Géraudie and Singer, 1985). In the model, this is indirectly taken into account by assuming that a blastema automatically forms following amputation. Regarding the vasculature, recent data show that fin ray pattern formation precedes vascularization in the fin (Huang et al., 2009), indicating that vascularization is not required for initial patterning of the rays. Altered vasculature can affect ray spacing and fin growth (Huang et al., 2009), but as the current model does not address ray spacing mechanisms, it does not involve the vasculature.
Fig. 1. Morphology of the zebrafish caudal fin.(A)A bi-lobed caudal fin showing bony fin rays. The cleft refers to the area of the fin between the two lobes. The black rectangle indicates the area shown in
more detail in B. (B)Detail of a single bony ray, showing the two facing
hemirays, joints and bone segments.
D
E
V
E
LO
P
M
E
N
Model 1: Model of ray growth during fin development and regeneration
Based on the literature, a model of fin ray growth has to account for the following experimental evidence: ray growth along the proximodistal axis of the fin occurs distally (Jain et al., 2007); fins display indeterminate growth, which slows over time (Iovine and Johnson, 2000); upon amputation, regeneration growth occurs and is faster than ontogenetic growth until the fin reaches its pre-cut size (Iovine, 2007); regeneration proceeds faster if the fin is amputated in proximal position (Lee et al., 2005); a fin cut in a proximal region and a fin cut in a more distal region will attain the pre-cut size in a similar amount of time (Iovine, 2007).
Substances affecting growth
As ray growth along the proximodistal axis of the fin occurs distally (Jain et al., 2007), we postulate the presence of a substance, arbitrarily named
G, which acts distally to promote growth during both development and regeneration. We assume an inherent particularity about the distal compartment of a ray, so that Gcan only be produced in that compartment. We model Gtransport using diffusion equations. Ghas a low diffusion constant, and/or high decay rate, which limits growth to the most distal part of the fin.
As growth was experimentally shown to slow down over time (Iovine and Johnson, 2000), it follows that Glevels at the distal end of the ray must decrease as a ray develops and enlarges. At the same time, based on experimental data on regeneration from proximal and distal amputations (Lee et al., 2005), Glevels in the distal part of a ray after amputation must be higher if the amputation is in a proximal part of the fin than if the amputation is more distal. In order to account for such variations in G, another substance is required in the model, which is arbitrarily named X, and is present in decreasing concentrations from ray base to ray tip. X
activates Gproduction in the distal compartment of the ray. In order to account for the fact that regeneration proceeds faster than ontogeny (Haas, 1962; Iovine, 2007), Xlevels have to increase with time (as the fish increases in size and age).
The simplest way to fit the above requirements for Xis to assume that
Xis produced in the proximal compartment (at the base of the fin), at a rate that increases over time, and that Xis transported between compartments. Using diffusion equations and setting a high diffusion constant for Xand/or a low decay rate then allows it to reach the distal compartment and activate
Gproduction.
Note that the range of action of morphogens depends not only on the diffusion constant, but also on the decay rates. Hence, we can manipulate concentration profiles of Gand Xby altering those two parameters (e.g. X
and Gcould both be transported at the same rate but Gmight have a much higher decay rate).
The model operates along one dimension. In the model, each compartment has two neighbors, except for the first and the last compartment. The fluxes of Gand Xcoming into compartment ifrom compartment jper unit time are described using Fick’s law:
where gj,irepresents the flux of Gfrom compartment jto compartment
i, Dgis the diffusion constant ofG, and Gjand Giare concentrations of
Gin compartments jand i, respectively. Similarly, xj,irepresents the flux of Xfrom compartment jto compartment i, Dxis the diffusion constant of X, and Xjand Xiare concentrations of Xin compartmentsj and i, respectively. lis the length between the centers of compartments
jand i, and is constant.
The equations describing the variations in the amounts of Gand Xin a given compartment iduring time interval dtare as follows:
φgj,i=Dg Gj−Gi
l , (1)
φxj,i=Dx Xj−Xi
l , (2)
dGi
dt = −δgGi+ j=1φgj,i
k
∑
if i<n , (3a) dGidt = αgXi− δgGi+ φgj,i if i=n , (3b) with
and
where Gi and Xi are, respectively, the concentrations of G and X in compartment i, gand xare production coefficients for Gand X(Gis only produced in compartment nand Xis only produced in compartment 1). g and xare rates of decay for Gand X. gj,iand xj,irepresent the net fluxes of G and X, respectively, from neighbor compartment jto compartment i
(see Eqns 1 and 2; note that the net flux can be negative, representing outflow from i toj). nis the last compartment in the model, and kis the number of neighbors for compartmenti. The production rate of G in compartment n, gXi, depends on the amount of Xpresent. The production rate of Xin compartment 1, x, increases linearly with time at rate (the initial production rate is x0), until reaching a saturation value xmax(in practice, our chosen value for xmaxis not reached over the course of the simulations).
Implementation of growth
Growth is implemented by considering that each compartment can divide to give rise to two ‘daughter compartments’ of the same size as the mother compartment. In each compartment, G promotes growth/division by increasing the level of a division substance named C. The initial value for
Cin each compartment is C0. The level of Cin a compartment iis subsequently given by:
where Ci is the level of division in compartment i, and Gi is the concentration of G in that compartment. Ci represents how close a compartment is to dividing; therefore, it indirectly represents compartment growth. cCiGiis the rate of production of C, which depends on both Ci and Gi, cis a constant. Unlike Gand X, Cis not a transported substance. For the purpose of this model, growth is considered irreversible, therefore
Cicannot decrease.
Once Ci doubles its initial level (i.e. reaches 2C0), the compartment divides into two compartments. A compartment that is about to divide (mother compartment) will give rise to two daughter compartments, each of the same size as the original mother compartment. This is equivalent to the mother compartment doubling in volume before dividing into two. Therefore, concentrations of X, G(and Sin model 2 below), and levels of Cin each daughter compartment are divided by two compared with concentrations of the mother compartment. The formation and maintenance of the gradients in
Xand G(and Sin model 2) is therefore controlled by transport between compartments, as well as by growth and compartment division.
Amputation
Amputation is implemented by simply removing compartments beyond a user-defined number of compartments at a user-chosen time during the simulation. We then assume that the new distal-most compartment has the specific property that Gcan be produced there. So, we effectively assume the formation of a blastema, as is observed experimentally (Akimenko et al., 2003).
Model 2: Model of ray joint pattern formation during fin development and regeneration
The model of joint pattern formation is built upon the ray growth model. Based on the literature, a model of ray joint formation has to account for the fact that bone segments are added distally (Haas, 1962), and that
dXi
dt = −δxXi+ j=1φxj,i
k
∑
ifi>1 , (4a)dXi
dt = αx(t)− δxXi+ φxj,i if i=1 , (4b)
dαx
dt = β ifαx< αxmax , (4b )′
dαx
dt =0 ifαx = αxmax , (4b )′′
αx(t=0 )= αx0 , (4b )′′′
dCi
dt = αcCiGi , (5)
D
E
V
E
LO
P
M
E
N
segments tend to be smaller towards the distal end of the fin (Haas, 1962; Iovine and Johnson, 2000; Sims et al., 2009). This indicates that new segments formed along a ray are progressively smaller (Jain et al., 2007) as the fin develops.
The phenotypes of lofand evx1 mutants suggest that joint patterning and fin growth may be regulated independently (Iovine and Johnson, 2000; Schulte et al., 2011). Therefore, it is reasonable to assume the presence of a morphogen specifically involved in joint formation. On the other hand, joints in the sof mutant are closer together and fins are shorter than in the wild type, showing that growth and joint formation are closely linked processes (Sims et al., 2009). Hence, the mechanism of joint formation can be linked to the mechanism controlling growth. We tested several hypothetical mechanisms for joint patterning that involve interactions between X, Gand a morphogen that either promotes or inhibits joint formation. Only the most parsimonious model is presented here (examples of outputs for alternative models are briefly presented in supplementary material Fig. S1).
We postulate the existence of a joint-inhibiting substance S. Segment joints are formed in compartments where Sand Gare each below a set threshold. In each compartmenti, at each time step of the simulation, if Si
< and Gi< , a joint is formed. For simplicity, we keep the position of the joint within the compartment abstract and represent it to be in the center of the compartment in which it formed.
Joint formation is irreversible (once a joint has formed, it cannot disappear). The presence of a joint triggers S production, in response to the presence of X. This inhibits joint formation in the vicinity of the newly formed joint (because S concentrations will be above the threshold ).
The equations describing the variations in the amounts of Sin a given compartment iduring time interval dtare as follows:
with
where Siand Xiare the concentrations of S and Xin compartment i, his a production coefficient for S, sis the rate of decay for S. sj,irepresents the flux of Sfrom compartments jto compartment i. Dsis the diffusion constant of S. lis the length between the centers of compartments jand i.
k is the number of neighbors of compartment i.
Experimental procedures for model validation
Two groups (A and B) of 10 wild-type zebrafish aged 167 days and of fin length 5 to 7 mm were amputated at 2 mm (proximal cut, group A) or 4 mm (distal cut, group B) from the fin base and imaged twice a week for 80 days. Fish were kept in water tanks maintained by a linked system with water temperature kept at 28.5°C. During each imaging session, fish were processed one at a time. On the day of amputation (day 0), each fish was processed by taking it out of its water tank, anesthetizing it in a 91.8585
mol tricaine methanosulfate (TMS) solution, imaging its caudal fin before amputation, amputating the fin, imaging the fin again following amputation and finally returning the fish to its water tank where it woke up. Images
dSi
dt = αhXi− δsSi+j=1φsj,i k
∑
if i contains a joint , (6a)dSi
dt = −δsSi+j=1φsj,i
k
∑
if i does not contain a joint , (6b)φsj,i=Ds Sj– Si
[image:4.612.53.288.62.415.2]l . (6c)
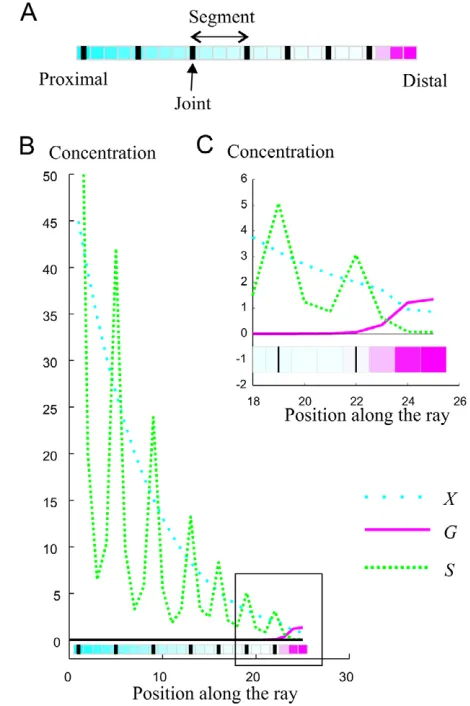
Fig. 2. Sample ray model output.(A)Sample visual output of the model. Squares represent compartments along the ray. Thick black lines
represent joints. The gradient in Xconcentration is shown in cyan, and
the gradient in Gconcentration is shown in magenta (for both Xand G
higher concentrations are represented in a deeper color). (B)Sample
visual output of the model showing concentrations of X, Gand Sfor
each compartment along a ray. The region of the graph within the
black square is enlarged in C. (C)Detail of the concentrations in X, G
and Sat the distal end of a ray. Concentrations are in arbitrary units.
Table 1. Default parameter values and initial conditions
Parameters related to X Default values
x0 5
0.005
Dx 0.9
x 0.01
xmax 100
Parameters related to G
g 1
Dg 0.1
g 0.5
Parameters related to compartment size and division
C0 1
c 0.05
Parameters related toS
Ds 0.3
s 0.8
h 2
Parameters related to joint formation
0.1
0.1
Time step
dt 0.01
Initial conditions: 1 compartment, with X=0, G=0, S=0
D
E
V
E
LO
P
M
E
N
[image:4.612.324.561.480.570.2]were taken using a Canon powershot A640 digital camera mounted on a Zeiss V8 Discovery microscope. After day 0, fish were imaged twice a week for 80 days following the same anesthetizing and imaging procedure as on day 0. Nine fish survived the experiment in group A, and eight fish survived in group B.
Digital images were used to measure fin length above the point of amputation, before amputation and over the course of regeneration, as well as to compare the length of segments cut during amputation before they were amputated and after they regenerated. Measures were taken using custom software written in Matlab (A.-G.R.-L., V. Lefebvre and M.-A.A., unpublished). For each fish, fin length was measured along the third long ray from the ventral side of the fin. For measurements to be accurate, length was measured from a ray joint below the amputation point up until the edge of the fin. The length measured from the image taken just after amputation (length from joint to amputation level) was then subtracted from all length measurements at other time points (including before amputation) to give the length above amputation level. For fish from group A, we also used the image taken just after amputation to identify cut segments, which allowed us to measure cut segment length before amputation and after regeneration using pictures taken before amputation and at day 14 post amputation (all cut segments had regenerated by then).
RESULTS
Single ray model of development and regeneration
[image:5.612.317.549.55.460.2]We simulated fin ray growth and regeneration through the interaction between three morphogens X, Gand S. Only Xand G are involved in the control of ray growth, but all three morphogens are involved directly or indirectly in joint patterning. Xis produced at the base of the fin and its production increases over time. As the most parsimonious model involves diffusion equations, Xhas a long transport range, allowing it to reach the distal compartment (distal tip) of the ray (Fig. 2), where it activates G. Gis responsible for cell proliferation, can only be produced at the distal end of the ray in response to X, and has a short transport range. This limits ray outgrowth to the distal part of the fin, as observed experimentally Fig. 3. Visual output of ray growth and joint formation during development and regeneration. (A-D)Ray development starts with a
single compartment (A), which can produce both Xand Gas it is distal
and proximal at the same time. (B)As growth proceeds, gradients of X
(in cyan) and G(in magenta) emerge, and joint formation starts.
(C,D)Joints form distally (thick black lines) and become closer as the ray
becomes longer. (E-H)Ray after proximal amputation leaving 15
[image:5.612.56.295.60.241.2]compartments (E) or 30 compartments (G) intact, and corresponding regenerated ray (F,H).
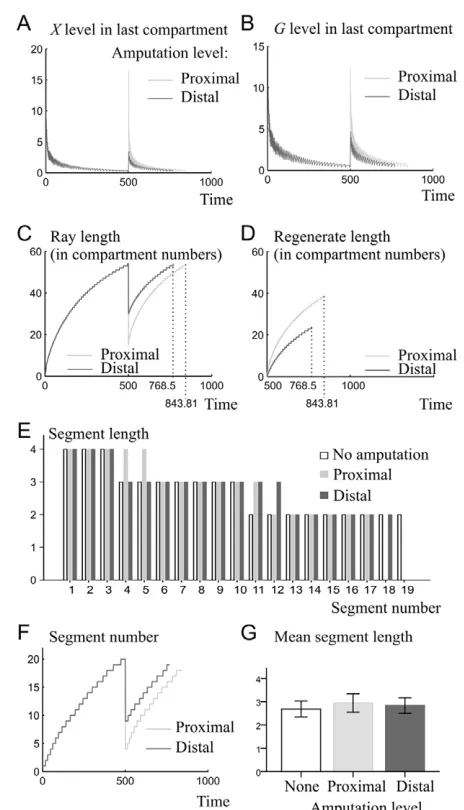
Fig. 4. Comparative analysis of ray development and regeneration. A ray is left to develop until 50,000 simulation steps (corresponding to time 50050,000 simulation steps * dt) and amputated at simulation step 50,001, leaving either 15 (proximal amputation) or 30 (distal amputation) compartments intact. The ray is
then left to regenerate until it reaches the pre-amputation length. (A,B)X
(A) and G(B) concentration in the distal compartment of a ray over time
following a proximal or distal amputation. Note that levels of X(A) and G
(B) oscillate in the distal compartment owing to compartment division: when a compartment divides, each resulting compartment has half of the
amount of X(A) and G(B) that was in the initial compartment. (C)Ray
length (measured in compartment numbers) over time during development and regeneration. Following amputation, the ray cut proximally regenerates faster than the ray cut distally, as shown by the steeper slope of the ray length curve. The differences in growth rates
between the two types of cuts can be seen more clearly in D. (D)Length
of the regenerate over time following proximal or distal amputation. The time at which the ray regains its pre-amputation length is shown in C,D.
(E)Segment length as a function of segment number along a ray for a
non amputated ray after 50,000 simulation steps (white bars), a regenerated ray amputated proximally (light-gray bars), and a regenerated ray amputated distally (dark-gray bars). Segments are
numbered starting at the proximal end of the ray. (F)Segment numbers
over time during development and regeneration. (G)Average segment
lengths pre-amputation or after regeneration. Panels E and G correspond
to rays shown in Fig. 3D,F,H. (A-G)Light gray and dark gray represent the
results from rays amputated in proximal and distal position, respectively.
D
E
V
E
LO
P
M
E
N
(Jain et al., 2007), and Gconcentrations decrease from the distal end of the ray (Fig. 2). When Gconcentration in a compartment is low enough, a joint is formed in that compartment, which triggers the production of joint-inhibiting substance S. Sproduction at a joint ensures that no further joints are formed in the immediate vicinity of that joint. Hence, Gand Stogether control joint spacing. S is produced at joint locations in response to X. As X concentrations decrease from a ray base to its tip, the further a joint is from the ray base, the less Swill be produced at that joint, and the closer the next joint will be (Fig. 2). Hence, X indirectly controls joint spacing, and the interactions between G, Sand X create a pattern of S expression with quasi-periodic peaks of decreasing intensity (Fig. 2). Default parameters for the model as well as initial conditions are given in Table 1.
In order to compare the dynamics of ray growth and segment formation during development and regeneration, we simulated ray development for 50,000 steps (Fig. 3A-D), and at step 50,001 we performed an amputation, leaving either 15 ray compartments intact (proximal amputation, Fig. 3E), or 30 ray compartments intact (distal amputation, Fig. 3G) out of 54 compartments present at step 50,000. In each case, the ray was left to regenerate until it reached the pre-amputation length (Fig. 3F,H).
We found that as growth proceeds, X concentration in the distal compartment decreases (Fig. 4A, before amputation), and therefore Gconcentration in the distal tip also decreases (Fig. 4B). This causes growth to slow down over time (Fig. 4C), as observed experimentally (Iovine and Johnson, 2000). As X concentrations decrease from the proximal to the distal end of the ray (Fig. 2), immediately after amputation time the X concentration in the new distal compartment is higher than the X concentration in the distal compartment before amputation (Fig. 4A). Moreover, as Xproduction increases over time, the distal compartment at a given ray length will be exposed to higher X concentrations during regeneration than during development (supplementary material Fig. S2). High levels of Xin the new distal compartment following amputation give rise to high levels of G (Fig. 4B). Therefore, regeneration growth is faster than ontogenetic growth, which is in agreement with data from the literature (Iovine, 2007).
As levels of Xare highest at the ray base and decrease along the proximodistal axis (Fig. 2B), the blastema of a ray cut in a proximal position is exposed to higher Xlevels than a blastema
in a more distal position (Fig. 4A). Hence, a ray cut proximally initially produces more G(Fig. 4B) than a ray cut distally, and regenerates faster (Fig. 4C,D), as shown by the higher slope of regenerate length as a function of time (Fig. 4D). These results obtained from the model fit with experimental data (Lee et al., 2005). As reported in the literature, rays cut at different levels regain the pre-cut length in similar (but not equal) amounts of time (Fig. 4C,D) (Iovine, 2007), as rays cut proximally re-grow faster but have a larger length to regenerate than rays cut distally. Experimental data on fins amputated in proximal and distal positions (supplementary material Fig. S3) confirm that fins amputated proximally regain their pre-amputation length in a time similar to (but slightly longer than) fins amputated distally, as in the model (Fig. 4C,D). However, we noted that regeneration times varied between samples of each group, and that a few fish from each amputation type did regenerate but did not regain their pre-amputation length over the 80 day period of the experiment.
Segment lengths in intact and regenerated fins decrease from the base of the ray to its tip (Fig. 4E), as seen in real fins (Iovine and Johnson, 2000; Sims et al., 2009), and segment numbers increase over time (Fig. 4F). An analysis of variance of the mean segment lengths in non amputated fins, regenerated fins cut proximally and regenerated fins cut distally showed no statistical differences between the three (df2, F0.519, P0.598, Fig. 4G). Interestingly, new joints at the onset of regeneration are initially further apart than prior to amputation. In particular, segments cut during amputation regenerate to be longer than their original length (Fig. 3D,F,H). To test whether this also happens in real fins, we collected data on the length of segments cut by amputation before amputation and after regeneration (supplementary material Fig. S3). A Wilcoxon signed rank test confirms that in real fins average cut segment length per fish is shorter before amputation than after regeneration [n9, T45, P (one tailed)0.004].
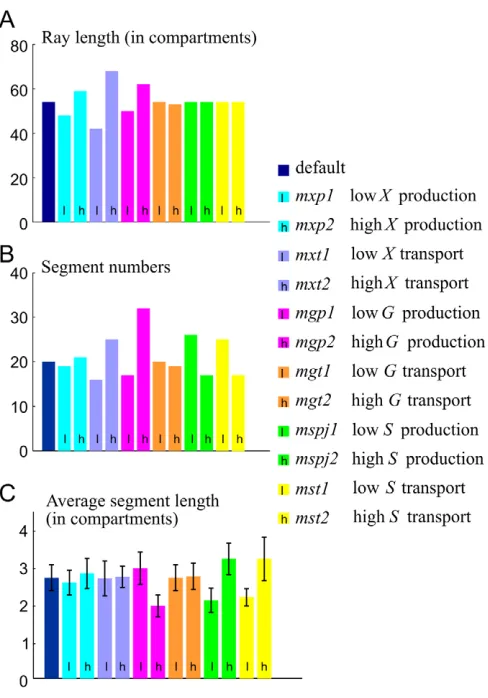
Effect of parameter variations
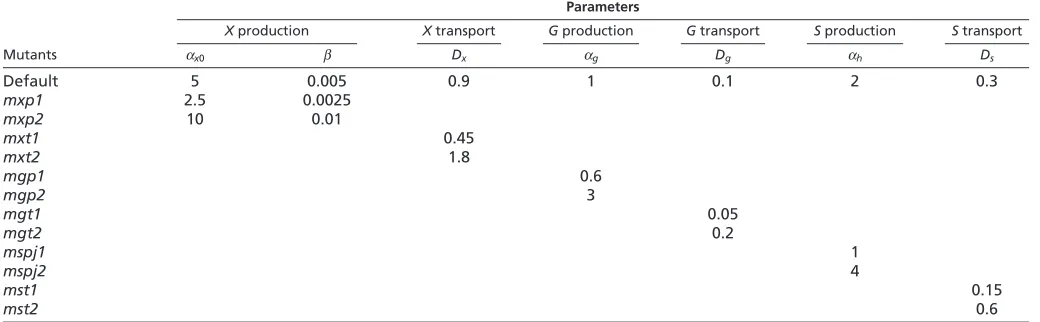
[image:6.612.48.568.559.720.2]In order to explore the effect of parameter variations on the model, X, G and S production and transport were altered, effectively generating virtual mutants. Parameters used for each virtual mutant are shown in Table 2. Decreasing Xproduction (virtual mutant mxp1) leads to a shorter ray with fewer and shorter segments, which is the same effect as the sofmutation (Sims et al., 2009);
Table 2. Parameters used for each virtual mutant compared to the default parameters Parameters
Xproduction Xtransport Gproduction Gtransport Sproduction Stransport
Mutants x0 Dx g Dg h Ds
Default 5 0.005 0.9 1 0.1 2 0.3
mxp1 2.5 0.0025
mxp2 10 0.01
mxt1 0.45
mxt2 1.8
mgp1 0.6
mgp2 3
mgt1 0.05
mgt2 0.2
mspj1 1
mspj2 4
mst1 0.15
mst2 0.6
Naming of each virtual mutant reflects which morphogen is altered (X, Gor S), whether production (p) or transport (t) is altered, and whether the relevant parameter is
decreased (1) or increased (2).
D
E
V
E
LO
P
M
E
N
conversely, increasing Xproduction (mxp2) leads to a longer ray with more numerous and longer segments (Fig. 5, supplementary material Fig. S4). Altering Xtransport (mxt1and mxt2) has similar effects on fin length and segment numbers, but average segment lengths are similar to those of the default model. In particular, increased Xtransport (mxt2) leads to a longer fin with increased segment numbers of normal length, an effect reported for the lof mutation (Iovine and Johnson, 2000). Decreasing Gproduction (mgp1), which is equivalent to decreasing the sensitivity of Gto X, leads to a shorter ray with fewer segments, but segments are on average longer than with the default parameters. Conversely, increasing Gproduction (mgp2) produces a longer ray with more numerous and shorter segments (Fig. 5, supplementary material Fig. S4). Increasing or decreasing Gtransport (mgt1and mgt2) has minor effects for the range of parameter values explored. As Sis not involved in ray growth, varying S production (mspj1 and mspj2) has no effect on fin length (Fig. 5A, supplementary material Fig. S4). However, decreasing Sproduction (mspj1) or transport (mst1) produces a ray with more and shorter segments (i.e. joints are closer to each other), whereas increasing Sproduction (mspj2) or transport (mst2) gives a ray with fewer and longer segments (i.e.
joints are further away from each other) (Fig. 5B,C, supplementary material Fig. S4). As parameter changes for mxp1and mxt2had similar effects to the sofand lofmutations, but the quantitative effects on the phenotypes were small, we also altered parameters more drastically, and confirmed that we could generate strong phenotypes as seen in the sofand lofmutants (mxp1band mxt2b, supplementary material Fig. S5). Detailed quantitative analyses of mutant phenotypes will be needed to calibrate and test the model further.
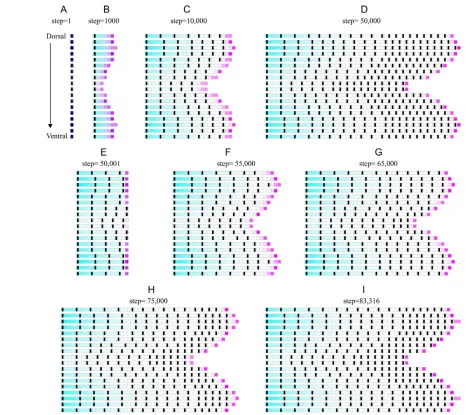
Whole-fin model
Lower levels of Xproduction lead to shorter rays and segments, and fewer segments (Fig. 5), which matches the sofphenotype (Sims et al., 2009), as well as the differences in ray length, segment numbers (Goldsmith et al., 2006) and segment lengths (Jain et al., 2007) between lobe rays and cleft rays. Therefore, we can easily extend the model to represent multiple rays of the fin by postulating a graded bimodal distribution of Xproduction rates at the base of the fin along the dorsoventral axis. The resulting fin (Fig. 6A-D) naturally displays a bi-lobed shape, and smaller and fewer segments in cleft rays compared with lobe rays, which is consistent with the literature (Goldsmith et al., 2006; Jain et al., 2007; Sims et al., 2009). After amputation (Fig. 6E), the fin automatically regains its bi-lobed shape and similar joint patterns to the pre-amputated fin (Fig. 6F-I). The regenerated fin (Fig. 6I) is therefore similar to the pre-amputation fin (Fig. 6D), although new joints at the onset of regeneration are initially slightly further apart than prior to amputation, as observed in the single ray model (Fig. 3D,F,H) and experimentally (supplementary material Fig. S3).
As G promotes the production of a division factor that accumulates until reaching twice its initial value, growth in the model occurs in pulses. Those pulses are less frequent when G levels are lower, hence pulses are less frequent in cleft rays compared with lobe rays (supplementary material Movie 1), and less frequent over time as rays increase in length (supplementary material Movie 1). Those results are in agreement with experimental observations (Goldsmith et al., 2003; Jain et al., 2007).
DISCUSSION
[image:7.612.52.296.58.407.2]The regulation of growth and shape through the action of morphogenetic gradients is poorly understood (Schwank and Basler, 2010). We propose an integrated simulation model of fin ray growth and joint patterning during development and regeneration, which can account not only for the regulation of fin ray length and joint patterns, but also for the regulation of fin shape. The model postulates and therefore predicts the existence of a proximally derived morphogen Xthat is transported and activates the distal production of a morphogen G involved in cell proliferation. Xproduction increases over time, which accounts for faster growth during regeneration than during ontogeny. A third morphogen Sis involved in joint patterning through inhibition of joint formation. Low levels of Gand Strigger joint formation, and joint formation activates the production of S. Sproduction at a joint prevents the formation of other joints in the immediate vicinity. Hence, Sdirectly affects joints spacing without affecting growth, and Gdirectly affects growth and the distance from the fin tip at which joints can form, depending on S. Xaffects joints spacing indirectly as high Xlevels at a joint will lead to higher Sproduction at that joint, hence a larger inhibition zone and larger space between joints. Strikingly, in the whole-fin model, the variation in Fig. 5. Effects of parameter variations on ray length and joint
patterns. (A-C)Ray length (A), segment numbers (B) and average segment length (C) at time 500 (50,000 simulation steps*dt). For each graph, from left to right, data are shown for the model using default
parameters (default), and for virtual mutants mxp1, mxp2, mxt1, mxt2,
mgp1, mgp2, mgt1, mgt2, mspj1, mspj2, mst1and mst2. Parameters used for each virtual mutant are shown in Table 2.
D
E
V
E
LO
P
M
E
N
joint spacing between rays qualitatively matches experimental data (Goldsmith et al., 2006; Jain et al., 2007; Sims et al., 2009), and the fin naturally regains its bi-lobed shape and proper joint patterns following amputation. Two predictions of the model were validated experimentally: first, fins amputated distally and proximally do regenerate in similar but not equal amounts of time (data and model both indicated that fins amputated in distal positions regained their pre-cut length first); second, the first segments formed after amputation are longer than the segments formed at the same position during development.
A possible candidate for morphogen Gwould be a fibroblast growth factor (Fgf). Fgf is a distal morphogen that affects fin growth, and Fgf signaling upon amputation closely mirrors G signaling in the model (Lee et al., 2005). Loss of Fgf signaling in fins has been shown to cause distal tissue loss, indicating a role for Fgf in controlling fin homeostasis (Wills et al., 2008). It will therefore be interesting in the future to extend the model to
[image:8.612.52.522.58.473.2]incorporate a role for G in compartment homeostasis. It is unclear which molecule X might be, but Fgfs have been proposed to respond to some positional information graded along the proximodistal axis of the fin (Lee et al., 2005), which is consistent with the existence of a proximally derived morphogen that enhances Fgf activity. In the absence of experimental data, a model based on diffusion equations is the most parsimonious to model signal propagation, even if the molecular mechanism itself is not of a diffusive nature (Kondo and Miura, 2010). Indeed, morphogen gradients established by diffusion so far have been reported to operate at a short distance compared with the length of fin rays (Lander et al., 2009; Wartlick et al., 2009). X production rate in the model increases over time; therefore, it increases with the age or size of the fish. Such an increase in morphogen production was recently shown in Drosophila, as the production rate of the morphogen bicoid scales with the embryo volume (Cheung et al., 2011). Finally, a bi-modal distribution of Fig. 6. Whole-fin model of ray growth and joint patterning during development and regeneration. Model is identical to the single ray
model, except that Xproduction at the base of each ray follows a bimodal distribution along the dorsoventral axis of the fin. From the most dorsal
ray to the most ventral ray, x05, 6, 7, 6, 5, 4, 3, 2, 1, 1, 2, 3, 4, 5, 6, 7, 6, 5, respectively, and for each ray 0.001x0.
(A-D)Development, (E) amputation, (F-I) regeneration. Fin in I has reached the pre-amputation length (the distal compartment of the two longest
rays has just divided). See also supplementary material Movie 1.
D
E
V
E
LO
P
M
E
N
a signaling substance across fin rays is plausible, as there has to be a bi-modal distribution of ray growth rates along the dorsoventral axis of the fin, during at least part of development, for the fin to be bi-lobed. There is currently no direct experimental evidence for a morphogen corresponding to S. However, defects in connexin 43 (a gap-junction protein) yield joints that are closer to each other (Sims et al., 2009). This supports the involvement of a transported substance in joint spacing, and the idea that such a substance would have an inhibitory effect on joint formation.
Segmentation patterning to date has been mostly studied in the context of somite formation in the mouse embryo. Somites arise from the anterior to the posterior end of the vertebrate embryo at constant spacing during development, and later give rise to vertebrae and associated muscles (Dubrulle and Pourquié, 2004). As in somites, joints in the fin rays form in a sequential manner, with joints being added distally as the fin grows. However, contrary to somites, the ray joints form increasingly closer to each other. Somite pattern formation models involve a gradient of Fgf8 with higher levels at the posterior end of the embryo, and a somite is thought to form when Fgf signaling reaches a sufficiently low level (Baker et al., 2008), which has been termed ‘determination front’ (Dubrulle et al., 2001). This is similar to the gradient of G and its involvement in joint formation. However, models of somite formation also involve an oscillatory clock to determine the timing of somite formation (Murray et al., 2011). In our model, interaction between Gand S at the distal end of the ray repeatedly induces joint formation and expression of S at new joint positions. The time intervals between the apparition of joints and the spacing between joints are not constant, owing to the spatiotemporal dynamics of X concentrations. Hence, the relationship between time and space is highly integrated in the model. It will be interesting in the future to investigate potential parallels between somite formation models and ray joint-patterning models.
It has recently been proposed that interactions between a distal signal, involving Fgf, and a proximal signal pattern bone structures in the mouse limb bud (Mariani et al., 2008; Tabin and Wolpert, 2007) and the chick limb bud (Cooper et al., 2011; Rosello-Diez et al., 2011). In the case of the chick limb bud, the proximal signal was shown to be diffusible. Interestingly, as in the fin ray, the length of the skeletal elements decreases from the base to the tip of the tetrapod limb. It is therefore possible that a related model may underlie the control of endochondral bone length in tetrapods and dermal bone length in teleosts.
Advances in the molecular genetics of fin development and regeneration point to the involvement of multiple genes and signaling molecules, including not only Fgfs but also Wnts and activins (Yin and Poss, 2008). Here, we propose a simple mechanism whereby interactions between three morphogens lead to the conversion of spatial gradients into the formation of repeated segments of varying lengths as the fin grows in pulses of cell proliferation. The mechanism is very robust as fins regain their proper shapes and joint patterns following amputation. The model may be extended in the future to include further mechanisms such as ray bifurcation or the control of fin homeostasis (Wills et al., 2008). Modeling can be a useful tool to explore how postulated mechanisms give rise to complex developmental patterns. The parameter values of the model are currently arbitrary, owing to a lack of published quantitative data. Obtaining detailed quantitative data on fin ray growth and joint patterning during development and regeneration in wild-type and mutant fins will make it possible to
test the model further, refine it and calibrate it. This will provide a link between molecular and computational analyses, opening the way for integrating simulation modeling and molecular data in future studies.
Acknowledgements
We thank Rebecca Assaf for help with figure preparation and Stéphane Aris-Brosou for critical reading of the manuscript.
Funding
This work was supported by a Natural Sciences and Engineering Research Council of Canada (NSERC) Discovery Grant [327059 to A.-G.R.-L.] and by a Canadian Institute of Health Research (CIHR) grant [89824 to M.-A.A].
Competing interests statement
The authors declare no competing financial interests.
Author contributions
A.-G.R.-L and M.-A.A. designed the research, A.-G.R.-L. wrote the simulation models, analyzed experimental data and wrote the paper, and M.P. and V.T. collected experimental data.
Supplementary material
Supplementary material available online at
http://dev.biologists.org/lookup/suppl/doi:10.1242/dev.073452/-/DC1
References
Akimenko, M. A., Marí-Beffa, M., Becerra, J. and Géraudie, J.(2003). Old questions, new tools, and some answers to the mystery of fin regeneration.Dev. Dyn.226, 190-201.
Baker, R. E., Schnell, S. and Maini, P. K.(2008). Mathematical models for somite formation.Curr. Top. Dev. Biol.81, 183-203.
Bénazet, J. and Zeller, R.(2009). Vertebrate limb development: moving from classical morphogen gradients to an integrated 4-dimensional patterning system.Cold Spring Harbor Perspect. Biol.1, a001339.
Cheung, D., Miles, C., Kreitman, M. and Ma, J.(2011). Scaling of the Bicoid morphogen gradient by a volume-dependent production rate.Development 138, 2741-2749.
Cooper, K. L., Hu, J. K. H., ten Berge, D., Fernandez-Teran, M., Ros, M. A. and Tabin, C. J.(2011). Initiation of proximal-distal patterning in the vertebrate limb by signals and growth.Science332, 1083-1086.
Dubrulle, J. and Pourquié, O.(2004). Coupling segmentation to axis formation. Development131, 5783-5793.
Dubrulle, J., McGrew, M. J. and Pourquié, O.(2001). FGF signaling controls somite boundary position and regulates segmentation clock control of spatiotemporal Hox gene activation.Cell106, 219-232.
Géraudie, J. and Singer, M.(1985). Necessity of an adequate nerve supply for regeneration of the amputated pectoral fin in the teleost fundulus.J. Exp. Zool. 234, 367-374.
Goldsmith, M. I., Fisher, S., Waterman, R. and Johnson, S. L.(2003). Saltatory control of isometric growth in the zebrafish caudal fin is disrupted in long fin and rapunzelmutants.Dev. Biol. 259, 303-317.
Goldsmith, M. I., Iovine, M. K., O’Reilly-Pol, T. and Johnson, S. L.(2006). A developmental transition in growth control during zebrafish caudal fin development.Dev. Biol. 296, 450-457.
Haas, H. J.(1962). Studies on mechanisms of joint and bone formation in skeleton rays of fish fins.Dev. Biol. 5, 1-34.
Hoptak-Solga, A. D., Nielsen, S., Jain, I., Thummel, R., Hyde, D. R. and Iovine, M. K.(2008). Connexin43 (GJA1) is required in the population of dividing cells during fin regeneration.Dev. Biol. 317, 541-548.
Huang, C. C., Wang, T. C., Lin, B. H., Wang, Y. W., Johnson, S. L. and Yu, J. (2009). Collagen IX is required for the integrity of Collagen II fibrils and the regulation of vascular plexus formation in zebrafish caudal fins.Dev. Biol. 332, 360-370.
Iovine, M. K.(2007). Conserved mechanisms regulate outgrowth in zebrafish fins. Nat. Chem. Biol.3, 613-618.
Iovine, M. K. and Johnson, S. L.(2000). Genetic analysis of isometric growth control mechanisms in the zebrafish caudal fin.Genetics155, 1321-1329. Iovine, M. K., Higgins, E. P., Hindes, A., Coblitz, B. and Johnson, S. L.(2005).
Mutations in connexin43 (GJA1) perturb bone growth in zebrafish fins.Dev. Biol. 278, 208-219.
Jain, I., Stroka, C., Yan, J. Y., Huang, W. M. and Iovine, M. K.(2007). Bone growth in zebrafish fins occurs via multiple pulses of cell proliferation.Dev. Dyn. 236, 2668-2674.
Kondo, S. and Miura, T.(2010). Reaction-diffusion model as a framework for
understanding biological pattern formation.Science329, 1616-1620.
D
E
V
E
LO
P
M
E
N
Lander, A. D., Lo, W., Nie, Q. and Wan, F. Y. M.(2009). The measure of success: constraints, objectives, and tradeoffs in morphogen-mediated patterning.Cold Spring Harbor Perspect. Biol.1, a002022.
Lee, Y., Grill, S., Sanchez, A., Murphy-Ryan, M. and Poss, K. D.(2005). Fgf signaling instructs position-dependent growth rate during zebrafish fin regeneration.Development132, 5173-5183.
Mariani, F. V., Ahn, C. P. and Martin, G. R.(2008). Genetic evidence that FGFs have an instructive role in limb proximal-distal patterning.Nature453, 401-405. Marí-Beffa, M. and Murciano, C.(2010). Dermoskeleton morphogenesis in
zebrafish fins.Dev. Dyn.239, 2779-2794.
Marí-Beffa, M., Marín-Girón, F., Montes, G. S. and Becerra, J.(1999). Morphometric study of the regeneration of individual rays in teleost tail fins.J. Anat. 195, 393-405.
Meinhardt, H.(2009). In The Algorithmic Beauty of Seashells, pp. 279. Berlin, Germany: Springer.
Murciano, C., Fernández, T. D., Durán, I., Maseda, D., Ruiz-Sánchez, J., Becerra, J., Akimenko, M. A. and Marí-Beffa, M.(2002). Ray-interray interactions during fin regeneration of Danio rerio.Dev. Biol. 252, 214-224. Murciano, C., Pérez-Claros, J., Smith, A., Avaron, F., Fernández, T. D., Durán,
I., Ruiz-Sánchez, J., García, F., Becerra, J., Akimenko, M. A. et al.(2007). Position dependence of hemiray morphogenesis during tail fin regeneration in Danio rerio.Dev. Biol. 312, 272-283.
Murray, P. J., Maini, P. K. and Baker, R. E.(2011). The clock and wavefront model revisited. J. Theor. Biol. 283, 227-238.
Poss, K. D., Keating, M. T. and Nechiporuk, A.(2003). Tales of regeneration in zebrafish.Dev. Dyn.226, 202-210.
Quint, E., Smith, A., Avaron, F., Laforest, L., Miles, J., Gaffield, W. and Akimenko, M. A.(2002). Bone patterning is altered in the regenerating
zebrafish caudal fin after ectopic expression of sonic hedgehog and bmp2b or exposure to cyclopamine.Proc. Natl. Acad. Sci. USA 99, 8713-8718. Rosello-Diez, A., Ros, M. A. and Torres, M.(2011). Diffusible signals, not
autonomous mechanisms, determine the main proximodistal limb subdivision. Science332, 1086-1088.
Schulte, C. J., Allen, C., England, S. J., Juárez-Morales, J. L. and Lewis, K. E. (2011). Evx1 is required for joint formation in zebrafish fin dermoskeleton.Dev. Dyn. 240, 1240-1248.
Schwank, G. and Basler, K.(2010). Regulation of organ growth by morphogen gradients.Cold Spring Harbor Perspect. Biol.2,a001669.
Sims, K., Eble, D. M. and Iovine, M. K.(2009). Connexin43 regulates joint location in zebrafish fins.Dev. Biol. 327, 410-418.
Tabin, C. and Wolpert, L.(2007). Rethinking the proximodistal axis of the vertebrate limb in the molecular era.Genes Dev. 21, 1433-1442.
vanEeden, F. J. M., Granato, M., Schach, U., Brand, M., Furutani-Seiki, M., Haffter, P., Hammerschmidt, M., Heisenberg, C. P., Jiang, Y. J., Kane, D. A. et al.(1996). Genetic analysis of fin formation in the zebrafish, Danio rerio. Development123, 255-262.
Wagner, G. P. and Misof, B. Y.(1992). Evolutionary modification of regenerative capability in vertebrates – a comparative study on teleost pectoral fin regeneration.J. Exp. Zool. 261, 62-78.
Wartlick, O., Kicheva, A. and Gonzalez-Gaitan, M.(2009). Morphogen gradient formation.Cold Spring Harbor Perspect. Biol.1, a001255. Wills, A. A., Kidd, A. R., Lepilina, A. and Poss, K. D.(2008). Fgfs control
homeostatic regeneration in adult zebrafish fins.Development135, 3063-3070. Yin, V. P. and Poss, K. D.(2008). New regulators of vertebrate appendage
regeneration.Curr. Opin. Genet. Dev. 18, 381-386.