Georgia State University Georgia State University
ScholarWorks @ Georgia State University
ScholarWorks @ Georgia State University
Public Health Theses School of Public Health
Fall 12-20-2012
Comparison and Analysis of Youth Tobacco Surveillance
Comparison and Analysis of Youth Tobacco Surveillance
Systems: Lessons Learned and Future Implications
Systems: Lessons Learned and Future Implications
Ichhya Pant
Follow this and additional works at: https://scholarworks.gsu.edu/iph_theses
Recommended Citation Recommended Citation
Pant, Ichhya, "Comparison and Analysis of Youth Tobacco Surveillance Systems: Lessons Learned and Future Implications." Thesis, Georgia State University, 2012.
https://scholarworks.gsu.edu/iph_theses/248
ABSTRACT ICHHYA PANT
Comparison and Analysis of Youth Tobacco Surveillance Systems: Lessons Learned and
Future Implications
(Under the direction of Michael Eriksen, FACULTY MEMBER)
Background: Tobacco use either in the form of smoking or smokeless tobacco is
typically initiated or established behaviorally for adult smokers before 18 years of age.
Given that data from monitoring and surveillance systems drives every policy and
program, accurate surveillance of tobacco consumption by adolescents is a major part of
curbing tobacco addiction.
Methodology: The consistency and reliability of youth smoking prevalence data was
assessed by investigating discrepancies within versions of the Global Youth Tobacco
(GYTS) as well as between GYTS and the Global School-based Health Survey (GSHS).
Sources of errors and biases were examined in order to determine the cause for
discrepancies in results.
Results: Significant discrepancies were found within GYTS versions as well as between
the survey results produced by GYTS and GSHS. Discrepancies within GYTS versions
were determined to be due to quality control errors. Analyzed by gender, negligible
variation was found between boys and girls. When comparing the total smoking
prevalence estimates between GYTS and GSHS, four of the six WHO administrative
regions (Africa, Americas, Eastern-Mediterranean, South-Eastern and Western- Pacific)
were found to have significantly different estimates. The European region did not consist
of any significantly different estimates. When comparing variance in total smoking
prevalence estimates, GSHS results were found to be lower than GYTS estimates with
the exception of the EMRO region. The EMRO region was further analyzed to explore
gender variation within the region and boys were found to have 44.5% more
Conclusion: Up-to-date, reliable and consistent surveillance and monitoring efforts are
part and parcel to solving this tobacco epidemic and fighting wealthy and powerful
COMPARISON AND ANALYSIS OF YOUTH TOBACCO SURVEILLANCE
SYSTEMS:
LESSONS LEARNED AND FUTURE IMPLICATIONS
by
Ichhya Pant
B.A., City University of New York Hunter College
A Thesis Submitted to the Graduate Faculty
of Georgia State University in Partial Fulfillment
of the
Requirements for the Degree
MASTER OF PUBLIC HEALTH
ATLANTA, GEORGIA
COMPARISON AND ANALYSIS OF YOUTH TOBACCO SURVEILLANCE
SYSTEMS:
LESSONS LEARNED AND FUTURE IMPLICATIONS
Approved:
Michael Eriksen, Sc.D
Committee Chair
Carrie Whitney, MPH
ACKNOWLEDGEMENTS
I would like to thank the faculty and staff of the Institute of Public Health, Georgia State
University for their passion and dedication to educate public health professionals who
understand the health challenges that will affect current and future generations and their
role in ameliorating associated health risks. I want to express my heartfelt gratitude to my
committee members; Dr. Michael Eriksen and Ms. Carrie Whitney, for their guidance,
expertise and kind patience in helping me complete this endeavor. Further appreciation is
in order for my family for their continuous support, encouragement and love which has
AUTHOR’S STAEMENT
In presenting this thesis as a partial fulfillment of the requirements for an advanced
degree from Georgia State University, I agree that the Library of the University shall
make it available for inspection and circulation in accordance with its regulations
governing materials of this type. I agree that permission to quote from, to copy from, or
to publish this thesis may be granted by the author or, in his/her absence, by the professor
under whose direction it was written, or in his/her absence, by the Associate Dean,
College of Health and Human Sciences. Such quoting, copying, or publishing must be
solely for scholarly purposes and will not involve potential financial gain. It is understood
that any copying from or publication of this dissertation which involves potential
financial gain will not be allowed without written permission of the author.
Ichhya Pant
NOTICE TO BORROWERS
All theses deposited in the Georgia State University Library must be used in accordance
with the stipulations prescribed by the author in the preceding statement.
The author of this thesis is:
Ichhya Pant
508 Main St. Apt 3222
Atlanta, GA 30324
The Chair of the committee for this thesis is:
Michael Eriksen, Sc. D.
Institute of Public Health
Georgia State University
P.O. Box 4018
Atlanta, GA 30302-4018
Users of this thesis who are not regularly enrolled as students at Georgia State University
are required to attest acceptance of the preceding stipulation by signing below. Libraries
borrowing this thesis for the use of their patrons are required to see that each user records
here the information requested.
NAME OF USER ADDRESS DATE
CURRICULUM VITAE Ichhya Pant
508 Main St. Apt 3222
Atlanta, GA 30324
Education
Georgia State University – Atlanta, GA Master of Public Health, 2012
City University of New York, New York, NY
Bachelor of Arts, Psychology, 2005
Nonprofit Leadership Alliance, Kansas City, MO
Certification in Nonprofit Management and Leadership, 2012
Professional Experience
Georgia State University, Atlanta, GA (May 2011 – Dec. 2012)
Graduate Research Assistant, Institute of Public Health
Centers for Disease Control and Prevention, Atlanta, GA (Jan 2011 – May 2012)
Intern
Next Generation Nonprofit Leadership Program, Kansas City, MO (2012)
Next Generation Nonprofit Leadership Scholar
Associations
Public Health Institute Student Association (Member)
TABLE OF CONTENTS
ACKNOWLEDGEMENTS ... iii
LIST OF TABLES ... viii
LIST OF ABBREVIATIONS ... x
INTRODUCTION1 1.1 Background1 1.2 Purpose of Study ...3
1.3 Research Questions4 REVIEW OF THE LITERATURE...6
2.1 Disseminations and Application of GYTS and GSHS ... 7
2.2 Compare and Contrast – GYTS vs. GSHS ...9
2.3 Methodological Considerations – Adolescent Health Research ... 11
2.3.1Self-Reported Smoking Account – Is It Consistent and Reliable ...13
2.3.2 The Role of Research Settings – Do Responses and Results Vary ...16
METHODS AND PROCEDURES ...19
3.1 Data Source ... 19
3.2 Study Population ... 22
3.3 Study Measures ... 23
3.4 Data Analysis ... 24
3.4.1 Data Sets – Overview ...24
3.4.2 Data Selection – Protocol and Guidelines ...26
RESULTS28 4.1 GYTS Online vs. Original ... 28
4.1.1 GYTS Online vs. Original – By Gender ...28
4.1.2 GYTS Online vs. Original – By Region ... 31
4.2 GYTS vs. GSHS ...31
4.2.1 GYTS vs. GSHS – By Gender ...33
4.2.2 GYTS vs. GSHS – By Region ...34
4.3 Master Youth Data Set ...40
4.4 Overall Trends ...42
DISCUSSION AND CONCLUSION ...44
5.1 Discussion ... 44
5.2 Study Limitations ... 49
5.3 Recommendations ... 49
5.4 Conclusion ... 51
APPENDICES ...54
Appendix 1 ...54
Appendix 2 ... 56
LIST OF TABLES
Table 1. GYTS vs. GSHS – Compare and contrast ... 10
Table 2. Significance designation Coding Tool ... 23
Table 3. GYTS Online vs. Original – By gender ... 28
Table 4. GYTS Online vs. Original - Error classifications ... 29
Table 5. GYTS Online vs. Original – Total smoking prevalence by region ... 31
Table 6. GSHS vs. GYTS – By gender ... 32
Table 7A. GYTS vs. GSHS – Countries with significantly different total smoking estimates and a positive prevalence variance ... 33
Table 7B. GYTS vs. GSHS – Countries with significantly different total smoking estimates and a negative prevalence variance ... 34
Table 8A GYTS vs. GSHS – Total smoking prevalence estimates by region ... 35
Table 8B.1 GYTS vs. GSHS – Countries with significantly different total smoking estimates in the AFRO region and a positive prevalence variance... 35
Table 8B.2 GYTS vs. GSHS – Countries with significantly different total smoking estimates in the AFRO region and a negative prevalence variance ... 35
Table 8C.1 GYTS vs. GSHS – Countries with significantly different total smoking estimates in the AMRO region and a positive prevalence variance ... 36
Table 8C.2 GYTS vs. GSHS – Countries with significantly different total smoking estimates in the AMRO region and a negative prevalence variance ... 36
Table 8D.1 GYTS vs. GSHS – Countries with significantly different total smoking estimates in the EMRO region and a positive prevalence variance ... 36
Table 8D.2 GYTS vs. GSHS – Countries with significantly different total smoking estimates in the EMRO region and a negative prevalence variance ... 36
Table 8D.3 GYTS vs. GSHS – List of significantly different estimates for boys and girls in the EMRO region ... 38
Table 8E.1 GYTS vs. GSHS – Countries with significantly different total smoking estimates in the SEARO region and a positive prevalence variance ... 39
Table 8F.1 GYTS vs. GSHS – Countries with significantly different total smoking estimates
in the WPRO region and a positive prevalence variance ... 40
Table 8F.2 GYTS vs. GSHS – Countries with significantly different total smoking estimates
in the WPRO region and a negative prevalence variance ... 40
Table 9. Master Youth Data Set – Summary of sources ... 41
LIST OF ABBREVIATIONS
CDC: Centers for Disease Control and Prevention
WHO: World Health Organization
GYTS: Global Youth Tobacco Survey
GSHS: Global School-based Health Survey
USNLM: US National Library of Medicine
IPH: Institute of Public Health
HBSC: Health Behavior in School-aged Children
UNICEF: United Nations Children’s Emergency Fund
TFI: Tobacco Free Initiative
CPHA: Canadian Public Health Association
OSH: Office on Smoking and Health
UNESCO: United Nations Educational, Scientific and Cultural Organization
AFRO: Regional Office for Africa
AMRO: Regional Office for the Americas
EURO: Regional Office for Europe
SEARO: Regional Office for South-East Asia
CHAPTER I
INTRODUCTION
1.1 Background
Tobacco use either in the form of smoking or smokeless tobacco is typically
initiated or established behaviorally for adult smokers before 18 years of age (The
Centers for Disease Control and Prevention [CDC], 2012.a). The Centers for Disease
Control and Prevention (CDC) estimates that an average of 19.5% of high school students
defined as current smokers smoked one or more cigarettes in the month prior to
participating in a health survey conducted in 2009. In terms of gender, 19.1% of female
students and 19.8% of male students in high school were found to be current smokers.
Additionally, the survey revealed that 5.2% of middle school students were current
smokers. According to the same survey, 4.7% of female students and 5.6% of male
middle school students were current smokers prior to beginning high school. Based on
the data above, the pathway between initiation and addiction now ranges between middle
school and high school for young smokers (CDC, 2012; The World Health Organization
[WHO], 2012.a).
When looked at from a global perspective, the World Health Organization (WHO)
reports that in five of its six geographical regions, young girls in the age group of 13 to
15 years old have higher smoking rates than their adult counterparts (WHO, 2012.a).
WHO further reports average smoking rates for adolescent boys globally to be around
18%. The incidence rate for smoking of some form of tobacco among adult men is the
As for adult women, smoking rates are the highest at 22% in the WHO European region
(WHO, 2012.a). These figures are alarming when one considers that adolescents have
now initiated smoking at earlier ages and are more likely to continue smoking throughout
their lifetime. These numbers help shed light on the challenges public health workers face
in developing and implementing primary and secondary intervention policies for tobacco
control and cessation measures. In order to accomplish such a task, it is crucial to
generate awareness in younger generations regarding a lifelong nicotine addiction cycle
perpetuated by smoking initiation at an early age (WHO, 2012.a).
According to the CDC, adolescent smoking is associated with the following
factors: low socioeconomic status, use and approval of tobacco use by peers or siblings,
exposure to smoking in movies, lack of skills to resist influences to tobacco use, smoking
by parents or guardians and/or lack of parents support or involvement, accessibility,
availability, price of tobacco products, a perception that tobacco is the norm, low levels
of academic achievement, low self-image or self-esteem, exposure to tobacco advertising,
aggressive behavior, high-risk sexual behavior and, use of alcohol and drugs (CDC,
2012.a). Tobacco use kills up to 50% of tobacco users and each year nearly 6 million
people die from tobacco-attributable causes. Of these six million annual deaths, 5 million
are among individuals who are current or ex-smokers and 600,000 deaths are attributed to
second hand smoke exposure (WHO, 2012.b). If left unchecked and without urgent
actions backed by monitoring and surveillance projects, policies and programs, WHO
economic development. In the 20th century alone, the world has seen 100 million deaths
caused by tobacco use (WHO, 2012.b).
When focusing on the startling current youth and adult smoking rates along with
morbidity and mortality facts, a perilous picture of the future emerges. By the time
adolescent smokers reach puberty, they are likely to be addicted to nicotine and attempts
to quit become more difficult. If public health agencies want to focus on primary
intervention strategies, which would curb the problem prior to it starting through
awareness and education, the first step is to establish accurate, up-to-date and reliable
global surveillance systems to monitor adolescent tobacco awareness, initiation and usage
patterns. In doing so, accurate smoking rates and associated usage patterns emerge and
provide baseline knowledge in order to develop tobacco control and cessation programs
specifically geared towards adolescents. The ever increasing cost of healthcare is even
more likely to become unsustainable in the near future with adolescents developing a
full-fledged nicotine addiction at such early ages. WHO states that “surveillance is key”
in curbing the tobacco epidemic by allowing for the possibility of measuring its reach
then mitigating the associated risk and potential harm (WHO, 2012.b).
1.2Purpose of the Study
To establish reliable tobacco surveillance systems with a distinct youth
component, WHO and CDC have worked independently and in partnership to establish
two surveillance systems that monitor tobacco use among adolescents – Global Youth
Tobacco Survey (GYTS) and Global School-based Student Health Survey (GSHS). Both
comparing various versions of GYTS data, it was discovered that they were inconsistent
with each other. The versions compared and discussed for this thesis are web-based data
housed on official websites and data sets provided via personal communication while
conducting research for an unrelated project. Given that data from monitoring and
surveillance systems drives every policy and program, it was determined that a quality
control process would prove beneficial with the end goal of having a master youth data
set that would encompass the best of all versions available. Moreover, this study analyzed
how the master GYTS data set compares to data provided by GSHS to see if and how
they varied then created a data set that would contain the best of GYTS and GSHS data
sets. It also included the methodology applied in order to populate the master data set
with technical explanations for the variations that can be utilized by organizations to
identify them accordingly. Doing so led to the development of a unique globally
representative sample derived from the two state-of-the-art adolescent tobacco
surveillance systems set up by WHO and CDC, in partnership with other health and
government agencies.
1.3Research Questions
This study was driven by an effort to standardize and draw a parallel between two
existing adolescent tobacco surveillance data sets in order to provide consistent and
comparable data that will inform policies and protocols on tobacco control and cessation
1. How do the various versions of GYTS differ from each other in the data they
provide? Additionally, what are some plausible reasons for the discrepancies to
have occurred?
2. How does the GYTS data differ from the smoking rates provided by GSHS in
common survey sites? Based on data comparison and analysis, what
CHAPTER II
REVIEW OF THE LITERATURE
The purpose of this study is to draw parallels between two well established and
recognized global tobacco surveillance systems initiated by reputable public health
agencies, such as WHO and CDC. Furthermore, it is also a goal of this study to populate
a master data set combining the most reliable, up-to-date and consistent estimates such
that a comprehensive source of youth tobacco smoking rates is created with the best
versions. However, this can only be accomplished by understanding and correctly
classifying the various reasons for potential discrepancies in smoking rates that exist
within GYTS and between GYTS and GSHS. The method applied in order to identify
differences in smoking rates and then select the best estimates available will be provided
in the methods section. In this section, we will explore the following topics in order to
first gain an understanding of the similarities and differences that exist between the two
data sets being compared (GYTS vs. GSHS) –
GYTS and GSHS – dissemination and application in literature and research,
Compare and contrast the methodology and survey design of GYTS and GSHS in
order to understand the differences between the two to postulate rationalizations
for differences in smoking rates,
Various methodological considerations relating to adolescent health research,
Explore the consistency and reliability of self-administered/self-reported accounts
Explore the role of research settings, specifically school-based surveys, and how
they affect self-reports of risky behaviors such as smoking.
By inspecting these topics further, it should be possible to understand if these
factors are responsible for differences in smoking rates provided by GYTS and GSHS.
2.1 Dissemination and Application of GYTS and GSHS in Literature and Research
Since GYTS and GSHS both have analogous goals in studying and monitoring
tobacco usage and patterns, it is necessary to understand how each data set is utilized by
scientist, researchers, health care and public health professionals alike. If one searches
“Global Youth Tobacco Survey” on a digital scientific library archive such as Pubmed, a
plethora of studies utilizing GYTS is revealed. Since GYTS only consists of a
questionnaire focused on tobacco usage and patterns, most of the studies utilizing GYTS
are focused on smoking beliefs, attitudes, correlations and behavior, tobacco control
policy, understanding prevalence and characteristics of cigarette smoking within a
population and its subsets, exposure to second-hand smoke, effect of environment
(school, home, work) on smoking habits etc. (US National Library of Medicine [NLM],
2012.a). Similarly, executing a search on Pubmed for “Global School-based Health
Survey” reveals studies that are not only focused on tobacco related topics similar to
GYTS but also studies focused on all ten topics covered by the GSHS questionnaire such
as mental well-being, sexual health, physical activity, nutrition, drug use etc (NLM,
2012.b). Running a comparative search on Pubmed for both surveillance projects reveals
that studies utilizing either GYTS or GSHS have similar objectives and goals even if
A search for articles that utilize both studies revealed only one scientific article
comparing the results of GYTS with GSHS by Page and Danielson (2011). The objective
of the paper was to describe GSHS smoking rates and compare with GYTS. This was
done by compiling the prevalence estimates from fact sheets available on the GSHS
website. Boy to girl ratios were calculated in order to determine gender differences in
tobacco use (Page & Danielson, 2011). Non over-lapping confidence intervals were
applied in order to determine a statistical estimation of gender differences. The study thus
provided the highest and lowest estimates along with gender and geographic comparisons
of tobacco use prevalence within all six WHO regions. In their study, Page and Danielson
(2011) discovered some critical similarities and differences between GYTS and GSHS–
The GSHS determined a 0.9% smoking prevalence from a national survey
conducted in Tajikistan in 2006 producing a very close estimate to the one
provided by the GYTS (1.1%) in 2004. Tajikistan contains the lowest estimate for
GSHS and is the lowest estimate for the European region,
The lowest smoking rates were found to be in the Southeast Asia and Eastern
Mediterranean regions in both GSHS and GYTS,
In Macedonia, the GYTS determined a smoking prevalence of 7.7% in 2003
which varies from the estimate derived in 2007 by GSHS (10.5%),
Varying estimates were for smoking rates in Myanmar. The GYTS reported the
smoking prevalence as 10.2% in 2001 while the GSHS determined it to be only
It is evident that a range of discrepancies possibly exists between the GSHS and
GYTS data sets. Therefore, the goals and objectives provided in this study would be
crucial in shedding light in the comparability of both as stated in their missions.
2.2 Compare and Contrast – GYTS vs. GSHS
GYTS and GSHS are surveys that are very similar in design and methodology.
Both surveys were designed to fulfill similar objectives. The survey results assist
countries in developing priorities for adolescent health policies and programs.
Additionally, they provide comparable smoking rates for various sites worldwide. While
technical variances may exist for survey administration and data collection methods
between the two surveys, the designs of the surveys are similar. One major variance is
that while GYTS focuses solely on tobacco use and patterns GSHS covers ten additional
topics focused on health behaviors such as nutrition, physical activity, mental well-bring
etc. Another variance between the two surveys stems from the operational definitions
designated to a student’s smoking status. GYTS considers students to be current smokers
if they smoked at least one cigarette in the month preceding the survey in comparison to
GSHS which considers students to be current smokers if they smoked on one and more
days out of the last 30 days.
In considering how and why the results of the two surveys may vary from each
other, it is crucial to understand the differences between the two study designs. While the
methodology and background of each survey has been described in detail in the methods
section, this section details a synopsis of technical aspects for the two surveys. Both
period or 30 to 40 minutes in time. They consist of a core questionnaire model with the
option to include country-specific questions and core-expanded questions. Surveys are
administered to students aged 13 – 15 years old and utilize a standardized scientific
process in survey administration, data collection and analysis. Both utilize a two-stage
cluster sample design with randomized selection of eligible schools. In addition, they also
consist of overlapping partnering agencies which provide technical assistance in various
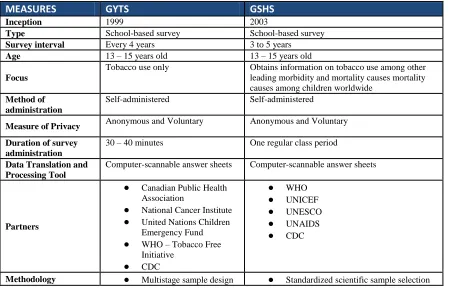
capacities. Further details can be found in Table 1 below. In comparing and contrasting
the two surveys and their basic methodology, our hypothesis is that researchers should be
able to derive analogous smoking rates from both surveys which can then be compared to
[image:23.612.81.531.424.712.2]the other for consistency and trends within the data(CDC, 2012.c; WHO, 2012.d).
Table 1. GYTS vs. GSHS – Compare and Contrast
MEASURES GYTS GSHS
Inception 1999 2003
Type School-based survey School-based survey Survey interval Every 4 years 3 to 5 years
Age 13 – 15 years old 13 – 15 years old
Focus
Tobacco use only Obtains information on tobacco use among other leading morbidity and mortality causes mortality causes among children worldwide
Method of administration
Self-administered Self-administered
Measure of Privacy Anonymous and Voluntary Anonymous and Voluntary
Duration of survey administration
30 – 40 minutes One regular class period
Data Translation and Processing Tool
Computer-scannable answer sheets Computer-scannable answer sheets
Partners
● Canadian Public Health Association
● National Cancer Institute ● United Nations Children
Emergency Fund ● WHO – Tobacco Free
MEASURES GYTS GSHS with schools selected
proportional to enrollment size utilizing a two-stage cluster sampling with random selection of schools for inclusion ● Classrooms chosen
randomly within selected schools
● All students selected eligible for participation ● Anonymous and
confidential participation ● Country-specific questions ● Computer scannable
answer sheets ● Core questionnaire ● Country level data with
regional stratification possible
process
● Common school-based methodology ● Two-stage cluster sampling with random
selection of schools for inclusion ● Classrooms chosen randomly within
selected schools
● Core questionnaire modules ● Core-expanded questions (optional) ● Country-specific questions
Operational definition of smoking
The survey defines current smokers as students who smoked cigarettes on at least 1+ day of the past 30 days. The measure utilized is percentage and all estimates of incidence are listed accordingly.
The survey defines current smokers as students who smoked cigarettes on at least 1 day during the month preceding the survey. The measure utilized is percentage and all estimates of incidence are listed accordingly.
2.3 Methodological Considerations – Adolescent Health Research
During adolescence, individuals are very impressionable because cognitive
development and identity formation is still on-going (Stein, Colby, O’Leary, Monti,
Rohsenaw, Spirito, Riggs & Barnett, 2002). Research suggests that adolescents that have
established daily smoking by age 15 can be attributed partially to smoking habits formed
between 11 to 13 years (Colder, Balanda, Mayhew, Pentz, Mehta, Campbell, Stanton &
Flay, 2001). This implies that adolescence, especially at its initial stage, is a seminal
period in determining and shaping the development smoking habits. Furthermore,
epidemiological trends suggest that it is during adolescence that cigarette use peaks
identifying different patterns of smoking onset and escalation is crucial to curbing the
smoking epidemic. For this reason, the adolescent state of mind is a major
methodological consideration related to the objectives of this thesis. Colder et al. (2001)
also maintain that there isn’t enough known regarding the trajectory of cigarette
consumption that leads to various etiological pathways for adolescents. The identification
of sub-groups based on usage patterns and nicotine dependence is also considered crucial
in developing and implementing effective interventions (Kleinjan, Vitaro, Wanner, Brug,
Van & Engels, 2012). If researchers hope to curtail the smoking epidemic, given the
addictive nature of nicotine and tobacco combined with the emotional, physical and
lifestyle changes that occur during adolescence, it is imperative to understand the
trajectory of nicotine dependence prior to initiation and throughout usage (Kleinjan et al.,
2012). Additional technical methodological considerations, such as choice in research
settings (household, school-based, clinical and correctional settings) and research
instruments (interviewer vs. self-administered questionnaire), have special implications
for emotionally volatile adolescents.
While both GYTS and GSHS have utilized identical research settings and
instrument, literature suggests that it is still possible for variances to exist within data sets
despite utilizing common methodology (CDC, 2012.a; CDC, 2012.b; Stein et al., 2002).
A detailed overview describing the various nuances and associated implications of
2.3.1 Self-Reported Cigarette Smoking Accounts – Is It Consistent and Reliable?
In order to expound further on the various reasons data may differ between GYTS
and GSHS, one notable fact is that both surveillance systems utilize an anonymous
self-administered survey to adolescents aged 13-15 years old. Self-reported accounts of
smoking and behaviors have long been questioned and studied by researchers for their
validity and reliability, due to various reasons such as perceptions of social undesirability,
recall bias, under or over reporting and fear of disclosure or repercussions(Kleinjan et al.,
2012). However, one cannot discount that self-administered surveys are cost effective
and efficient means of getting data from a target population. A meta-analysis of 26
studies conducted to compare the validity of self-reported smoking accounts to
biochemical assessments reported that self-reported surveys had an overall high
sensitivity (87%) and specificity (89%) (Patrick, Cheadle, Thompson, Diehr, Keopsell &
Kinne, 1994). However, sensitivity and specificity rates varied depending on research
setting, study population, measurement methods, and study objective. This meta-analysis
suggested that self-reported accounts of smoking habits are more likely to be accurate in
interviewer-administered surveys in comparison to self-administered surveys. This was
attributed to sensory cues that would be obvious to the interviewer thus causing the
participant to more honest about their smoking status. With regard to research setting,
student respondents, such as the ones involved in the GYTS and GSHS surveys were
found to have lower sensitivity and therefore were more likely to deny smoking even
when biochemical validation measures classified them as such in comparison to
cigarette smoking is illegal for minors in most states and countries, the rationale behind
the low specificity in students, as stated by the authors, was response distortion or
misappraisal due to “conscious (fear of being found out) or unconscious (self-definition
inconsistent with behavior)” rationalizations (Patrick et al., 1994). Researchers report
that it is particularly difficult to assess accuracy in self-reports in adolescents because of
their incomplete cognitive development as well as impressionable and immature identity
formation(Stein et al., 2002).
One such pilot study conducted by Stein et al. (2002) sought to study the factors
behind conscious and willful response distortion on the part of those who willfully
misreport. Researchers discovered through this study that in an intervention setting,
purposeful misreporting, such as under or over reporting, does occur with claims of
truthful reporting being the most common approach taken by adolescents. They attributed
maintaining impressions and fear of disclosure as a substantial factor to cause
misreporting by adolescents with 25% to 40% of the study participants endorsing this
rationalization as the most likely reason that adolescents misreport their smoking status.
Researchers also state that often adolescent’s under-report due to misappraisal and
therefore not all response distortion is willful and purposeful on the respondents’ part.
Participants in such situations resort to self-deception and internal impression
management to cope with their fears of being addicted, to manage feelings of guilt or to
enforce their belief and desire to quit. As such it seems that rationalizations for response
over-report their usage. Moreover, researchers state that for some adolescents over-over-reporting
may be a form of seeking help. It was also discovered that age is inversely correlated to
misreporting and younger respondents were more likely to misreport due to fear of
disclosure or parental/legal repercussions. This finding corroborates similar discoveries
regarding minors and response distortion due to fears of being caught and reprimanded
by Patrick et al. (1994).
For some researchers validation of smoking status through biochemical measures,
such as cotinine (in plasma, saliva, or urine), carbon monoxide (in expired air), and
thiocyanate (in plasma or saliva) is the “gold standard” in order to accurately classify
smoking status in all populations(Patrick et al., 1994). Due to its high cost and logistical
complexities, conducting biochemical validation isn’t always practical for most
researchers. Additionally, biochemical validation isn’t absolute in its assessment
according to Patrick et al. (1994). They state that elevated levels of carbon monoxide and
thiocyanate can be found in non-smokers or tobacco users and similarly cotinine, a
nicotine metabolite is also present in elevated levels in users of snuff and chewing
tobacco. Furthermore, conducting biochemical validation requires substantial funding
since the cost varies from $1 per sample for a carbon monoxide sampling to $20 per
sample for cotinine analysis with additional costs associated with execution, logistics,
storage and handling. If one considers the extra time and data analysis that is required on
top of high costs and demanding logistical requirements, it is quickly evident that
biochemical validation isn’t ideal or practical for most studies wanting to assess smoking
recommended self-administered surveys combined with biochemical validation due to the
low specificity of student estimates in self-reported accounts. However, given that
biochemical validation is a costly and cumbersome endeavor, Patrick et al. (1994) also
recommend utilizing a procedure known as the bogus pipeline method as an alternative
strategy. In the bogus pipeline procedure, researchers inform survey participants that their
reports may be objectively verified utilizing biochemical tests. This is done in order to
create a placebo effect in the minds of the participants so that they are forced to provide
an accurate self-report of their smoking status. In actuality, verification does not take
place despite taking samples and specimens.
It is evident based on the various studies described above that self-reported
accounts especially among adolescents and students through self-administered
questionnaires can produce varying smoking status accounts. Therefore, it can be
considered as a plausible factor in accounting for differences found between the smoking
rates provided by GYTS and GSHS.
2.3.2 The Role of Research Setting – Do Responses and Results Vary?
Another study design measure that is identical between GYTS and GSHS is that
they are both school-based surveys and thus should result in similar data between the two
surveys. However, it is worth exploring whether any methodological issues arise due to
both surveillance projects utilizing schools as the research setting and if the estimates
derived have inherent biases due to the chosen setting. For example, researchers
Brener, Warren, Collins & Giovino, 2002). Kann et al. (2002) state that when comparing
surveys conducted in a school-based setting versus a household setting determined that
self-reported accounts that varied the most were related to socially stigmatized behaviors
or illegal activities. This further corroborates the findings that socially stigmatized or
behaviors related to illegal activities in minors lead to response distortion and
misappraisal. Findings by Kann et al. (2002) further conclude that the deciding factor
which leads to response distortion may be related to privacy or the perception of privacy.
Adolescents clearly fear disclosure, repercussions and reprimand and therefore always
seek to manage internal and external impressions by resorting to response distortion or
misappraisal. However, it is worth noting that the self-reported smoking status did not
significantly vary between the two settings. Their findings are consistent with other
studies that find higher smoking rates among school-based surveys in comparison to
household surveys (Groefer, Wright & Kopstein, 1997; Rootman & Smart, 1985). It is
also hypothesized that while school-based surveys populate higher smoking rates, they
are closer to a biochemical measure of smoking incidence in comparison to household
surveys (Hedges & Jarvis, 1998). This suggests greater accuracy in school-based surveys
rather than over-reporting on the student’s part (Hedges & Jarvis, 1998; Gans & Brindis,
1995). Given that both the GYTS and GSHS provide anonymity and confidentiality
despite being conducted in schools should guarantee that fears of disclosure would be
negated when reporting smoking status. Therefore, data derived from both should yield
than discrepancies, youth smoking rates from common countries should in theory reveal
CHAPTER III
METHODS AND PROCEDURES
3.1 Data Source
There are two primary data sources utilized in this thesis – Global School-based
Health Survey and Global Youth Tobacco Survey. Versions of both studies were received
by the Institute of Public Health (IPH) at Georgia State University as resources to gather
data from while working on an unrelated project. At this time, various discrepancies were
found within different versions of GYTS, which led to the objectives stated in this thesis.
Detailed methodology applied in conducting quality control and populating master data
sets are provided in section 3.4.
Global Youth Tobacco Survey (GYTS): GYTS was conceived as a result of a joint
partnership between the World Health Organization – Tobacco Free Initiative
(WHO-TFI), US Centers for Disease Control and Prevention – Office on Smoking and Health
(CDC-OSH), Canadian Public Health Association (CPHA), and most WHO member
states. It is a tobacco related survey that is conducted in schools among students aged
13-15 years old. The surveys are self-administered and can be completed within 30-40
minutes. The self-administered survey tool is a computer-scannable answer sheets. The
goal of the survey was to produce global data on smoking prevalence through
cost-efficient and practical means which would in turn result in tobacco control and
prevention programs(CDC, 2012.c). With a successful pilot-tested study in 12 countries
launched in 1999, GYTS had been conducted in 140 countries and 11 territories in all six
Survey (GYTS) falls under the surveillance and monitoring efforts for the Tobacco Free
Initiative (TFI). TFI initiated a meeting in 1998 in partnership with the Centers for
Disease Control (CDC), the United Nations Children’s Emergency Fund (UNICEF), the
World Bank and representative from the six regions of the World Health Organization
(WHO) to develop a tobacco surveillance system which will provide “standardized
mechanisms to collect youth tobacco use information on a global basis” (CDC, 2012.c).
As a result of this meeting, GYTS was initiated and run by the CDC and WHO in
partnership. GYTS is funded by the Canadian Public Health Association, National
Cancer Institute, United Nations Children Emergency Fund (UNICEF), and the World
Health Organization – Tobacco Free Initiative (WHO, 2012.a). Surveys are repeated in 4
to 5 year intervals in most countries. In the 13 years since its inception, GYTS has
become the largest, practical and cost-efficient youth tobacco surveillance system (CDC,
2012.c).
The overall goal of GYTS as stated on WHO website for GYTS, is to assist
countries enhancing their abilities to track tobacco use by youth in the population such
that it aids tobacco prevention and control efforts. Furthermore, GYTS utilizes
standardized methodology for all aspects of survey administration, collection, translation
and management. In addition to all these applications of the GYTS data, it is a practical
and easily accessible means for anyone with internet access to gather information on the
following seven domains surrounding youth smoking – knowledge and attitudes of
cigarettes, access to cigarettes, tobacco-related school curriculum, environmental tobacco
smoke (ETS) and cessation of cigarette smoking (CDC, 2012.a).
Overall, GYTS consists of 56 core questions with an option to add additional
country-specific questions if desired as well(CDC, 2012.a). Of the seven domains listed
above, the only topic that applies to the objective of this thesis is the prevalence of
cigarette smoking.
Global School-based Health Survey (GSHS): GSHS was chosen as a benchmark for
conducting quality control in this thesis because it is very similar to GYTS as it is a
school-based survey with students primarily aged 13 to 15 years old. Like GYTS, GSHS
is a surveillance system tailored to monitor and evaluate health behavior and protective
factors in ten areas involving adolescents (WHO, 2012.c). It was developed by WHO in
a partnership with the Centers for Disease Control (CDC), the United Nations Children’s
Fund (UNICEF), UNCESCO and UNAIDS.
The purpose of GSHS is to garner accurate data on youth health behaviors and
protective factors so that it facilitates countries in understanding what their health
priorities are and to establish programs to mitigate these priorities. Furthermore, GSHS
allows international agencies and countries to be able to draw comparisons with estimates
from other homogenous surveys. Lastly, GSHS data should further health programs and
evaluations by establishing trends in health behaviors and protective factors(WHO,
2012.c). GSHS, like GYTS, utilizes standardized methodology for all aspects of survey
administration, collection, translation and management. However, unlike GYTS, GSHS
non-tobacco related questionnaire modules are also conducted during the survey process –
alcohol use, dietary behaviors, drug use, hygiene, mental health, physical activity,
protective factors, sexual behaviors, tobacco use and violence and unintentional injury
(WHO, 2012.c). In this thesis, we will only focus on the tobacco related data derived
from GSHS. Thus far, more than 420,000 students have completed the GSHS survey with
a total 73 countries having completed a full report. There are more than 107 countries that
function as participating members of the GSHS and these states have been divided into
the six WHO regions – Regional Office for Africa (AFRO), Regional Office for the
Americas (AMRO), Regional Office for the Eastern Mediterranean (EMRO), Regional
Office for Europe (EURO), Regional Office for South-East Asia (SEARO), and Regional
Office for the Western-Pacific (WPRO) (WHO, 2012.e).
3.2Study Population
Students aged 13 to 15 years old served as the survey participants for both GSHS and
GYTS. The survey sites were schools within the six global administrative regions of
WHO. A two-stage cluster sample design was used whereby schools were selected
proportional to their enrollment size, and then classes were randomly selected in which
all students in the selected classes were eligible to participate. GYTS has surveyed over 2
million students worldwide in 11,000 schools(CDC, 2008). This is representative of 140
countries and 11 territories(WHO, 2012.d). Similarly, GSHS has reached out to over
420,000 students representing more than 73 countries from all around the world (CDC,
60% to 99.8% in a study which included 195,326 students that participated in GSHS
(Page et al., 2011). The initial sample in the study consisted of 110 sites representing 44
countries. Of the 110 sites, 89 provided data on current cigarette smoking prevalence.
These 89 sites represented 34 of the total 44 countries that conducted the survey and
included tobacco use questions in the survey. Lack of data for some of the missing sites
could be attributed to countries opting to not utilize and include survey questions on
tobacco use(Page et al., 2011).
3.3Study Measures
Operational Definition(s) -
For the purpose of this thesis, current smokers have been defined as a percentage of
students who smoked cigarettes on at least one day during the month preceding the
survey by GYTS. Likewise, GSHS defined current smokers as a percentage of students
who smoked cigarettes on at least 1+ day of the past 30 days. Operational definitions
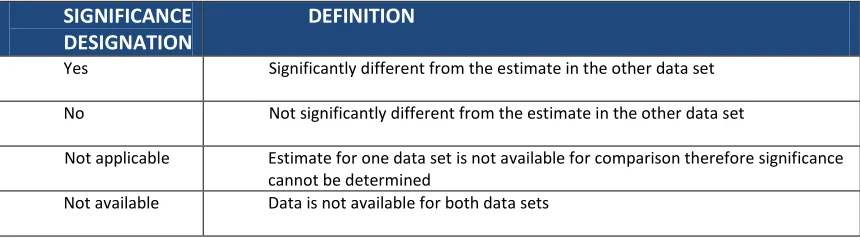
[image:36.612.113.543.535.654.2]applied when designating a significance status for all comparisons are listed in Table 2.
Table 2. Significance Designation Coding Tool
SIGNIFICANCE DESIGNATION
DEFINITION
Yes Significantly different from the estimate in the other data set
No Not significantly different from the estimate in the other data set
Not applicable Estimate for one data set is not available for comparison therefore significance cannot be determined
In order to determine whether the data found within the two data sets are
significantly different from each other, the following criterion was set – the data
presented in the two data sets do not match each other and the prevalence estimate in one
data set is outside the range for the confidence interval estimates provided in the other
data set or vice-versa.
3.4Data Analysis
3.4.1 Data Sets - Overview
One of the main objectives of this thesis project was to conduct quality control within the
various versions of the GYTS data sets and create a master GYTS data set that would
contain the best of both GYTS versions. In order to accomplish this goal, two versions of
GYTS data sets (Original and Online) were compared. The first version titled GYTS
Original was received via personal communication by the Institute of Public Health. The
second version titled GYTS Online is housed on all official GYTS website and can be
accessed by individuals at any given time with internet access from an official GYTS
website. GYTS Combined was derived by selecting the best of GYTS Original and
GYTS Online data sets. All comparisons conducted for this thesis were done manually on
a country by country basis. Data analysis was conducted utilizing MS-EXCEL software
specifically the formulas and functions tools. A total of 194 countries were chosen and
these countries were modeled after the countries utilized in The Tobacco Atlas (2012).
Then, GYTS Combined was compared with the GSHS data set and differences
estimates available from either GYTS or GSHS. Although initially the GYTS Factsheets
were to be one of the versions of GYTS data to be compared and utilized in GYTS
Combined, this was not possible because the factsheets did not provide confidence
interval estimates. Still, GYTS Factsheets were compared with GYTS Combined for
sample sizes and also for the corroboration of conflicting prevalence estimates from
either GYTS Original or Online. In the interest of having a globally representative
sample, the master data set included sources outside of GYTS and GSHS in order to find
smoking rates for countries that had data unavailable in either data sets. The criterion set
for these searches was as follows –highest priority given to national surveys by the native
government health agency. Otherwise, primary priority was still given to national or
nationally representative samples, an alternative preferred source was the Health
Behavior in School-aged Children (HBSC) data sets due to its similarity to both GYTS
and GSHS surveillance study design and objectives. For countries that did not have any
smoking prevalence estimates available after exhausting all available resources, regional
averages were applied in order to have an educated estimate listed in the master smoking
prevalence estimates document. Analysis wasn’t conducted for the outside sources
because the data utilized here is covered by both GSHS and GYTS. Additional estimates
found in this data set lack other comparable data estimates therefore they cannot be
compared and analyzed.
For GYTS vs. GSHS comparisons, the prevalence variance estimates were
derived by subtracting GYTS values from GSHS values.
In order to populate data that would capture the best of the estimates available, the
following criteria was set in no specific order of importance – in terms of data type, a
national sample was preferred over sub-national samples; for sample size, larger sample
sizes were selected over smaller ones; for sub-national samples, survey sites with capital
cities were preferred followed by administrative capitals, cities with the largest
population and finally any city available through the survey that is nationally
representative. Samples that were closer to the current year (2012) were preferred over
older ones; samples that presented conflicting data were corroborated with the
country-specific GYTS Factsheet and the samples matching the factsheet were utilized. In terms
of the order of importance, a nationally representative sample is sought to be the gold
standard set for the master data set therefore data that reflects as close to or are nationally
representative samples have been selected overall. GYTS Online was utilized as the
default data choice when presented with homologous options without any other means to
distinguish the better sample between the two data sets (Ex: Same year of survey). The
rationale behind this was to utilize a data set that can be accessed in real time by anyone
seeking information through an official GYTS website. When presented with conflicting
and inconsistent data from one data set the other data set was utilized.
While these were the primary criterion set, these rules were not all inclusive and
an overarching theme of reliability, representativeness and recent was applied when
selecting data. As stated above, the primary goal was to select the best data available in
CHAPTER IV
RESULTS
4.1 GYTS Online vs. Original
4.1.1 GYTS Online vs. Original – By Gender
When comparing the various subsets of GYTS data sets (Original vs. Online), it
was established that out of a total of 194 countries, data was available for 161 countries.
Of these, 33 countries did not have data available. Out of the 161 countries with available
data, 130 countries (80.7%) had matching data in both the GYTS Original and GYTS
online data sets. For the 31 countries (19.3%) that contained conflicting smoking
estimates, 13 were sourced from the original data set (41.9%) and the remaining 18
[image:40.612.105.420.453.547.2](58.1%) were chosen from the data available on official GYTS websites.
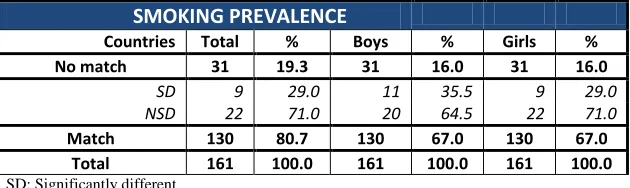
Table 3. GYTS Online vs. Original – By Gender
SMOKING PREVALENCE Countries Total % Boys % Girls % No match 31 19.3 31 16.0 31 16.0
SD 9 29.0 11 35.5 9 29.0
NSD 22 71.0 20 64.5 22 71.0
Match 130 80.7 130 67.0 130 67.0 Total 161 100.0 161 100.0 161 100.0 SD: Significantly different
NSD: Not significantly different
Table 3 details nine non-matching countries (29.0%) between GYTS Online and
GYTS Original that consisted of significant differences between each other when
comparing the total smoking estimates. For the boys’ data, 11 countries (35.5%) had
significantly different results. Similarly, nine countries (29.0%) were significantly
estimates for all three variables – total, boys and girls. Appendix 1 lists the 31 countries
that have varying estimates between the GYTS versions (Online vs. Original) along with
[image:41.612.54.543.231.541.2]results of the comparison between total, boys’ and girls’ smoking prevalence estimates.
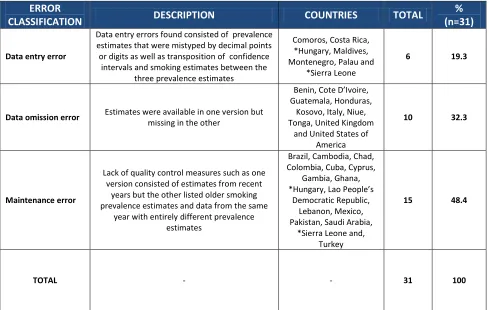
Table 4. GYTS Online vs. Original – Error Classifications
ERROR
CLASSIFICATION DESCRIPTION COUNTRIES TOTAL
% (n=31)
Data entry error
Data entry errors found consisted of prevalence estimates that were mistyped by decimal points or digits as well as transposition of confidence
intervals and smoking estimates between the three prevalence estimates
Comoros, Costa Rica, *Hungary, Maldives, Montenegro, Palau and
*Sierra Leone
6 19.3
Data omission error Estimates were available in one version but missing in the other
Benin, Cote D’Ivoire, Guatemala, Honduras,
Kosovo, Italy, Niue, Tonga, United Kingdom
and United States of America
10 32.3
Maintenance error
Lack of quality control measures such as one version consisted of estimates from recent
years but the other listed older smoking prevalence estimates and data from the same
year with entirely different prevalence estimates
Brazil, Cambodia, Chad, Colombia, Cuba, Cyprus,
Gambia, Ghana, *Hungary, Lao People’s
Democratic Republic, Lebanon, Mexico, Pakistan, Saudi Arabia,
*Sierra Leone and, Turkey
15 48.4
TOTAL - - 31 100
*Hungary & Sierra Leone consist of two error types but have only been counted once because only distinct countries have been taken into account when calculating total numbers and percentages
Table 4 lists the countries with varying data between GYTS Original and GYTS
Online and classifies the types of discrepancies found during the comparison process.
With the information gathered in Table 4, we can surmise the following points regarding
the nature of discrepancies and the possible reasons they occurred. A total of six
attributed to data entry errors. The data entry errors could be further isolated into
prevalence estimates that were mistyped by decimal points or digits (Ex: Comoros,
Hungary, Montenegro, and Sierra Leone) transposition of confidence intervals and
smoking prevalence estimates between Total, Boys and Girls (Ex: Costa Rica, Maldives
and Palau). A total of ten non-matching countries (32.3%) had data available in one
version but not the other thus being classified as a data omission error. For example, 5
countries utilized GYTS Online (Benin, Cote D’Ivoire, Guatemala, Honduras and
Kosovo) because GYTS Original did not have any data available. Similarly, an additional
five distinct countries utilized GYTS Original (Italy, Niue, Tonga, United Kingdom and
United States of America) because GYTS Online did not have any data available. Finally,
48.4% of all non-matching countries (n=31) or a total of 15 distinct countries have been
classified as maintenance errors. The maintenance errors could be further isolated into
two major sub-errors - completely different smoking prevalence estimates for data listed
as the same survey year (Ex: Chad, Columbia, Cyprus, Hungary and Sierra Leone) and
one version consisted of smoking prevalence estimates from a more recent survey year
than in the other version countries (Ex: Brazil, Cambodia, Cuba, Gambia, Ghana, Lao
People’s Democratic Republic, Lebanon, Mexico, Pakistan and Saudi Arabia). It is worth
noting that Hungary and Sierra Leone were the only two countries that consisted of more
than one error types. However, they were only counted once to avoid misrepresenting the
total number of distinct countries that consisted of discrepancies between the two
Data entry errors can be resolved by conducting cross-checking and quality
control of the different versions of data sets. Data omission errors can be also be resolved
by taking the same measure and inserting data from the version that has it available to the
one that missing the entry altogether. Similarly, countries that have data available from
surveys that were conducted more recently in one version but listed results from older
survey years in another version could be reconciled by conducting regular updates,
cross-checking and maintenance of database, web pages and documents. Taken together, the
three error type can all be classified as quality control errors.
[image:43.612.57.571.397.512.2]4.1.2 GYTS Online vs. Original – By Region
Table 5. GYTS Online vs. Original – Total smoking prevalence by region
TOTAL SMOKING PREVALENCE
Countries AFRO % AMRO % EMRO % EURO % SEARO % WPRO % TOTAL %
No match 7 16.3 8 23.5 3 14.3 7 13.0 1 10.0 5 23.8 31 19.3
SD 3 42.8 1 12.5 1 33.3 2 28.6 0 0 2 40.0 9 5.6
NSD 4 57.2 7 87.5 2 66.7 5 71.4 1 100 3 60.0 22 13.7
Match 36 83.7 26 76.5 18 85.7 25 46.3 9 90.0 16 76.2 130 80.7
Total 43 100 34 100 21 100 32 100 10 100 21 100 161 100 SD: Significantly different | NSD: Not significantly different
In terms of regional differences in the prevalence estimates between the two data sets,
Table 5 details that for all non-matching total smoking prevalence estimates, the AFRO
region (42.8%) was found to have the most number of significantly different estimates
followed by WPRO (40.0%), EMRO (33.3%), EURO (28.6%) and AMRO (12.5%). The
SEARO region (0%) was the lowest among all the regions and did not consist of any
4.2 GYTS vs. GSHS
4.2.1 GYTS vs. GSHS – By Gender
Smoking prevalence estimates were populated for a total of 194 countries to meet
the objectives set in this thesis. Among these 194 countries, we identified 53 countries
(27.3%) that had also conducted GYTS surveys. Therefore, the 53 countries were utilized
to see how smoking prevalence estimates differed from each other between GYTS and
GSHS. GYTS Combined was utilized as the GYTS comparison since the Combined
version followed a methodological outline described in section 3.4 and thus provides the
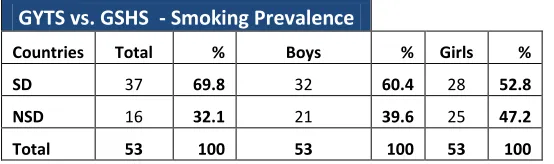
best estimate of the GYTS values. As detailed in Table 6, 37 countries of the total 53
countries (69.8%) with both GYTS and GSHS estimates were found to have significant
differences between each other when comparing the total smoking estimates. For the
boys’ estimates, 32 countries (60.4%) had significantly different results. Similarly, 28
countries (52.8%) were significantly different for the girls. Overall, 15 countries (28.3%)
of these countries had significantly different estimates for all three smoking prevalence
estimates – total, boys and girls. Appendix 2 lists the 53 countries that are in common
between GSHS and GYTS, along with results of the comparison between total, boys’ and
[image:44.612.107.384.619.701.2]girls’ smoking prevalence estimates.
Table 6. GSHS vs. GYTS – By Gender
GYTS vs. GSHS - Smoking Prevalence
Countries Total % Boys % Girls %
SD 37 69.8 32 60.4 28 52.8
NSD 16 32.1 21 39.6 25 47.2
Total 53 100 53 100 53 100
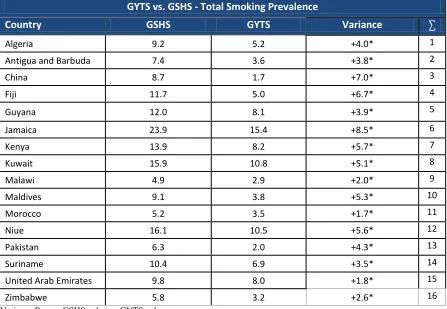
In terms of common survey sites, Table 7A and 7B list the variance between the
prevalence estimates of non-matching countries with significantly different estimates for
total smoking provided by GSHS and GYTS. For total smoking prevalence estimates, the
overall variance range was -10.3% (Cook Islands) to +8.5% (Jamaica). Of the
significantly different estimates, Table 7A lists the remaining 16 significantly different
countries (43.2%) that had a positive variance indicating that GSHS values were higher
[image:45.612.108.555.366.675.2]than GYTS values.
Table 7A. GYTS vs. GSHS – Countries with significantly different total smoking estimates and a positive prevalence variance
GYTS vs. GSHS - Total Smoking Prevalence
Country GSHS GYTS Variance ∑
Algeria 9.2 5.2 +4.0* 1
Antigua and Barbuda 7.4 3.6 +3.8* 2
China 8.7 1.7 +7.0* 3
Fiji 11.7 5.0 +6.7* 4
Guyana 12.0 8.1 +3.9* 5
Jamaica 23.9 15.4 +8.5* 6
Kenya 13.9 8.2 +5.7* 7
Kuwait 15.9 10.8 +5.1* 8
Malawi 4.9 2.9 +2.0* 9
Maldives 9.1 3.8 +5.3* 10
Morocco 5.2 3.5 +1.7* 11
Niue 16.1 10.5 +5.6* 12
Pakistan 6.3 2.0 +4.3* 13
Suriname 10.4 6.9 +3.5* 14
United Arab Emirates 9.8 8.0 +1.8* 15
Zimbabwe 5.8 3.2 +2.6* 16
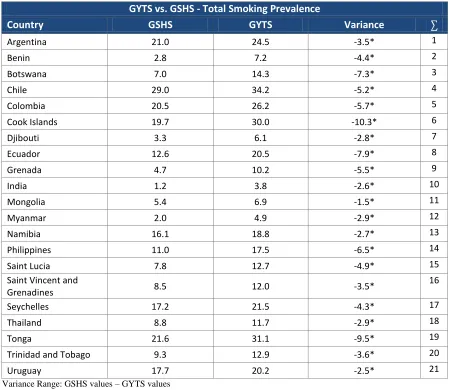
Likewise, Table 7B lists 21 out of 37 (56.8%) significantly different countries
where GSHS values that were lower than GYTS values, therefore consisting of a negative
[image:46.612.106.556.297.687.2]prevalence variance.
Table 7B. GYTS vs. GSHS – Countries with significantly different total smoking estimates and a negative prevalence variance
GYTS vs. GSHS - Total Smoking Prevalence
Country GSHS GYTS Variance ∑
Argentina 21.0 24.5 -3.5* 1
Benin 2.8 7.2 -4.4* 2
Botswana 7.0 14.3 -7.3* 3
Chile 29.0 34.2 -5.2* 4
Colombia 20.5 26.2 -5.7* 5
Cook Islands 19.7 30.0 -10.3* 6
Djibouti 3.3 6.1 -2.8* 7
Ecuador 12.6 20.5 -7.9* 8
Grenada 4.7 10.2 -5.5* 9
India 1.2 3.8 -2.6* 10
Mongolia 5.4 6.9 -1.5* 11
Myanmar 2.0 4.9 -2.9* 12
Namibia 16.1 18.8 -2.7* 13
Philippines 11.0 17.5 -6.5* 14
Saint Lucia 7.8 12.7 -4.9* 15
Saint Vincent and
Grenadines 8.5 12.0 -3.5*
16
Seychelles 17.2 21.5 -4.3* 17
Thailand 8.8 11.7 -2.9* 18
Tonga 21.6 31.1 -9.5* 19
Trinidad and Tobago 9.3 12.9 -3.6* 20
Uruguay 17.7 20.2 -2.5* 21
Variance Range: GSHS values – GYTS values
In terms of regional variation in the total smoking prevalence estimates between
the two data sets, Table 8A details that WPRO (87.5%) had the largest number of
significantly different estimates followed by AMRO (86.5%), SEARO (80.0%), EMRO
(55.6%), and AFRO (57.1%). The EURO region did not consist of any significantly
different estimates. This can be due to the EURO region missing data on the most number
[image:47.612.84.593.321.396.2]of countries in comparison to all other regions.
Table 8A. GYTS vs. GSHS – Total smoking prevalence by region
GSHS vs. GYTS – TOTAL SMOKING PREVALENCE
Countries AFRO % AMRO % EMRO % EURO % SEARO % WPRO % TOTAL %
SD 8 57.1 13 86.7 5 55.6 0 0 4 80.0 7 87.5 37 69.8
NSD 6 42.9 2 13.3 4 44.4 2 100.0 1 20.0 1 12.5 16 30.2
Total 14 100 15 100 9 100 2 100 5 100 8 100 53 100
SD: Significantly different NSD: Not significantly different
Africa
For the AFRO region, Table 8B.1 exemplifies that 50% (n=4) of significantly
different estimates for total smoking prevalence consisted of a positive prevalence
indicating that GSHS values are higher than GYTS values.
Table 8B.1. GYTS vs. GSHS – Countries with significantly different total smoking estimates in the AFRO region and a positive prevalence variance
GYTS vs. GSHS - Total Smoking Prevalence (AFRO)
Country GSHS Prevalence GYTS Prevalence Prevalence Variance ∑
Algeria 9.2 5.2 +4.0* 1
Kenya 13.9 8.2 +5.7* 2
Malawi 4.9 2.9 +2.0* 3
Zimbabwe 5.8 3.2 +2.6* 4
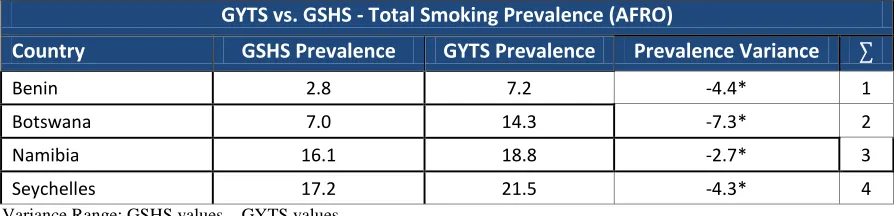
[image:47.612.106.555.584.689.2]Likewise, the other half (n=4) as detailed in Table 8B.2 consisted of a negative
prevalence variance thus indicating that GSHS values were lower than GYTS.
Table 8B.2. GYTS vs. GSHS – Countries with significantly different total smoking estimates in the AFRO region and a negative prevalence variance
GYTS vs. GSHS - Total Smoking Prevalence (AFRO)
Country GSHS Prevalence GYTS Prevalence Prevalence Variance ∑
Benin 2.8 7.2 -4.4* 1
Botswana 7.0 14.3 -7.3* 2
Namibia 16.1 18.8 -2.7* 3
Seychelles 17.2 21.5 -4.3* 4
Variance Range: GSHS values – GYTS values
The Americas
For AMRO, Table 8C.1 details that 30.8% (n=4) of significantly different
estimates for total smoking prevalence consist of a positive prevalence indicating that
GSHS values are higher than GYTS values.
Table 8C.1. GYTS vs. GSHS – Countries with significantly different total smoking estimates in the AMRO region and a positive prevalence variance
GYTS vs. GSHS - Total Smoking Prevalence (AMRO)
Country GSHS Prevalence GYTS Prevalence Prevalence Variance ∑
Antigua and Barbuda 7.4 3.6 +3.8* 1
Guyana 12.0 8.1 +3.9* 2
Jamaica 23.9 15.4 +8.5* 3
Suriname 10.4 6.9 +3.5* 4
Variance Range: GSHS values – GYTS values
Likewise, 69.2% (n=9) as detailed in Table 8C.2 consisted of a negative
[image:48.612.107.554.271.379.2] [image:48.612.108.557.540.647.2]