https://doi.org/10.5194/hess-23-3593-2019 © Author(s) 2019. This work is distributed under the Creative Commons Attribution 4.0 License.
A soil non-aqueous phase liquid (NAPL) flushing laboratory
experiment based on measuring the dielectric properties of
soil–organic mixtures via time domain reflectometry (TDR)
Alessandro Comegna1, Antonio Coppola1, Giovanna Dragonetti2, and Angelo Sommella3
1School of Agricultural Forestry, Food, and Environmental Sciences (SAFE), University of Basilicata, Potenza, Italy 2Mediterranean Agronomic Institute, Land and Water Division, IAMB, Bari, Italy
3Department of Agriculture, University of Naples Federico II, Naples, Italy
Correspondence:Alessandro Comegna ([email protected]) Received: 4 April 2019 – Discussion started: 29 April 2019
Revised: 25 July 2019 – Accepted: 6 August 2019 – Published: 4 September 2019
Abstract.The term non-aqueous phase liquid (NAPL) refers to a group of organic compounds with scarce solubility in water. They are the products of various human activities and may be accidentally introduced into the soil system. Given their toxicity level and high mobility, NAPLs constitute a se-rious geo-environmental problem. Contaminant distribution in the soil and groundwater contains fundamental informa-tion for the remediainforma-tion of polluted soil sites. The present research explored the possible employment of time domain reflectometry (TDR) to estimate pollutant removal in a silt-loam soil that was primarily contaminated with a corn oil as a light NAPL and then flushed with different washing solu-tions. Known mixtures of soil and NAPL were prepared in the laboratory to achieve soil specimens with varying pol-lution levels. The prepared soil samples were repacked into plastic cylinders and then placed in testing cells. Washing so-lutions were then injected upward into the contaminated sam-ple, and both the quantity of remediated NAPL and the bulk dielectric permittivity of the soil sample were determined. The above data were also used to calibrate and validate a di-electric model (theαmixing model) which permits the vol-umetric NAPL content (θNAPL; m3m−3) within the
contami-nated sample to be determined and quantified during the dif-ferent decontamination stages. Our results demonstrate that during a decontamination process, the TDR device is NAPL-sensitive: the dielectric permittivity of the medium increases as the NAPL volume decreases. Moreover, decontamination progression can be monitored using a simple (one-parameter) mixing model.
1 Introduction
Soil and groundwater contamination with non-aqueous phase liquid (NAPL) from point or nonpoint sources is a se-vere problem of considerable complexity (Fitts, 2002; Fetter, 1993). The repercussions concern not only the deterioration of the soil’s physical, mechanical and chemical properties but also account for a potentially severe hazard to the well-being of humans and other living species (Freeze, 2000).
Soil flushing is the technical procedure used for treating polluted soils with water, surfactants and co-solvents (such as methanol, ethanol and propanols). Surfactant-enhanced flushing was developed from the conventional pump-and-treat method. The success of this approach is related to the capacity of such chemical compounds to greatly enhance the aqueous solubility of oils (Pennell et al., 1994; Parnian and Ayatollahi, 2008).
There is high interfacial tension between NAPL and water molecules that makes water a non-efficient cleaning material in removing NAPL from the soil. Instead, surfactants and co-solvent agents can promote the enhanced removal of NAPL from the subsurface through mobilization and solubilization (Martel et al., 1998; Rinaldi and Francisca, 2006; Parnian and Ayatollahi, 2008).
NAPL phase is referred to as trapped residual NAPL (or NAPL residual saturation), and its remediation is referred to as secondary remediation (Parnian and Ayatollahi, 2008). Residual NAPL is a long-term source of soil and groundwa-ter pollution (Mercer and Cohen, 1990; Troung Hong and Bettahar, 2000).
To develop powerful decontamination procedures, the characterization of polluted soils is required. Practices usu-ally employed to characterize polluted soil sites are coring, soil sampling and the installation of monitoring wells for the collection of water samples from aquifers (Mercer and Cohen, 1990). Since the above procedures are costly, dif-ferent dielectric techniques can be used to detect organic contaminants in soils. The most widely accepted geophys-ical technique, based on the principle of electromagnetic wave (EMW) propagation, is the ground-penetrating radar (GPR; Knight, 2001). Redman et al. (1991) described some field experiments in the application of GPR to detect NAPL plumes.
Rinaldi and Francisca (2006) used a coaxial impedance di-electric reflectometry (CIDR) technique to measure the com-plex dielectric permittivity in sands contaminated by a paraf-fin oil. Their research into the dielectric behavior of NAPL-contaminated soils during a decontamination process mainly focused on the removal efficiency of different washing so-lutions and on the spectral response of the contaminated medium during the various tests conducted.
Time domain reflectometry (TDR) is a further geophys-ical device based on electromagnetic wave (EMW) princi-ples that can also be used for this purpose (Endres and Red-man, 1993; Redman and DeRyck, 1994; Mohamed and Said, 2005; Moroizumi and Sasaki, 2006; Francisca and Montoro, 2012). Few experiments have been conducted coupling the TDR technique and NAPL. In these studies estimation of NAPLs using TDR measurements of dielectric properties re-lies greatly on various mixing models relating the measured dielectric permittivity to the volume fractions of the pore fluids and various soil phases such as solid, water, air and NAPLs (van Dam et al., 2005).
Some interesting results were achieved by Persson and Berndtsson (2002) whilst investigating the influence of dif-ferent LNAPLs (i.e., light NAPLs) on TDR measurements in a homogeneous silica sand under saturated and unsatu-rated soil conditions. Measurements of both dielectric per-mittivity and electrical conductivity allowed a method to be developed (the two-step method) which measured the dielec-tric properties of the system against the amount of NAPL in soils. Comegna et al. (2016) developed a general TDR-based methodology for evaluating the correlations between the di-electric response and the NAPL content in variable saturated soils with different textures and pedological characteristics.
The purpose of this study was as follows: (i) to investi-gate a possible extension of TDR technology to assess the effects of NAPL removal in soils and (ii) revisit, on the basis of the acquired data and the experimental results, a dielectric
model to predict, “in real time”, the volumetric amounts of NAPL (θNAPL) within the contaminated soil during the
de-contamination process.
2 Theoretical concepts of TDR
TDR is a geophysical technique employed to determine the dielectric permittivity of liquids and solids (Ferrè and Topp, 2002, described this method in detail). In general, the bulk dielectric permittivity is a complex term (ε∗r), which may be expressed as follows (Robinson et al., 2003):
εr∗=ε0r−j
εr00+ σ ωε0
, (1)
whereεr0is the real part of dielectric permittivity, which gives the energy stored in the dielectrics at a certain frequency and temperature, andεr00is the imaginary part due to relaxations. The zero-frequency conductivityσ, the angle frequencyω, the imaginary number j=
√
−1 and the permittivity ε0in
free space contribute to definingεr∗.
When the frequency of a TDR cable tester ranges be-tween 200 MHz and 1.5 GHz, dielectric losses can be con-sidered minimal (Heimovaara, 1994), and the bulk dielectric permittivity εb (∼= the real part of permittivity) of a probe
of length L is determined from the propagation velocity v(=2L/t )of an electromagnetic wave along the wave guide across the investigated medium by the following expression: εb=
c v
2
, (2)
wherec(=3×10⁸m s−1) is the velocity of an electromag-netic wave in vacuum (Topp et al., 1980) andtis travel time, i.e., the time required by the generated signal to go back and forth through the TDR probe of lengthL (m). This can be calculated as follows:
t=2L c
√
εb. (3)
The direct dependence of the signal’s travel timet on soil dielectric permittivity is expressed by Eq. (3).
3 Estimating volumetric NAPL content during a decontamination process in soils
1991; Persson and Berndtsson, 2002; Francisca and Mon-toro, 2012; Comegna et al., 2013a, 2016, 2017).
Based on such models, in the present study, we analyze the possibility of predicting the correlations between the vol-umetric contents of NAPL (θNAPL) and the dielectric
re-sponse (εb) of contaminated soil during the progression of
a steady-state remediation process.
In the present research, we chose the so-called α model (Birchack et al., 1974; Knight and Endres, 1990; Roth et al., 1990):
εb= " n
X
i=1
Viεαi #1/α
, (4)
whereViis the volume andεiis the permittivity of each com-ponent of the complex medium; the excom-ponentαis a fitting pa-rameter (αvaries between−1 and 1), which may be related to the internal structure of the investigated medium (Hilhorst, 1998; Coppola et al., 2013, 2015). Under the following hy-pothesis, (i) the soil is homogeneous from a textural point of view, and (ii) when the soil porosity (φ) is constant, Eq. (4) was reformulated for our purposes.
For mixtures of soil (s) saturated with a certain amount of washing solution (ws), in rearranging the model formula-tion of Rinaldi and Francisca (2006), theαmodel yields the following:
εs-wsα =
(1−φ)εsα+φεwsα
, (5)
where εs-ws is the soil-washing solution permittivity, and
εs andεwsare the permittivities of soil particles and
wash-ing solutions, respectively. By the same token, for soil or-ganic (s-NAPL) compounds at saturation, theα model can be expressed as follows:
εs-NAPLα =(1−φ)εαs +φεαNAPL, (6) whereεs-NAPLis the permittivity of the soil–NAPL mixture,
andεNAPLis the oil permittivity.
A medium consisting of soil particles, washing solution and NAPL (s-ws-NAPL) can be viewed as a mix of soil-washing solution (Eq. 5) and soil–NAPL (Eq. 6):
εs-ws-NAPLα =
βεs-NAPLα +(1−β)εαs-ws
, (7)
where β is the relative volume of NAPL contained in the whole fluid phase,
β= θNAPL (θws+θNAPL)
=θNAPL θf
, (8)
whereθfis the volumetric fluid content (m3m−3), the sum of
the volumetric washing solution content (θws) and
volumet-ric NAPL content (θNAPL); β varies between 0 (i.e., a
soil-washing solution mixture) and 1 (i.e., a soil–NAPL mixture).
To estimateθNAPL, Eq. (7) is first reformulated in terms
ofβ:
β=ε α
s-ws−εαs-ws-NAPL
εα
s-ws−εαs-NAPL
= (1−φ)ε
α
s +φεαws−εs-ws-NAPLα
(1−φ)εα s +φεwsα
− (1−φ)εα
s +φεαNAPL
. (9)
Substituting Eq. (8) into Eq. (9), and considering that for a saturated medium, the volumetric fluid content is equal to soil porosity (i.e.,θf=φ),θNAPL can be calculated as
fol-lows: θNAPL=
(1−φ)εαs +φεαws−εs-ws-NAPLα εα
ws−εαNAPL
. (10)
Equation (10) correlates the dependence of volumetric NAPL content with soil porosity;θNAPL can be estimated (within
the contaminated soil) during the progression of a reme-diation process once the dielectric permittivity of the soil-contaminated mixture (εs-ws-NAPL) is known.
4 Materials and methods 4.1 Soil and fluid properties
A silt-loam anthrosol (IUSS Working Group WRB, 2006) from the region of Puglia (Italy) was used for this study. The soil texture was measured by means of the hydrom-eter method (Day, 1965), while the Walkley–Black proce-dure (Allison, 1965) was used to determine soil organic C content. The method developed by Miller and Curtis (2006) was used to measure soil electrical conductivity (ECw), while
soil pH was determined on the basis of a 1:1 soil-to-water ratio (Eckert, 1988). In textural terms, the soil comprised 15.7 % sand, 11.6 % clay and 72.4 % silt. Soil porosity was 0.57 %, organic content was 1.84 %, ECw was 0.17 dS m−1
and soil pH was 8.40.
The NAPL employed for the laboratory tests was corn oil (εNAPL=3.2; ECNAPL=0.055 dS m−1at 25◦C) with a
density of 0.905 g cm−3(at 25◦C). Three different removal solutions were employed for soil cleaning: (a) a first solu-tion (referred to below as wd) composed of 99 % distilled water and 1 % commercial detergent (εd=9.22, at 25◦C);
(b) a second solution (wda no. 1) composed of 90 % dis-tilled water, 1 % commercial detergent and 9 % methanol as co-solvent (εalcohol=26.13, at 25◦C); and (c) a third
solu-tion (wda no. 2) composed of distilled water (85 %) with commercial detergent (1 %) and methanol (14 %). The di-electric permittivity of the washing solutions, measured at 25◦C, wasεwd=75.04,εwda no.1=68.98 andεwda no.2=
65.92, whereas the dielectric permittivity of the tested soil saturated with each of the three cleaning solutions was εsoil+wd=34.59,εsoil+wda no.1=31.04 andεsoil+wda no.2=
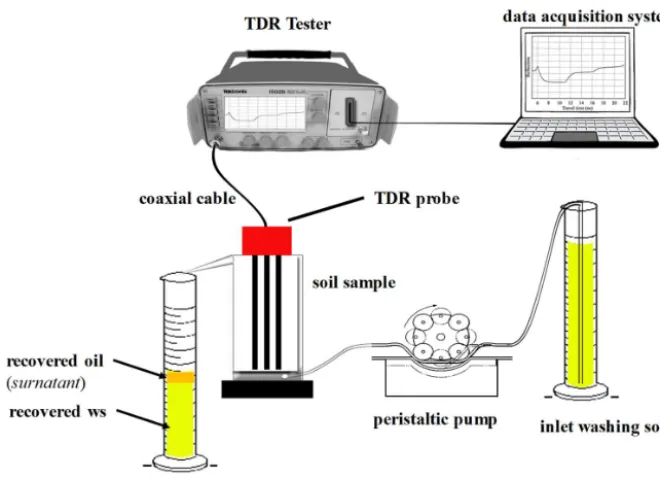
Figure 1.Experimental setup used in the NAPL removal experiments (from Comegna et al., 2013c).
4.2 Measurement of dielectric permittivity of soil–NAPL-contaminated samples during soil remediation
4.2.1 Experimental setup
As illustrated in Fig. 1, the experimental layout consisted of the following: (i) a Tektronix (model 1502C) cable tester, (ii) a three-rod probe, 14.5 cm long, with a wire diameter of 0.003 m and a wire spacing of 0.02 m, introduced verti-cally into the soil samples, (iii) a testing cell, 0.15 m high and 0.08 m in diameter, and (iv) a peristaltic pump used for upward movement of the washing solution.
4.2.2 Sample preparation and testing procedures
Soil was oven dried at 105◦C and passed through a 2 mm sieve. Known amounts of soil and oil were mixed together, shaken, and then kept for 24 h in sealed plastic bags to avoid any evaporation and ensure a uniform distribution of oil within the sample and good oil adsorption by the soil ma-trix. The samples were then allocated to cylindrical boxes. With a view to achieving different degrees of (initial) soil contamination, volumetric NAPL content (θNAPL) was
var-ied from 0.05 to 0.40 (in steps of 0.05). In all, each washing solution comprised eight oil-contaminated soil samples.
For all experiments, the soil samples were placed in the vessels in various steps at a bulk density of 1.13 g cm−3. During TDR measurements, the soil samples were conserved at a temperature of 25◦C by using a thermostat box. Re-mediation was performed using an upward flux of diverse pore volumesT of three washing solutions (wd, wda no. 1
and wda no. 2) supplied at the rate of 90 cm3h−1, corre-sponding to a Darcian velocity of 1.8 cm h−1. After col-lection of the outflow from the soil columns, the surnatant NAPL was separated from the washing solution and the quantity of NAPL remediated from the soil was determined. The obtained data series were employed to calibrate the proposed dielectric model of Eq. (10). An independent dataset, obtained in the same manner as the calibration dataset, was used for model validation.
4.3 Numerical indices for model performance evaluation
The goodness of Eq. (10) was evaluated using two different criteria: (i) the mean bias error (MBE) and (ii) the model ef-ficiency (EF), computed according to the following relations (Legates and McCabe Jr., 1999):
MBE= N P
i=1
(Ei−Oi)
N , (11)
EF=1− N P
i=1
(Ei−Oi)2 N
P
i=1
Oi−O 2
, (12)
whereEi andOi are respectively the expected and the ob-served value,Ois the mean of the observed data, andN is the number of observations.
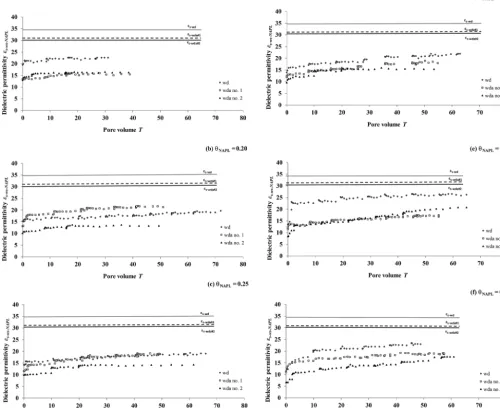
Figure 2.Selection of experimental relationships between the measured dielectric permittivity (εs-ws-NAPL) and number of pore volumesT
under the effect of different washing solutions: (i) water–detergent (wd) and (ii) water–detergent–alcohol (wda no. 1 and wda no. 2).
to indicate average overprediction, while negative values indicate underprediction). The model’s ability to forecast θNAPL is described by parameter EF, according to which
EF=1 indicates perfect accord between predicted and mea-sured data.
5 Results and discussion
5.1 Influence of washing solution on NAPL removal
Figure 2a–f, with reference to the most representative exper-imental results, reveal the influence of pore volumes T on evaluated bulk dielectric permittivity (εs-ws-NAPL) for the soil
specimens initially polluted with oil. As the washing solu-tion started to remove oil, the dielectric permittivity rose due
to the larger dielectric permittivity of the flushing mixture. As the remediation solution continued to move upward, the rising rate of the dielectric permittivity decreased and asymp-totically approached a constant value. This steady value was smaller than that observed when the soil specimens were completely saturated by only the flushing solution (i.e., wd, wda no. 1 or wda no. 2), which in our tests corresponds to the condition of a completely decontaminated soil. This dif-ference in values is undoubtedly due to oil confined in soil pores (i.e., NAPL residual saturation). For the same reason, residual saturation may explain why insignificant oil reme-diation was observed forθNAPL values less than 0.15. This
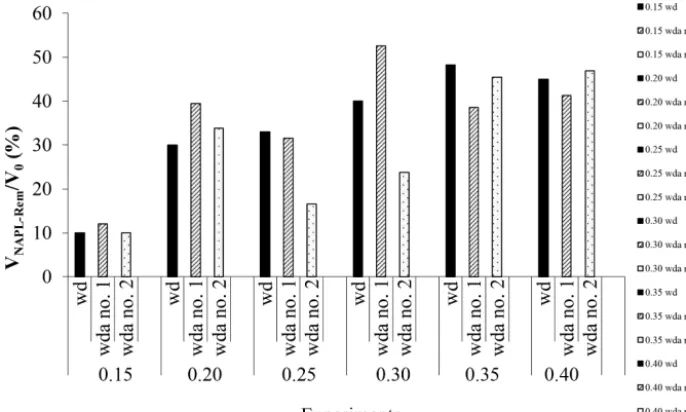
Figure 3.Volume of NAPL recovered (VNAPL-Rem) with respect to the initial volume of NAPL present in the soil sample (V0) of different
washing solutions (wd, wda no. 1 and wda no. 2) for different experiments (θNAPL=0.15, 0.20, 0.25, 0.30, 0.35 and 0.40).
means that θNAPL is close to the limiting “residual value”,
and thus NAPL loses its ability to move in the soil in re-sponse to a hydraulic gradient (i.e., capillary retention forces are greater than gravitational forces, which tend to immobi-lize the NAPL; Brost and DeVaull, 2000).
The NAPL volumes removed for different washing solu-tions and the initial volumetric content of NAPL are com-pared in Fig. 3. For all the three cleaning solutions adopted, the experiments ultimately demonstrate (for a fixedθNAPL)
the same results in terms of soil decontamination, and they show that NAPL removal increases with increasingθNAPL. In
some cases (i.e.,θNAPL=0.15, 0.20 and 0.30), contaminated
samples flushed with the wda no. 1 solution yield slightly higher removal efficiency values compared to the samples flushed with wd and wda no. 2. Martel et al. (1998) sug-gest the need to investigate the best water–surfactant–alcohol combination in order to enhance NAPL solubilization in soil. 5.2 Model calibration and validation
For the model (Eq. 10) calibration methodology, with ref-erence to the three washing solutions (wd, wda no. 1 and wda no. 2), we analyze the effect of the measured di-electric permittivity on volumetric NAPL content (θNAPL) in
order to estimate theαparameter of the model. The complete calibration dataset of estimated αparameters is reported in Table 1. The α parameter of the mixing model was deter-mined, for a fixedθNAPL value and washing solution, by an
optimization procedure based on the least-squares technique and was kept constant for each of the remediation tests de-veloped.
[image:6.612.308.547.369.442.2]A permittivity value of 3.70 was adopted for the solid phase. This value was determined using the “immersion
Table 1.Estimatedαparameter of Eq. (10) for all three washing solutions (wd, wda no. 1 and wda no. 2) and the volumetric NAPL content (θNAPL) tested.
Parameter Washing θNAPL
solution
α
0.15 0.20 0.25 0.30 0.35 0.40 wd 0.45 0.30 0.49 0.65 0.67 0.55 wda no. 1 0.25 0.45 0.45 0.42 0.50 0.55 wda no. 2 0.20 0.45 0.30 0.45 0.55 0.52
method”, which is commonly employed for estimating theεs
of soils (Robinson and Friedman, 2003; Kameyama and Miyamoto, 2008; Comegna et al., 2013b).
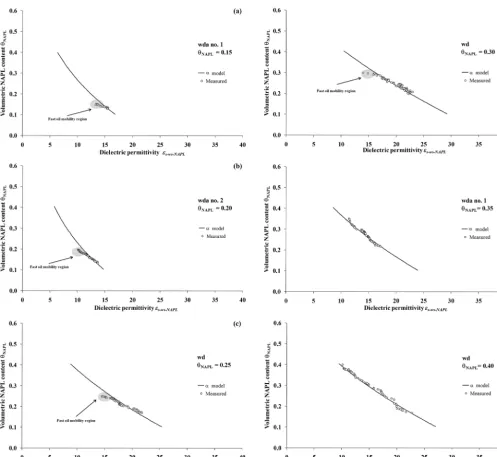
For the sake of brevity, a selection of the experimental εs-ws-NAPL−θNAPL relationships (validation dataset) is
re-ported in Fig. 4a–f. The data in Fig. 4 (except for Fig. 4e and f) show that some of the model-simulated values tend to overestimate the measured data. This behavior is mostly re-stricted to the beginning of the remediation process, when a rapid change in dielectric permittivity may be observed. This behavior was also verified in other tests (not shown here) and may be explained by invoking both NAPL properties such as liquid density; surface tension and viscosity; and soil prop-erties including moisture content, relative permeability and soil porosity (Brost and DeVaull, 2000; Wang et al., 2013).
Figure 4. (a–f)Selection of observed (symbols) and modeled (dashed lines) volumetric NAPL content (θNAPL) versus dielectric permittivity
(εs-ws-NAPL), with reference to the three washing solutions (wd, wda no. 1 and wda no. 2) used during the remediation tests.
the contaminated soil (see also Sect. 5.1 above). As long as the flushing continues, mobile pools are reduced and the oil tends increasingly to be trapped in the immobile areas. This means that, during soil cleaning, the capacity of non-wetting fluids to respond to gravitational forces gradually diminishes (Luckner et al., 1989). From a dielectric point of view, this mechanism may appear as a rapid dielectric permittivity in-crease (identified in Fig. 4 as a “fast oil mobility region”) within a few pore volumes. When this fast mobility mecha-nism is dominant, the predictions of Eq. (10) fail.
Another possible explanation for this discrepancy between the observed and the predicted permittivity values may be
linked to the propensity of NAPL-water mixtures to form macroinclusions in the soil (Persson and Berndtsson, 2002), which affected the initial pore-scale distribution of NAPL, and thus the global dielectric response of the medium (Ferré et al., 1996), during the first remediation stages.
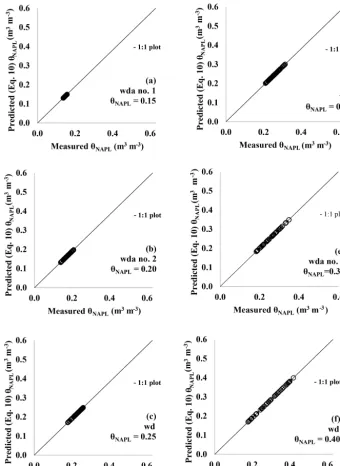
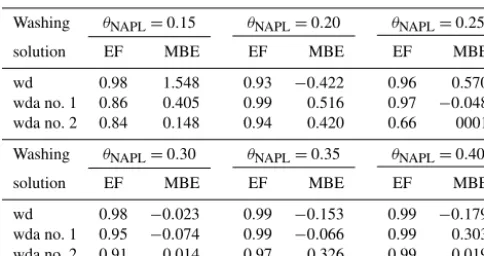
However, since the phenomenon is mostly limited to the initial part of the washing process, overall model effective-ness is not compromised, as also shown in Table 2, which summarizes the goodness-of-fit statistical indices, and in Fig. 5a–f, where the estimatedθNAPLfrom Eq. (10) and the
[image:7.612.51.548.61.518.2]Figure 5. (a–f) Measured (Eq. 10) vs. known volumetric NAPL content (θNAPL) of contaminated soils, with reference to the different
remediation tests in Fig. 4.
Overall, both graphical and quantitative evaluations in terms of MBE and EF reveal the suitability of the dielectric model adopted to estimate the volumetric NAPL content in theθNAPLrange 0.15–0.40.
6 Conclusions
This paper presented an extensive dataset of remediation ex-periments that were conducted on a laboratory scale using corn oil as a soil contaminant and three different solutions
for soil cleaning. The results of these tests were employed to investigate the potential of the TDR technique in monitoring the development of a steady-state decontamination process.
[image:8.612.127.468.65.532.2]Table 2.Model efficiency (EF) and mean bias error (MBE) statisti-cal indices, referring to measured and predicted (Eq. 10) volumetric NAPL content (θNAPL), calculated in the range of model
applica-bility (0.15≤θNAPL≤0.40).
Washing θNAPL=0.15 θNAPL=0.20 θNAPL=0.25
solution EF MBE EF MBE EF MBE
wd 0.98 1.548 0.93 −0.422 0.96 0.570 wda no. 1 0.86 0.405 0.99 0.516 0.97 −0.048 wda no. 2 0.84 0.148 0.94 0.420 0.66 0001 Washing θNAPL=0.30 θNAPL=0.35 θNAPL=0.40
solution EF MBE EF MBE EF MBE
wd 0.98 −0.023 0.99 −0.153 0.99 −0.179 wda no. 1 0.95 −0.074 0.99 −0.066 0.99 0.303 wda no. 2 0.91 0.014 0.97 0.326 0.99 0.019
indices confirmed a high accuracy in NAPL predictions of theαmodel at different stages during soil cleaning, with the only exception of the initial cleaning stage (confined to the low values ofT), where the eventual presence of a “fast flow region” may limit its applicability.
The approach requires additional experiments and datasets for model calibration and validation in different pedological contexts, mainly to confirm the potential of the methodology developed. Furthermore, an effort should be made, introduc-ing the water phase, ab initio in the experimental setup, to simulate a possible natural contamination–decontamination scenario more accurately. Finally, full field-scale tests should also be conducted to evaluate the performance of Eq. (10) in real field conditions.
Data availability. The dataset used in this paper is available on re-quest to [email protected].
Author contributions. The authors jointly collaborated on the de-velopment of the present research, which is based on ACom’s idea.
Competing interests. The authors declare that they have no conflict of interest.
Review statement. This paper was edited by Marnik Vanclooster and reviewed by Ty P. A. Ferré, Magnus Persson, and one anony-mous referee.
References
Allison, L. E.: Organic carbon, in: Methods of Soil Analysis, Part 1, Agron. Monograph, vol. 9, edited by: Klute, A., ASA and SSSA, Madison, 1367–1378, 1965.
Birchack, J. R., Gardner, C. Z. G., Hipp, J. E., and Victor, J. M.: High dielectric constant microwave probes for sensing soil mois-ture, Proc. IEEEE, 62, 93–98, 1974.
Brost, E. J. and DeVaull, G. E.: Non-Aqueous phase liquid (NAPL) mobility limits in soils, Soil Groundw. Res. Bull., 9, 1–9, 2000. Comegna, A., Coppola, A., Dragonetti, G., and Sommella, A.:
Di-electric response of a variable saturated soil contaminated by Non-Aqueous Phase Liquids (NAPLs), Proced. Environ. Sci., 19, 701–710, 2013a.
Comegna, A., Coppola, A., Dragonetti, G., Severino, G., Som-mella, A., and Basile, A.: Dielectric properties of a tilled sandy volcanic-vesuvian soil with moderate andic features, Soil Till. Res., 133, 93–100, 2013b.
Comegna, A., Coppola, A., Dragonetti, G., Chaali, N., and Som-mella, A.: Time domain reflectometry-measuring dielectric per-mittivity to detect soil non-aqueous phase liquids contamination-decontamination processes, J. Agricult. Eng., XLIV, e167, https://doi.org/10.4081/jae.2013.409, 2013c.
Comegna, A., Coppola, A., Dragonetti, G., and Sommella, A.: Es-timating non-aqueous phase liquid (NAPL) content in variable saturated soils using time domain reflectometry (TDR), Vadose Zone J., 15, 13, https://doi.org/10.2136/vzj2015.11.0145, 2016. Comegna, A., Coppola, A., Dragonetti, G., and Sommella, A.:
Inter-preting TDR signal propagation through soils with distinct layers of nonaqueous-phase liquid and water content, Vadose Zone J., 16, 5, https://doi.org/10.2136/vzj2017.07.0141, 2017.
Coppola, A., Dragonetti, G., Comegna, A., Lamaddalena, N., Caushi, B., Haikal, M. A., and Basile, A.: Measuring and model-ing water content in stony soils, Soil Till. Res., 128, 9–22, 2013. Coppola, A., Comegna, A., Dragonetti, G., Gerke, H. H., and Basile, A.: Simulated water flow and solute transport in shrinking soils, Vadose Zone J., 14, 9, https://doi.org/10.2136/vzj2015.02.0021, 2015.
Day, P. R.: Particle fractionation and particle-size analysis, in: Methods of Soil Analysis, Part 1, edited by: Black, C. A., Amer-ican Society of Agronomy, Madison, 545–567, 1965.
Eckert, D. J.: Soil pH, in: Recommended chemical soil test pro-cedures for the North Central Region, edited by: Dahnke, W. C., North Bulletin No. 221, Dakota Agricultural Experiment Station, Fargo, 6–8, 1988.
Endres, A. and Redman, J. D.: Modeling the electrical properties of porous rocks and soils containing immiscible contaminants, edited by: Bell, R. S. and Lepper, C. M., in: Proceedings of the Symposium on the application of geophysics to Engineering and Environmental Problems, San Diego, 21–38, 1993.
Ferré, P. A. and Topp, G. C.: Time domain reflectometry, in: Meth-ods of Soil Analysis: Part 4, Physical MethMeth-ods, edited by: Dane, J. H. and Topp, G. C., SSSA, Madison, WI, 434–446, 2002. Ferré, P. A., Rudolph, D. L., and Kachanoski, R. G.: Spatial
averag-ing of water content by time domain reflectometry: Implications for twin rod probes with and without dielectric coatings, Water Resour. Res., 32, 271–279, 1996.
Fitts, C. R.: Contamination sources, in: Groundwater Science, Aca-demic Press, London, 339–343, 2002.
Francisca, M. and Montoro, M. A.: Measuring the dielectric proper-ties of soil-organic mixtures using coaxial impedance dielectric reflectometry, J. Appl. Geophys., 80, 101–109, 2012.
Freeze, R. A.: The unpleasant truths about waste management, in: The Environmental Pendulum, University of California Press, Berkeley, 147–196, 2000.
Heimovaara, T. J.: Frequency domain analysis of time domain re-flectometry waveforms, 2, A four-component complex dielectric mixing model for soil, Water Resour. Res., 30, 201–209, 1994. Hilhorst, M. A.: Dielectric characterisation of soil, PhD
disser-tation, Wageningen Agricultural University, Wageningen, the Netherlands, 1998.
IUSS Working Group WRB: World reference base for soil re-sources 2006: A framework for international classification, correlation and communication, 2nd Edn., World Soil Re-sour. Rep. 103, FAO, Rome, 2006.
Kameyama, K. and Miyamoto, T.: Measurement of solid phase per-mittivity for soils by time domain reflectometry, Eur. J. Soil Sci., 59, 1253–1259, 2008.
Knight, R.: Ground penetrating radar for environmental applica-tions, Annu. Rev. Earth Planet. Sci., 29, 229–255, 2001. Knight, R. and Endres, A.: A new concept in modeling the dielectric
response of sandstones: Defining a wetted rock and bulk water systems, Geophysics, 55, 586–594, 1990.
Legates, D. R. and McCabe Jr., G. J.: Evaluating the use of “goodness-of-fit” measures in hydrologic and hydroclimatic model validation, Water Resour. Res., 35, 233–241, 1999. Luckner, L., van Genuchten, M. T., and Nielsen, D. R.: A
consis-tent set of parametric models for the two-phase flow of immisci-ble fluids in the subsurface, Water Resour. Res., 25, 2187–2193, 1989.
Martel, R., Gelinas, P. J., and Saumure, L.: Aquifer washing by micellar solutions: 3 Field test at the Thounin Sand Pit (L’Assomption Quebec, Canada), J. Contam. Hydrol., 30, 33–48, 1998.
Mercer, J. W. and Cohen, R. M.: A review of immiscible fluids in the subsurface: Properties, models, characterization, and remedi-ation, J. Contam. Hydrol., 6, 107–163, 1990.
Miller, J. J. and Curtis, D.: Electrical conductivity and soluble ions, in: Soil Sampling and Methods of Analysis, edited by: Carter, M. R. and Gregorich, E. G., Canadian Society of Soil Science, Broken Sound Pkwy, NW, 2006.
Mohamed, A.M.O., and Said R.A.: Detection of organic pollutants in sandy soils via TDR and eigendecomposition. J. Contain. Hy-drol., 76, 235–249, 2005.
Moroizumi, T. and Sasaki, Y.: Estimating the nonaqueous-phase liq-uid content in saturated sandy soil using amplitude domain re-flectometry, Soil Sci. Soc. Am. J., 72, 1520–1526, 2006. Parnian, M. M. and Ayatollahi, S.: Surfactant remediation of
LNAPL contaminated soil; effects of adding alkaline and foam producing substances, Iran. J. Chem. Eng., 2, 34–44, 2008.
Pennell, K. D., Jin, M., Abriola, L. M., and Pope, G. A.: Surfactant enhanced remediation of soil columns contaminated by residual tetrachloroethylene, J. Contam. Hydrol., 16, 35–53, 1994. Persson, M. and Berndtsson, R.: Measuring nonaqueous phase
liq-uid saturation in soil using time domain reflectometry, Water Resour. Res., 38, 1064, https://doi.org/10.1029/2001WR000523, 2002.
Redman, J. D., Kueper, B. H., and Annan, A. P.: Dielectric stratigra-phy of a DNAPL spill and implications for detection with ground penetrating radar: Aquifer restoration, ground water monitoring and geophysical methods, in: 5th national outdoor action confer-ence, 13–16 May 1991, Las Vegas, Nevada, 1017–1030, 1991. Redman, J. D. and DeRyck, S. M.: Monitoring Non-Aqueous
Phase Liquids in the Subsurface with Multilevel Time Domain Reflectometry Probes, in: Proceedings of the Symposium on Time Domain Reflectometry in Environmental, Infrastructure, and Mining Applications, 7–9 September 1994, Special Pub-lication SP 19-94, NTIS PB95-105789, US Bureau of Mines, Evanston, Illinois, 207–215, 1994.
Rinaldi, V. A. and Francisca, F. M.: Removal of immiscible contam-inants from sandy soils monitored by means of dielectric mea-surements, J. Environ. Eng., 132, 931–939, 2006.
Robinson, D. A. and Friedman, S. P.: The effective permittivity of dense packing of glass beads, quartz sand and their mixtures immersed in different dielectric backgrounds, J. Non-Crystal. Solids, 305, 261–267, 2003.
Robinson, D. A., Jones, S. B., Wraith, J. M., and Or, D.: A review of advances in dielectric and electric conductivity measurements using time domain reflectometry, Vadose Zone J., 2, 444–475, 2003.
Roth, K., Schulin, R., Fluhler, H., and Attinger, W.: Calibration of time domain reflectometry for water content measurements using a composite dielectric approach, Water Resour. Res., 26, 2267– 2273, 1990.
Topp, C. G., Davis, J. L., and Annan, A. P.: Electromagnetic deter-mination of soil water content: Measurements in coaxial trans-mission lines, Water Resour. Res., 16, 574–582, 1980.
Truong Hong, T. and Bettahar, M.: Effect of the water-oil ratio on brine/surfactant/alcohol/oil systems optimized for soil remedia-tion, J. Mater Cy. Waste Manage., 2, 109–117, 2000.
van Dam, R. L., Borchers, B., and Hendrickx, J. M. H.: Methods for prediction of soil dielectric properties: a review, in: Proceed-ings of SPIE-the International Society for Optical Engineering, 28 March–1 April 2005, Orlando, Florida, 2005.