www.hydrol-earth-syst-sci.net/20/1301/2016/ doi:10.5194/hess-20-1301-2016
© Author(s) 2016. CC Attribution 3.0 License.
Does drought alter hydrological functions in forest soils?
Katharina F. Gimbel1, Heike Puhlmann2, and Markus Weiler1
1Hydrology, Faculty of Environment and Natural Resources, University of Freiburg, Freiburg, Germany 2Forest Research Institute Baden-Württemberg, Freiburg, Germany
Correspondence to: Katharina F. Gimbel ([email protected])
Received: 22 June 2015 – Published in Hydrol. Earth Syst. Sci. Discuss.: 10 August 2015 Revised: 18 January 2016 – Accepted: 29 February 2016 – Published: 1 April 2016
Abstract. Climate change is expected to impact the water cycle and severely affect precipitation patterns across central Europe and in other parts of the world, leading to more fre-quent and severe droughts. Usually when projecting drought impacts on hydrological systems, it is assumed that system properties, like soil properties, remain stable and will not be affected by drought events. To study if this assumption is ap-propriate, we address the effects of drought on the infiltra-tion behavior of forest soils using dye tracer experiments on six sites in three regions across Germany, which were forced into drought conditions. The sites cover clayey-, loamy- and sandy-textured soils. In each region, we compared a decidu-ous and a coniferdecidu-ous forest stand to address differences be-tween the main tree species. The results of the dye tracer ex-periments show clear evidence for changes in infiltration be-havior at the sites. The infiltration changed at the clayey plots from regular and homogeneous flow to fast preferential flow. Similar behavior was observed at the loamy plots, where large areas in the upper layers remained dry, displaying signs of strong water repellency. This was confirmed by water drop penetration time (WDPT) tests, which revealed, in all except one plot, moderate to severe water repellency. Water repel-lency was also accountable for the change of regular infiltra-tion to fingered flow in the sandy soils. The results of this study suggest that the drought history or, more generally, the climatic conditions of a soil in the past are more important than the actual antecedent soil moisture status regarding hy-drophobicity and infiltration behavior; furthermore, drought effects on infiltration need to be considered in hydrological models to obtain realistic predictions concerning water qual-ity and quantqual-ity in runoff and groundwater recharge.
1 Introduction
Soils moderate how water moves through the vadose zone and govern the percolation of water to groundwater and streamflow. Soils not only store water for plant growth, func-tion as a habitat for different biota and as transifunc-tion zone to groundwater, but also are important – especially the top layers – for sorption and degradation of contaminants and (agri-)chemicals (Hendrickx and Flury, 2001). The efficiency of this important ecosystem service for groundwater and sur-face water protection depends on the behavior of pollutants in the soil and the hydrological transport processes (Keesstra et al., 2012). How fast water passes the vadose zone depends on its hydraulic soil properties and distribution such as pore volume distribution, soil aggregation, water repellency and rooting pattern.
preferential flow paths and creates instable wetting fronts (fingered preferential flow; Ritsema et al., 1993; Ritsema and Dekker, 2000; Dekker and Ritsema, 2000).
To assess the impacts of drought, rainfall exclusion ex-periments are valuable and often applied tools (e.g., English et al., 2005; Phillips et al., 2009; Da Costa et al., 2010; Kopittke et al., 2014), in addition to elevated CO2 concen-trations (e.g., Dermody et al., 2007), and nighttime warm-ing (e.g., Albert et al., 2011; Selsted et al., 2012). While many studies focus on single aspects of drought effects like plant growth and seedling activity (Meijer et al., 2011; Wu and Chen, 2013) or on particular ecosystems like grassland (Suttle and Thomsen, 2007; Bütof et al., 2012) and heather ecosystems (Albert et al., 2011; Selsted et al., 2012), only few studies focus on forest ecosystems or take a closer look at drought impacts on soils where often only soil moisture is observed to change and no variations in other soil properties are monitored (Ozolinˇcius et al., 2009; Albert et al., 2011; Glaser et al., 2013).
To study drought effects, often extreme short-term events equivalent to droughts with occurrence probabilities of up to 100 or even 1000 years have been introduced to the ex-amined soils (e.g., Glaser et al., 2013). By introducing these extreme events, the question of transferability of the results to natural systems in respect to the expected behavior under pre-dicted future drought conditions arises. Therefore, this study employs a moderate rainfall reduction equivalent to an an-nual drought with a 40-year return period, in accordance to climate predictions, thereby avoiding tentativeness due to an overreaction to an unnatural extreme drought (Gimbel et al., 2015).
[image:2.612.345.510.67.242.2]To monitor changes in soil hydraulic properties, the changes in infiltration patterns in the soil after 2 years of pro-longed drought were observed in three regions across Ger-many. Infiltration patterns were chosen because they reflect the integrated changes of soil hydrological functions and di-rectly show how water moves in the soil under altered con-ditions. In this paper, we present results of several dye tracer infiltration experiments before and after 2 years of prolonged artificial drought. The objectives of this study are (i) to in-vestigate whether droughts predicted by climate projections affect the infiltration behavior of forest soils, and (ii) whether changes in infiltration patterns can be attributed to changes in the hydrologic properties of the soils. Three hypotheses will be tested: induced drought alters infiltration patterns due to changes in soil hydraulic properties, e.g., soil water re-pellency and the formation of shrinkage cracks, leading to
Figure 1. Location of the study sites (red squares) within Germany
(light blue); southwest: Schwäbische Alb; center: Hainich–Dün; northeast: Schorfheide–Chorin.
preferential flow paths and faster infiltration; (2) the main tree species have an effect on the magnitude of the observed response and (3) the drought will increase water repellency depending on tree species and soil properties.
2 Material and methods 2.1 Study sites
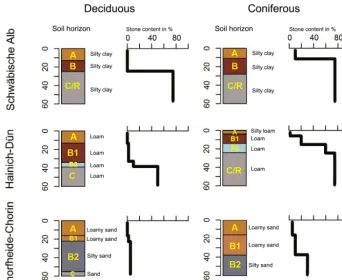
To identify the influence of drought on infiltration patterns of forest soils, six plots in three different regions across Ger-many were selected. The plots were located in Schwäbische Alb (southwest Germany), Hainich–Dün (central Germany) and Schorfheide–Chorin (northeast Germany) (Fig. 1). All plots are part of the Biodiversity Exploratories framework that incorporates, in total, 150 sites on grassland and 150 sites in forest (for more information on the Biodiversity Ex-ploratories, refer to Fischer et al., 2010). In each of the frame-works, two forest plots were selected, which are – within each framework – similar with respect to topography and soil texture type (Fig. 2) but differ in tree species composition. In each site, one plot with a coniferous and one with a decidu-ous main tree species was selected. At the Schwäbische Alb and Hainich–Dün sites, beech (Fagus sylvatica) and spruce (Picea abies) were chosen, in Schorfheide–Chorin beech and pine (Pinus sylvestris).
Figure 2. Soil horizons, texture and rock fractions of the six experimental plots. Soil type classification according to the World Reference
Base for soil (FAO, 2006).
precipitation is 533 mm. The Schorfheide–Chorin plots are located in a young glacial landscape where the dominant ge-ological substrate is glacial till covered by glacio-fluvial and aeolian sands. The soils at this site are deep, sandy Cam-bisols. At the Schorfheide–Chorin site, mean annual temper-ature is 8.5◦C and the mean annual precipitation amounts to 589 mm. All climate data are taken from nearby stations of the German weather service (DWD; years 1950–2010).
The experiments of this study are part of the interdis-ciplinary project “Global Change Effects on Forest Under-storey: interactions between Drought and Land-use Inten-sity” (Gimbel et al. 2015). The artificially imposed drought was created by a 10 m×10 m roofed subplot, covered with transparent panels. In addition, a control plot with the same technical equipment, but without the roofing was installed. The distance between the roofed and the control plots range between 15 and 30 m. The control and roofed plots include a central adult overstorey tree, all of which are similar in age, size and canopy structure. To provide sufficient exchange with ambient air (avoiding a greenhouse effect), all four sides of the roof are open. To collect water from the roof, rain gut-ters are mounted alongside the timber construction. The roof is designed to reduce precipitation between 11 and 100–11 % already intercepted by the roofing construction and rain gut-ters itself. The incoming precipitation was reduced between March and November to the level equivalent to an annual
drought with a return period of 40 years. The resulting an-nual target precipitation inputs under the roofs were 700 mm (26 % reduction) for Schwäbische Alb, 355 mm (33 % reduc-tion) at the Hainich–Dün and 395 mm (27 % reducreduc-tion) at the Schorfheide–Chorin site. For a more detailed description of the whole experimental drought setting and of the study plots see Gimbel et al. (2015).
2.2 Soil moisture measurements
Figure 3. Scheme for profile excavation (a) and WDPT experiment (b). The 20, 40 and 60 mm in (a) denote the applied sprinkling volumes.
For the WDPT experiment (b), five sampling locations (boxes) were used traversing the profile. On every sampling location, the tests were repeated 3 times.
2.3 Soil water repellency
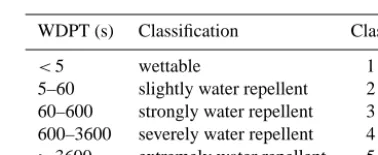
Hydrophobicity in soil was measured with the water drop penetration time (WDPT) test (e.g., Bisdom et al., 1993). This test determines how long water repellency persists on a porous surface. The tests were performed immediately be-fore the dye tracer experiments in 2013, in the drought and control profiles of the deciduous plots and in the drought pro-files of the coniferous plots. For the WDPT tests, a water droplet is placed on a planar soil surface with a pipette and the time is measured until the water drop is completely taken up by the soil. The observation was stopped after exceeding a time of 3600 s. Depending on the profile depths, WDPT tests were performed in several depths of the profile, covering the main soil horizontation. In each depth, five sampling loca-tions were used to traverse the profile, and the tests were re-peated 3 times per location, resulting in 15 WDPTs per depth (Fig. 3b). The mean and maximum values of the WDPT test were classified after Bisdom et al. (1993) (Table 1).
2.4 Dye tracer experiments
The dye tracer experiments were conducted in August 2011 before installation of the roofs and in August 2013 af-ter 2 years of drought. For each experiment, an area of 80 cm×120 cm was prepared by cutting smaller vegetation (grasses, herbaceous plants, and small tree offshoots), cover-ing the surroundcover-ings with a thin plastic sheet, and dividcover-ing the area into three sub-areas with a size of 80 cm×40 cm each (Fig. 3a). The experimental area was kept shaded and sheltered from rain in all weather conditions to minimize evaporation and uncontrolled water input during the exper-iments. Brilliant Blue FCF was diluted in water of local ori-gin to a concentration of 4 g L−1 and was sprayed with a backpack nozzle sprayer for even distribution (Bachmair et al., 2009). For an overall application amount of 20, 40 and 60 mm, each sub-area was sprinkled with an intensity of 20 mm h−1. The applied rainfall intensity of 20 mm h−1 re-flects a heavy rainfall event in all regions; therefore, the sprinkling amounts simulate 1, 2 and 3 h of heavy rainfall. After sprinkling, the experimental area was covered with
Table 1. Classification of water repellency by WDPT, after Bisdom
et al. (1993).
WDPT (s) Classification Class
<5 wettable 1
5–60 slightly water repellent 2 60–600 strongly water repellent 3 600–3600 severely water repellent 4 >3600 extremely water repellent 5
plastic sheets to prevent evaporation and further water input through eventual rain.
The next day (after waiting at least 12 h), three vertical soil profiles per sub-area were prepared. Keeping a 10 cm buffer stripe at the beginning and between the individual sub-areas, every sub-area was divided in three sections, spaced 10 cm from each other (Fig. 3a). To obtain the dye pattern, the sur-face of the excavated soil profiles was smoothed with a spat-ula and loose particles were removed with a brush, avoid-ing smearavoid-ing. Stones were left in place and shaped into relief when needed. Roots were trimmed. Pictures were taken from each profile with a standard digital compact camera with a resolution of 10 megapixels (3648×2736 pixel). The sin-gle profiles were photographed with a ruler frame and a grey scale under even illumination and different illumination set-tings (Weiler and Flühler, 2004). The picture with the best image quality from each profile was used for further process-ing.
2.5 Image processing and data analysis
[image:4.612.333.522.263.340.2]also scaled such that, one pixel corresponds to a square of 1 mm×1 mm. In the second step, the spectral composition changes in daylight are balanced to ensure inter-picture com-parability. This is done by a color adjustment of the image using the photographed grey scale. In the third step, the im-ages are classified into stained and unstained areas. Applying a semi-supervised classification technique, a binary image of stained versus unstained areas is obtained. In contrast to the work of Weiler and Flühler (2004), we did not use the in-formation of different dye tracer concentrations, due to the high heterogeneity of the background color. In this step, ob-jects like stones and vegetation are manually digitized, too. All calculations were done with the programming language IDL (Interactive Data Language; Exelis Inc.).
2.6 Dye pattern analysis
To obtain objective measures to compare the dye patterns of the different profiles and sites, we derived three depth-related variables of the binary images: (1) volume density, (2) surface density and (3) stained path width as basis for fur-ther delineation of flow processes. The volume density (VD) is similar to the frequently used dye coverage. It is defined as the stained volume divided by the reference space and originated from the methods of stereology, which relates a three-dimensional parameter to two-dimensional measure-ments (Weibel, 1979). Surface density (SD) is defined as surface area of an object divided by the volume of the ref-erence space. Surface density provides information on the size and number of features: a high SD is caused by a large number of small objects, whereas a low SD indicates less but larger objects (Weiler, 2001). The stained path width (SPW) is derived by measuring the width of every stained object at a certain depth. The SPWs of every depth were classified into three classes of <20, 20–200, and >200 mm (Weiler and Flühler, 2004). The sum of the three SPW classes per depth corresponds to the VD of the regarding depth. Us-ing the frequency distribution of the SPW of every depth, the dye pattern can be related to distinct flow processes. For example, macropore flow with low interaction can be iden-tified by long and narrow stains, whereas macropore flow with mixed interaction shows a broader distribution of shapes (Weiler and Flühler, 2004). The classification introduced by Weiler and Flühler (2004) was used to distinguish five flow processes, depending on the proportion of stains in each SPW class: two types of matrix flow – (1) homogeneous and (2) heterogeneous – and three types of macropore flow – (3) low, (4) mixed and (5) high interaction with matrix – where interaction is understood as the lateral water flow from macropores into the surrounding soil matrix (Weiler and Naef, 2003). To assess the differences in the VD values between the treatments (pre-drought, control, drought), the Kruskal–Wallis test and the Nemenyi post hoc test were ap-plied, using R (version 3.2.3, The R Foundation for Statisti-cal Computing, 2015) and the package PMCMR (version 4.1
by Thorsten Pohlert) within. Differences between treatments were assumed to be significant, whenpvalues are≤0.01.
3 Results 3.1 Soil moisture
Figure 4 shows the normalized cumulated sums of the soil moisture measurements of the control and the drought plots over the course of 2 years. All plots developed a soil mois-ture deficit compared to the control plots in the upper 5 cm of the soil, as shown by the black line below the 1 : 1 line. The water deficit is also transduced to 15 and 30 cm depths in both Schwäbische Alb plots and in the coniferous plot of Hainich–Dün, but is generally less pronounced. The plots at the Schorfheide–Chorin site show no deficit (deciduous plot) or even a small plus in soil moisture (coniferous plot) com-pared to the control plot. The sandy soils of Schorfheide– Chorin are already very dry without drought treatment. The reverse moisture effect might be caused by effects associated with the installation and placement of the probes (e.g., pref-erential flow along probe cables, concentration of through-fall – although installations were performed with great care), or root effects, e.g., hydraulic redistribution. However, we did not find any signs for hydraulic redistribution in the data. The deciduous plot of the Hainich–Dün site experienced ma-jor probe failures due to animal damage during the summer months of 2012 and again in 2013. Therefore, only the data taken during the winter months could be used for the compar-ison. For this reason, the data do not cover the months with the highest expected soil moisture deficits.
3.2 Soil water repellency
Figure 4. Normalized cumulated sums of soil moisture of the drought versus the control subplots of the investigated soils. The computations
begin with the start of the rainfall reduction and end at the date of the dye tracer experiment 2013.
the Schwäbische Alb (mean 990 s; max 2340 s) in the topsoil (Fig. 5).
3.3 Dye tracer experiments and dye pattern analysis 3.3.1 Comparison between pre-drought pattern and
control pattern
Differences between pre-drought and control plots (without drought treatment) not only reflect differences in soil struc-ture, texture and moisture due to a distance of 20–40 m be-tween the drought and reference plot, but also may include time-dependent changes of the soil characteristics, which are independent from the drought treatment. To ensure validity of the dye pattern analyses, it is necessary to assure compa-rability among the plots. To exclude time-dependent changes as reasons for differences in pre-drought and drought-treated dye patterns, the pre-drought patterns were checked against the patterns of the control plots. Figure 6 compares the pre-drought pattern and the control pattern of the deciduous plots. In addition, Fig. 7 provides box plots of VD for different depths of the pre-drought and the control profiles for direct comparison.
The Schwäbische Alb pre-drought plot (Fig. 6, top left panel) shows high VD in the top 10 cm in all profiles. The 40 and 60 mm sprinkling volume profiles show a high SPW in the top 5 to 10 cm. On the control plot (Fig. 6, top right panel) large areas of the profiles top 10 cm are also stained, but the VD and SPW are not as high as the pre-drought pro-files. This is especially evident in the VD box plots of the
upper 0–10 cm (Fig. 7, top panels). All Schwäbische Alb pro-files have high stone contents, in some cases exceeding 50 % of the profile width (Fig. 6). Below 10 cm depth, the control plot profiles are almost completely stained. This pattern is similar to the pre-drought profiles. In general, the patterns of the control profiles are similar in VD, SPW values and distri-bution to the 20 mm pre-drought profile. The 60 mm control profile reflects the high VD and SPW values in top layers, which are characteristic of the 40 and 60 mm pre-drought profiles.
Figure 5. Mean and maximum water drop penetration times (WDPTs) of the control (green) and drought (red) plots. Orange lines and numbers refer to the WDPT classes after Bisdom et al. (1993) (see Table 1).
In the Schorfheide–Chorin pre-drought profiles (Fig. 6, bottom left panel), high VD and SPW values are present. The highest VD and SPW values can be found in the 60 mm sprin-kling amount profile. Below 10 cm depth, the 20 mm pre-drought profile displays only small to medium SPWs and – in comparison to the 40 and 60 mm profiles – small VD values. The control plot profiles (Fig. 6, bottom right panel) show, in general, high VD and SPW values, but have lower values in the top 10 cm than the pre-drought profiles (Fig. 6, bottom right panel and Fig. 7, bottom panels). This is more appar-ent in the 20 and 40 mm profiles (Fig. 7). In the pre-drought and control plots, infiltration reached down to depths of over 70 cm and no stones are present.
To summarize, the comparison between the pre-drought and control plots showed a broad agreement. Differences, that need to be accounted for, are the lower VD in the profile top layers, especially at the Schwäbische Alb and Schorfheide–Chorin site. These differences might be due to spatial heterogeneities, e.g., slight differences in soil layer boundary depths, given the distance between the control and the pre-drought plots (15 to 30 m). In addition, the initial con-ditions (soil moisture) were also slightly different possibly resulting in the observed differences. Choosing 10 cm steps
for statistical comparison of the VD may in addition intro-duce differences, if soil layer boundary depths differ. There-fore, not only the VD, but also the SPWs and the determined flow processes need to be taken into account for comparison. However, the pre-drought and drought experiment were per-formed in close vicinity (1 m). In the Hainich–Dün, the drop and rise of VD in all profiles points to a soil layer boundary effect on infiltration. This is not time dependent and present in both pre-drought and control profiles; therefore, the com-parability between the pre-drought and drought pattern is not affected.
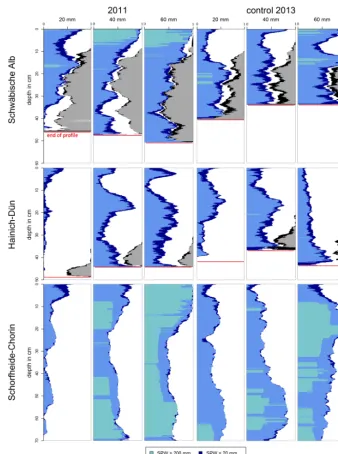
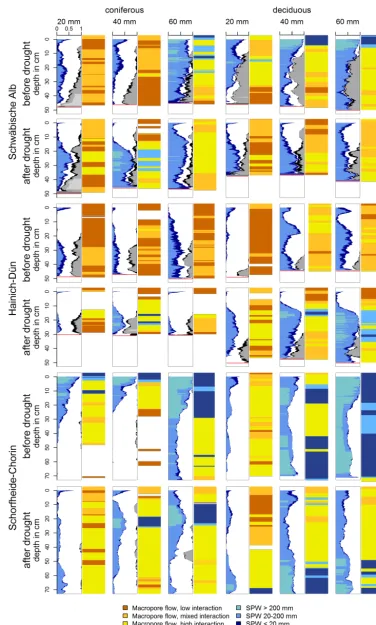
3.3.2 Comparison between pre-drought pattern and drought pattern
As can be seen in Fig. 8, all plots show marked differ-ences between pre- and after-drought infiltration patterns. The clayey and loamy sites (Schwäbische Alb and Hainich– Dün) develop unstained (i.e., unwetted) areas in the top-soil layers. This is more pronounced in the coniferous plots, where unstained areas are already visible in the pre-drought infiltration pattern. Figure 9 compares VDs in box plots for different depths of the drought and pre-drought profiles in-cluding the statistical significance.
Schwäbische Alb coniferous plot
At the Schwäbische Alb site, medium to low volume den-sities (VDs) were found on the pre-drought coniferous plot throughout the whole profile for the 20 and 40 mm sprinkling depth and high VD for 60 mm sprinkling depth (Fig. 8, top left panel). The drought 40 and 60 mm profiles are lower in VD in the top layers (0–10 cm), than the pre-drought pro-files (Figs. 8 and 9, top left panels); the 40 mm profile dis-plays even unstained areas (no VD). The 20 mm pre-drought profile is already very low in VD; therefore, the differences to the after drought profile are not distinct (Fig. 8, top left panel). The drought coniferous plot shows a rise of VD cul-minating around 20 cm depth (Fig. 8, top panels) for all sprin-kling amounts (20, 40 and 60 mm). Below 20 cm depth, the 20 and 40 mm profiles show (Fig. 9, top left panel) higher VD in the after drought profiles than in the pre-drought pro-files, whereas the 60 mm profile show the same extent of VD in the drought and in the pre-drought profile.
Figure 6. Comparison between stained path width (SPW) of pre-drought (2011) and control (2013) plot. Blue shades indicate the SPW
classes. The sum of SPW is the volume density (VD) per depth. Grey and black indicate the VD of stones.
drought plot are macropore flow with low, medium and high interaction.
Schwäbische Alb deciduous plot
The Schwäbische Alb deciduous plot shows in the 40 and 60 mm pre-drought profiles high SPWs and in all infiltrat-ing volumes high VDs in the top layer (0–10 cm; Figs. 8 and 9, top right panels). Medium to high VDs are maintained throughout the whole 40 and 60 mm profiles, and to lesser ex-tend in the 20 mm profile. The drought profiles show lower VD in the top 10 cm, compared to the pre-drought profiles
(Fig. 9, top right panel). Below 20–25 cm depths, the 20 and 40 cm drought profiles show higher VD than the pre-drought profiles. However, the drought profiles are more similar in shape to the VD pattern of the control than to the pre-drought profiles (Fig. 6, top panels). Also, the stone contents in the three pre-drought profiles are higher than in the drought pro-files (Fig. 8, top right panel).
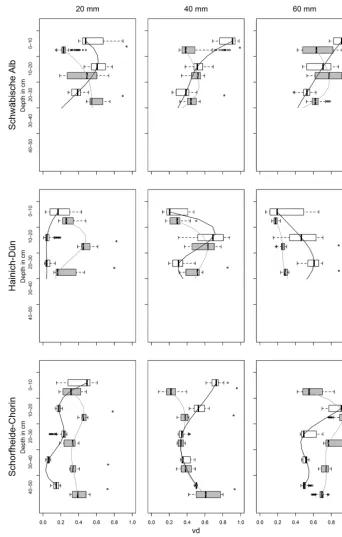
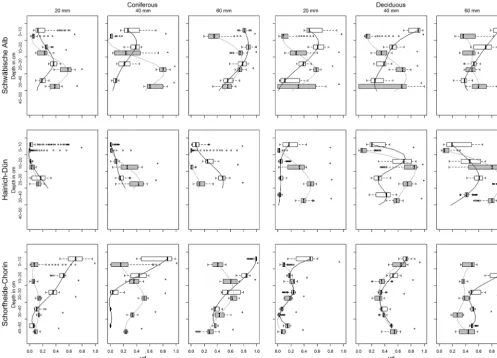
Figure 7. VD box plots of the drought and the pre-drought pattern. Depth ranges are omitted, where one of the profile is shorter than the
other. Statistically significant (pvalue≤0.01) differences between the treatments are marked with an asterisk.
40 and 60 mm pre-drought profiles as matrix flow are caused by local saturation due to lowKs. The dominating flow types of the drought deciduous profiles are identified as macropore flow with low, mixed and high interaction (Fig. 8, top right panel).
Hainich–Dün coniferous plot
Figure 8. Comparison between before drought (2011) and after drought (2013) stained path widths (SPWs) and flow processes for coniferous
Figure 9. VD box plots of the drought and the pre-drought pattern. Depth ranges are omitted, where one of the profile is shorter than the
other. Statistically significant (pvalue≤0.01) differences between the treatments are marked with an asterisk.
40 mm pre-drought profiles show unstained areas (no VD). The small VD values are even more pronounced in the drought profiles (Figs. 8 and 9, center left panels), in which all profiles exhibit unstained areas. Below the unstained layer, the VD rises to a maximum in 15 to 20 cm depth and drops again around 30 cm depth. The 20 and 60 mm drought profiles show throughout all depths low VD (Fig. 8, center left panel).
In all Hainich–Dün coniferous pre-drought profiles, no large SPWs occur and flow types are classified as macropore flow with low, mixed and high interaction. This applies also for the 20 and 60 mm drought profiles. In contrast, the 40 mm drought profile exhibits high SPWs between 15 and 25 cm depth. Therefore, the flow types in these depths are identified as matrix flow (Fig. 8, center left panel). The main flow types in the coniferous drought profiles are macropore flow with low, mixed and high interaction. The pre-drought profiles are dominated by macropore flow with low and mixed interac-tion. In both, pre-drought and drought profiles, the stone con-tent is comparable (Fig. 8, center left panel).
Hainich–Dün deciduous plot
decreasing with depth (Fig. 8, bottom left panel). While the 20 and 40 mm pre-drought profiles show a maximum infiltration depth of about 45 and 30 cm, respectively, the 60 mm pre-drought profile is stained below 70 cm, exhibiting medium VD values (Fig. 8, bottom left panel). High SPW values are found in the 20 mm pre-drought profile up to a depth of 15 cm and in the 40 and 60 mm profiles up to 10 and 30 cm, respectively. The drought profiles of the coniferous plots show far lower VD values in the top layers compared to the pre-drought profiles (Figs. 8 and 9, bottom left pan-els). The 40 mm drought profile exhibits even an unstained layer at about 5 cm depth. High SPW values can be found in the 40 and 60 mm drought profile, not in the top layers, but between 20 and 25 cm depth (40 mm profile), and be-tween 10 and 25 cm depth (60 mm profile) (Fig. 8, bottom left panel). This is reflected in the flow-type classification. Whereas matrix flow dominates the top layers in pre-drought profiles (at least the top 10 cm), matrix flow occurs below 10 cm depth in the 40 and 60 mm drought profiles (Fig. 8, bottom left panel).
Schorfheide–Chorin deciduous plot
The Schorfheide–Chorin deciduous pre-drought and drought patterns do not exhibit much differences in shape and in VD values in the 20 and 40 mm profiles (Fig. 8, bottom right panel). The largest differences in VDs can be found in the top 10 cm of the 20 mm profiles and in the 60 mm profile (Fig. 9, bottom right panel). In addition, the 20 mm drought profile exhibits an unstained layer around 40 cm depth (Fig. 8, bot-tom right panel). The difference between pre-drought and drought is more evident in the SPW values: high SPW values are found in the 40 and 60 mm pre-drought profiles in the top and bottom half of the profile; high SPW values are found in the drought profile in the bottom half, plus a small layer of 2 cm of high SPWs around 10 cm depth in the 40 mm profile (Fig. 8, bottom right panel). In the Schorfheide–Chorin de-ciduous pre-drought profiles, flow types of the 40 and 60 mm are dominated by matrix flow (Fig. 8, bottom right panel). However, all profiles in the pre-drought plots have a propor-tion of macropore flow. In the drought profiles, matrix flow only occurs in the bottom half of the 40 and 60 mm profiles. To summarize, compared with pre-drought infiltration pat-tern, the drought pattern of all plots reveal differences in in-filtration processes. For example, over 90 % of the depths ranges show significant differences in VDs between the drought and pre-drought site. Clayey and loamy soils
be-loamy soils (except Hainich–Dün deciduous plot), the un-stained topsoil layers coincide with the high WDPTs (Fig. 5). Hainich–Dün coniferous plots stay unwetted up to a depth of about 15 to 20 cm and Schwäbische Alb plots to a depth of about 10 cm, which corresponds to the depths where the highest WDPT values were observed (Hainich–Dün: WDPT class 4; Schwäbische Alb: WDPT classes 4 and 3). In the sandy soils of the Schorfheide–Chorin profiles, low SPW val-ues correspond to high WDPTs (class 2 and 3). Below the water repellent zone, SPW values increase again (Fig. 5, bot-tom panel).
4 Discussion
4.1 Infiltration patterns and influence of main tree species
The comparison of pre-drought infiltration patterns of the drought plots with patterns of the control plots (without drought treatment) showed broad agreements. All control plot profiles are comparable to the pre-drought plot profiles, including differences that can be addressed to small-scale heterogeneities of soil properties. When interpreting the pat-terns, the differences in VDs in the top layers of all plots need to be taken into account. When doing this, at all sites, the dye experiments before and during drought conditions can be di-rectly compared.
local saturation occurs, and lateral redistribution into the soil matrix due to the now lower infiltration capacity and velocity can be observed. This also explains the similar pattern in the loamy Hainich–Dün soils.
A trend to more preferential flow was also observed in the Hainich–Dün plots, where the dense and loamy soils are also prone to shrinkage. Furthermore, in the Hainich–Dün drought profiles unstained (i.e., unwetted) areas in the topsoil layers were observed. This is more pronounced in the conif-erous plot, where unstained areas were already visible in the pre-drought experiment. Preferential flow originates not only from cracks and biopores, but also from textual boundaries and instable wetting fronts (Doerr and Ritsema, 2006; Hen-drickx and Flury, 2001). Unstable wetting fronts can occur due to air entrapment or hydrophobicity, which effectively hinders infiltration and redirects the water to structural and textural preferential flow paths (Doerr and Ritsema, 2006). The unwetted topsoil layers of the Hainich–Dün coniferous plots can be explained by the combination of severe water repellency and shrinkage cracks acting as effective bypasses. In contrast to the other sites, Schorfheide–Chorin soils are sandy and highly permeable with low stone content. In both Schorfheide–Chorin plots, the infiltration patterns changed from a regular front-like stable infiltration to unstable, more scattered and fingered infiltration patterns. Following the conceptualization of unstable flow in water repellent soils by Ritsema et al. (1993, 2000), water flows, after entering the soil, through preferential pathways through the water repel-lent layer and distributes laterally in the divergence layer un-derneath. In fact, such flow patterns were pronounced in the Schorfheide–Chorin deciduous drought plot: medium VDs and SPWs up to a depth of 50–60 cm and larger SPWs in the layer beneath. This fits with the results of the WDPT tests, which show a slight to strong water repellency in the top 50– 60 cm of the profile.
In general, drought induced major changes on the infiltra-tion behavior of the examined soils. Clayey and loamy soils developed preferential flow. In these soils, the bypassing of the top 10–20 cm is fostered by water repellency, leading to unwetted topsoil layers. Sandy soils developed fingered in-filtration patterns, due to the formation of a water repellent layer. In all three sites, the effects of the drought treatment were more pronounced in soils with coniferous main tree species than with deciduous main tree species.
4.2 Water repellency
In this study, it was hypothesized that the artificially induced drought will increase soil water repellency depending on the main tree species and soil properties. The highest water re-pellency was found in the coniferous plots of Schwäbische Alb and Hainich–Dün. Soils under coniferous trees often fea-ture acidic soil conditions, which promote water repellency (Orfánus et al., 2014). In a study by Orfánus et al. (2014) liming practices and associated rise of pH values
signifi-cantly reduced water repellency of former pine forest soils. Jost et al. (2004) explained the difference in recharge under a beech and a spruce forest stand, with higher hydrophobic-ity, and therefore the hindering of infiltration, combined with higher surface runoff of the spruce stand. This is in contrast to the findings of Buczko et al. (2006), who found the high-est proportion of water repellent soils in pure beech stands compared to pure pine and mixed stands on sandy soils. However, in our study the sandy Schorfheide–Chorin plots showed higher mean WDPTs in the deciduous (beech) plot, than on the coniferous (pine) plot.
The soil texture can also influence the water repellency: a study of Gonzalez-Penaloza et al. (2013) suggests that wa-ter repellency is related to soil particle size. They induced water repellency by using different concentrations of stearic acid on samples of fine, medium and coarse sand. Water re-pellency was extreme in coarse-textured samples. The au-thors explained that by the lower specific surface compared to fine-textured samples and therefore smaller area that has to be covered by water repellent agents. We could not observe this effect in our sandy soils. The coarser-textured coniferous plot was less water repellent than the finer-textured decidu-ous Schorfheide–Chorin plot. However, water repellency can originate from a broad range of factors. The degree of wa-ter repellency of a soil also depends on the amount and type of organic matter that is incorporated in it (DeBano, 1981; Bisdom et al., 1993; Buczko et al., 2006; Vogelmann et al., 2013a, b), as well as the age and type of forest and litter type (Neris et al., 2013).
Several studies detected a significant impact of spruce litter on infiltration processes, either by hydrophobicity (Schume et al., 2004) or interception (Neris et al., 2013). Schume et al. (2004) found that spruce litter can intercept up to 5 mm of precipitation and Neris et al. (2013) found in-filtration rates of 20 mm h−1 compared to that of 50 mm/h of deciduous stands, doubling the runoff of the sites. In this study, we did not record the interception of the litter layer, which may have altered the total amount of water infiltrat-ing into the soil. However, a natural litter layer is always present and intercepts precipitation (e.g., Gerrits et al., 2010). By keeping the natural litter layer in our experimental setup, our test results include the two influencing factors of the sys-tems natural response in the infiltration pattern: the redistri-bution of incoming precipitation by the litter layer, leading to more spatial heterogeneous water input in the soil, compared to a soil with removed or hydrophilic litter layer. The mea-sured infiltration pattern is a result of both factors, producing a more natural representation than a separate observation of litter layer and soil response.
ical moisture or transition zone. Vogelmann et al. (2013a) found a critical water threshold of 0.36 to 0.57 cm3cm−3 be-yond which hydrophobic soils become hydrophilic, varying as a function of soil organic matter content. In contrast to the findings of Doerr and Thomas (2003), we found very similar water contents in drought-treated and control soils, but very different hydrophobicity conditions. This indicates that the drought history or, more generally, the climatic condition of a soil in the past is more important than the actual antecedent soil moisture status regarding hydrophobicity and infiltration behavior.
In our rainfall exclusion experiment drought stress was not intense enough to induce mortality or strong changes in aboveground biomass of a particular species (Gimbel et al., 2015). Nevertheless, drought and water repellency may pro-mote the die-off of fine roots, which thereupon contribute to the total organic matter in the soil. The amount of soil or-ganic matter and its composition has a strong influence on the strength of water repellency (e.g., Vogelmann et al., 2013a; Bisdom et al., 1993; DeBano, 1981). Therefore, the die-off of fine roots may lead to a self-reinforcing circle of water repellency.
Soil organic matter can form micro- and macro-aggregates by acting as binding agent between soil components (e.g., Tisdall and Oades, 1982; Annabi et al., 2011) or by covering soil particles (e.g., Vogelmann et al., 2013a). Vo-gelmann et al. (2013b) concluded in their study, that water repellency leads to slower wetting of soil aggregates. There-fore, cohesive forces hold up longer, which increases the resistance to disaggregation and, thus, indirectly aiding to maintaining soil structure. Terrestrial fungi are also in the fo-cus of research concerning soil water repellency and aggre-gation (e.g., Tisdall and Oades, 1982; Rillig and Mummey, 2006; Chau et al., 2012). Zheng et al. (2014) found in three of nine species of ectomycorrhizal fungi associated with Pi-nus sylvestris seedlings increased soil water repellency and in six of nine species an increase of water-stable aggregation. In our study, only the coniferous plot in Schorfheide–Chorin has Pinus sylvestris as the main tree species. In fact, the plot showed slight (mean values) to strong (maximum values) wa-ter repellency in the top 20 cm. Nevertheless, the WDPT val-ues of the deciduous plot in this area indicated stronger water repellency (in mean and maximum values).
All of our experimental plots showed clear response to the drought treatment, irrespective of their soil type and vegeta-tion cover. Especially the fast bypassing of the topsoil layer and the development of unstained and hence unwetted
ar-wetting and additional water infiltrates through already ex-isting preferential pathways, further stabilizing established flow paths (Dekker and Ritsema, 2000; Hagedorn and Bundt, 2002). Under present climate conditions, soil water repel-lency is already a widespread phenomenon (Buczko et al., 2006). For the predicted climate conditions, where droughts will be more common, an even higher level of hydrophobic-ity is to be expected, according to the findings of our rainfall reduction experiments.
5 Conclusions
Two years of rainfall reduction equivalent to an annual drought with a 40-year return interval was sufficient to change the soil properties and hence the infiltration pathways of six forest soils independent of soil type and tree species. All drought-treated soils, except one, developed slight to se-vere water repellency. Main tree species had a particular ef-fect on hydrophobicity, but this only accounts for minor dif-ferences in infiltration pattern. The drought history or, more generally, the climatic condition in the past had more of an effect on the observed hydrophobicity and infiltration behav-ior than the actual antecedent soil moisture conditions of the soils. The results of this study suggest that drought effects on infiltration processes need to be considered in hydrological models to obtain realistic predictions regarding water quality and quantity in runoff and groundwater recharge.
Albert Ludwigs University Freiburg in the funding programme Open-Access Publishing.
Edited by: M. Hrachowitz
References
Albert, K. R., Ro-Poulsen, H., Mikkelsen, T. N., Michelsen, A., van der Linden, L., and Beier, C.: Effects of elevated CO2, warming and drought episodes on plant carbon uptake in a temperate heath ecosystem are controlled by soil water status, Plant Cell Environ., 34, 1207–1222, doi:10.1111/j.1365-3040.2011.02320.x, 2011. Annabi, M., Le Bissonnais, Y., Le Villio-Poitrenaud, M., and
Houot, S.: Improvement of soil aggregate stability by re-peated applications of organic amendments to a cultivated silty loam soil, Agr. Ecosyst. Environ., 144, 382–389, doi:10.1016/j.agee.2011.07.005, 2011.
Bachmair, S., Weiler, M., and Nützmann, G.: Controls of land use and soil structure on water movement: Lessons for pollutant transfer through the unsaturated zone, J. Hydrol., 369, 241–252, doi:10.1016/j.jhydrol.2009.02.031, 2009.
Barthlott, W. and Neinhuis, C.: Purity of the sacred lotus, or es-cape from contamination in biological surfaces, Planta, 202, 1–8, doi:10.1007/s004250050096, 1997.
Bisdom, E., Dekker, L. W., and Schoute, J.: Water repellency of sieve fractions from sandy soils and relationships with or-ganic material and soil structure, Geoderma, 56, 105–118, doi:10.1016/0016-7061(93)90103-R, 1993.
Buczko, U., Bens, O., and Hüttl, R. F.: Water infiltra-tion and hydrophobicity in forest soils of a pine–beech transformation chronosequence, J. Hydrol., 331, 383–395, doi:10.1016/j.jhydrol.2006.05.023, 2006.
Bütof, A., von Riedmatten, Lars R., Dormann, C. F., Scherer-Lorenzen, M., Welk, E., and Bruelheide, H.: The responses of grassland plants to experimentally simulated climate change de-pend on land use and region, Global Change Biol., 18, 127–137, doi:10.1111/j.1365-2486.2011.02539.x, 2012.
Chau, H. W., Goh, Y. K., Vujanovic, V., and Si, B. C.: Wetting prop-erties of fungi mycelium alter soil infiltration and soil water re-pellency in aγ-sterilized wettable and repellent soil, Fungal Bi-ology, 116, 1212–1218, doi:10.1016/j.funbio.2012.10.004, 2012. da Costa, A. C. L., Galbraith, D., Almeida, S., Portela, B., Tanaka, T., da Costa, M., de Athaydes Silva Jr., J., Braga, A. P., de Gonçalves, P. H. L., de Oliveira, A. A. R., Fisher, R., Phillips, O. L., Metcalfe, D. B., Levy, P., and Meir, P.: Effect of 7 yr of ex-perimental drought on vegetation dynamics and biomass storage of an eastern Amazonian rainforest, New Phytol., 187, 579–591, doi:10.1111/j.1469-8137.2010.03309.x, 2010.
DeBano, L. F.: Water repellent soils: a state-of-the-art, USDA For. Serv. Gen. Tech. Rep. PSW-46, USDA, Pacific Southwest For-est and Range Experiment Station, Berkeley, California, 21 pp., 1981.
DeBano, L. F.: Water repellency in soils: a historical overview, J. Hydrol., 231–232, 4–32, doi:10.1016/S0022-1694(00)00180-3, 2000.
Dekker, L. W. and Ritsema, C. J.: Wetting patterns and moisture variability in water repellent Dutch soils, J. Hydrol., 231–232, 148–164, doi:10.1016/S0022-1694(00)00191-8, 2000.
Dermody, O., Weltzin, J. F., Engel, E. C., Allen, P., and Norby, R. J.: How do elevated [CO2], warming, and reduced precipitation interact to affect soil moisture and LAI in an old field ecosys-tem?, Plant Soil, 301, 255–266, doi:10.1007/s11104-007-9443-x, 2007.
Doerr, S. H. and Ritsema, C. J.: Water Movement in Hydropho-bic Soils, in: Encyclopedia of Hydrological Sciences, John Wi-ley & Sons, Ltd, doi:10.1002/0470848944, 2006.
Doerr, S. H. and Thomas, A. D.: Soil moisture: a controlling fac-tor in water repellency?, in: Soil Water Repellency: Occurrence, Consequences and Amelioration, edited by: Ritsema, C. J. and Dekker, L. W., Elsevier Science, Amsterdam, 137–149, 2003. Doerr, S. H., Ritsema, C. J., Dekker, L. W., Scott, D. F., and Carter,
D.: Water repellence of soils: new insights and emerging research needs, Hydrol. Process., 21, 2223–2228, doi:10.1002/hyp.6762, 2007.
English, N. B., Weltzin, J. F., Fravolini, A., Thomas, L., and Williams, D. G.: The influence of soil texture and vegetation on soil moisture under rainout shelters in a semi-desert grassland, J. Arid Environ., 63, 324–343, doi:10.1016/j.jaridenv.2005.03.013, 2005.
FAO: Guidelines for Soil Description, 4th Edn., Food and Agricul-ture Organization of the United Nations, Rome, 2006.
Fischer, M., Bossdorf, O., Gockel, S., Hänsel, F., Hemp, A., Hes-senmöller, D., Korte, G., Nieschulze, J., Pfeiffer, S., Prati, D. R. S., Schöning, I., Schumacher, U., Wells, K., Buscot, F., Kalko, E. K. V., Linsenmair, K. E., Schulze, E.-D., and Weisser, W. W.: Implementing large-scale and long-term functional biodiversity research: The Biodiversity Exploratories, Basic Appl. Ecol., 11, 473–485, doi:10.1016/j.baae.2010.07.009, 2010.
Gerrits, A. M. J., Pfister, L., and Savenije, H. H. G.: Spatial and tem-poral variability of canopy and forest floor interception in a beech forest, Hydrol. Process., 24, 3011–3025, doi:10.1002/hyp.7712, 2010.
Gimbel, K. F., Felsmann, K., Baudis, M., Puhlmann, H., Gessler, A., Bruelheide, H., Kayler, Z., Ellerbrock, R. H., Ulrich, A., Welk, E., and Weiler, M.: Drought in forest understory ecosystems – a novel rainfall reduction experiment, Biogeosciences, 12, 961– 975, doi:10.5194/bg-12-961-2015, 2015.
Glaser, B., Jentsch, A., Kreyling, J., and Beierkuhnlein, C.: Soil-moisture change caused by experimental extreme summer drought is similar to natural inter-annual variation in a loamy sand in Central Europe, Z. Pflanzenernähr. Bodenk., 176, 27–34, doi:10.1002/jpln.201200188, 2013.
González-Peñaloza, F. A., Zavala, L. M., Jordán, A., Bellinfante, N., Bárcenas-Moreno, G., Mataix-Solera, J., Granged, A. J., Granja-Martins, F. M., and Neto-Paixão, H. M.: Water repellency as con-ditioned by particle size and drying in hydrophobized sand, Geo-derma, 209–210, 31–40, doi:10.1016/j.geoderma.2013.05.022, 2013.
Hagedorn, F. and Bundt, M.: The age of preferential flow paths, Geoderma, 108, 119–132, doi:10.1016/S0016-7061(02)00129-5, 2002.
Hardie, M. A., Cotching, W. E., Doyle, R. B., Holz, G., Lisson, S., and Mattern, K.: Effect of antecedent soil moisture on prefer-ential flow in a texture-contrast soil, J. Hydrol., 398, 191–201, doi:10.1016/j.jhydrol.2010.12.008, 2011.
IPCC: Managing the Risks of Extreme Events and Disasters to Ad-vance Climate Change Adaptation, in: A Special Report of Work-ing Groups I and II of the Intergovernmental Panel on Climate Change, edited by: Field, C. B., Barros, V., Stocker, T. F., Qin, D., Dokken, D. J., Ebi, K. L., Mastrandrea, M. D., Mach, K. J., Plattner, G.-K., Allen, S. K., Tignor, M., and Midgley, P. M., Cambridge University Press, Cambridge, UK, and New York, NY, USA, 582 pp., 2012.
Jost, G., Schume, H., and Hager, H.: Factors controlling soil water-recharge in a mixed European beech (Fagus sylvatica L.) Norway spruce [Picea abies (L.) Karst.] stand, Eur. J. Forest Res., 123, 93–104, doi:10.1007/s10342-004-0033-7, 2004.
Keesstra, S. D., Geissen, V., Mosse, K., Piiranen, S., Scud-iero, E., Leistra, M., and van Schaik, L.: Soil as a filter for groundwater quality, Curr. Opin. Environ. Sustain., 4, 507–516, doi:10.1016/j.cosust.2012.10.007, 2012.
Kopittke, G. R., Tietema, A., Loon, E. E., and Asscheman, D.: Four-teen Annually Repeated Droughts Suppressed Autotrophic Soil Respiration and Resulted in an Ecosystem Change, Ecosystems, 17, 242–257, doi:10.1007/s10021-013-9720-x, 2014.
Meijer, S. S., Holmgren, M., and Van der Putten, W. H.: Effects of plant-soil feedback on tree seedling growth under arid condi-tions, J. Plant Ecol., 4, 193–200, doi:10.1093/jpe/rtr011, 2011. Neinhuis, C. and Barthlott, W.: Characterization and Distribution
of Water-repellent, Self-cleaning Plant Surfaces, Ann. Bot., 79, 667–677, doi:10.1006/anbo.1997.0400, 1997.
Neris, J., Tejedor, M., Rodríguez, M., Fuentes, J., and Jiménez, C.: Effect of forest floor characteristics on water repellency, infiltra-tion, runoff and soil loss in Andisols of Tenerife (Canary Islands, Spain), Catena, 108, 50–57, doi:10.1016/j.catena.2012.04.011, 2013.
Orfánus, T., Dlapa, P., Fodor, N., Rajkai, K., Sándor, R., and Nováková, K.: How severe and subcritical water repellency de-termines the seasonal infiltration in natural and cultivated sandy soils, Soil Till. Res., 135, 49–59, doi:10.1016/j.still.2013.09.005, 2014.
Ozolinˇcius, R., Stak˙enas, V., Varnagiryt˙e-Kabašinskien˙e, I., and Buožyt˙e, R.: Artificial Drought in Scots Pine Stands: Effects on Soil, Ground Vegetation and Tree Condition, Annales Botanici Fennici, 46, 299–307, doi:10.5735/085.046.0406, 2009. Phillips, O. L., Aragao, L. E. O. C., Lewis, S. L., Fisher, J. B., Lloyd,
J., Lopez-Gonzalez, G., Malhi, Y., Monteagudo, A., Peacock, J., Quesada, C. A., van der Heijden, G., Almeida, S., Amaral, I., Arroyo, L., Aymard, G., Baker, T. R., Banki, O., Blanc, L., Bonal, D., Brando, P., Chave, J., de Oliveira, A. C. A., Cardozo, N. D., Czimczik, C. I., Feldpausch, T. R., Freitas, M. A., Gloor, E., Higuchi, N., Jimenez, E., Lloyd, G., Meir, P., Mendoza, C., Morel, A., Neill, D. A., Nepstad, D., Patino, S., Penuela, M. C., Prieto, A., Ramirez, F., Schwarz, M., Silva, J., Silveira, M., Thomas, A. S., Steege, H. T., Stropp, J., Vasquez, R., Zelazowski,
Gosling, S. N., Hagemann, S., Hannah, D. M., Kim, H., Masaki, Y., Satoh, Y., Stacke, T., Wada, Y., and Wisser, D.: Hydrologi-cal droughts in the 21st century, hotspots and uncertainties from a global multimodel ensemble experiment, P. Natl. Acad. Sci., 111, 3262–3267, doi:10.1073/pnas.1222473110, 2014.
Rillig, M. C. and Mummey, D. L.: Mycorrhizas and soil structure. New Phytol., 171, 41–53, 2006.
Ritsema, C. J. and Dekker, L.: Preferential flow in water repellent sandy soils: principles and modeling implications, J. Hydrol., 231–232, 308–319, doi:10.1016/S0022-1694(00)00203-1, 2000. Ritsema, C. J., Dekker, L. W., Hendrickx, J. M. H., and Hamminga, W.: Preferential flow mechanism in a water repellent sandy soil, Water Resour. Res., 29, 2183–2193, doi:10.1029/93WR00394, 1993.
Ritsema, C. J., Dekker, L. W., van den Elsen, E. G. M., Oostindiel, K., Steenhuis, T. S., and Nieber, J. L.: Recurring fingered flow pathways in a water repellent sandy field soil, Hydrol. Earth Syst. Sci., 1, 777–786, doi:10.5194/hess-1-777-1997, 1997.
Schume, H., Jost, G., and Hager, H.: Soil water depletion and recharge patterns in mixed and pure forest stands of Euro-pean beech and Norway spruce, J. Hydrol., 289, 258–274, doi:10.1016/j.jhydrol.2003.11.036, 2004.
Selsted, M. B., Linden, L., Ibrom, A., Michelsen, A., Larsen, K. S., Pedersen, J. K., Mikkelsen, T. N., Pilegaard, K., Beier, C., and Ambus, P.: Soil respiration is stimulated by elevated CO2 and reduced by summer drought: three years of measurements in a multifactor ecosystem manipulation experiment in a temperate heathland (CLIMAITE), Global Change Biol., 18, 1216–1230, doi:10.1111/j.1365-2486.2011.02634.x, 2012.
Seneviratne, S. I., Luethi, D., Litschi, M., and Schaer, C.: Land– atmosphere coupling and climate change in Europe, Nature, 443, 205–209, doi:10.1038/nature05095, 2006.
Suttle, B. K. and Thomsen, M. A.: Climate change and grassland restoration in California: Lessons from six years of rainfall ma-nipulation in a North Coast grassland, Madroño, 54, 225–233, doi:10.3120/0024-9637(2007)54[225:CCAGRI]2.0.CO;2, 2007. Tisdall, J. M. and Oades, J. M.: Organic matter and water-stable
aggregates in soils, J. Soil Sci., 33, 141–163, 1982.
Vogelmann, E. S., Reichert, J. M., Prevedello, J., Consensa, C., Oliveira, A., Awe, G. O., and Mataix-Solera, J.: Threshold water content beyond which hydrophobic soils become hydrophilic: The role of soil texture and organic matter content, Geoderma, 209–210, 177–187, doi:10.1016/j.geoderma.2013.06.019, 2013a.
Weibel, E. R.: Stereological Methods, in: Vol. 1: Practical Meth-ods for Biological Morphometry, Academic Press, New York, 396 pp., 1979.
Weiler, M.: Mechanics Controlling Macropore flow during Infiltra-tion – dye Tracer Experiments and SimulaInfiltra-tions, ETH, Zürich, Swizerland, 151 pp., 2001.
Weiler, M. and Flühler, H.: Inferring flow types from dye patterns in macroporous soils, Geoderma, 120, 137–153, doi:10.1016/j.geoderma.2003.08.014, 2004.
Weiler, M. and Naef, F.: An experimental tracer study of the role of macropores in infiltration in grassland soils, Hydrol. Process., 17, 477–493, 2003.
World reference base for soil resources: A framework for interna-tional classification, correlation and communication, 2006 Edn., World soil resources reports 103, Food and Agriculture Organi-zation of the United Nations, Rome, 2006.
Wu, C. and Chen, J. M.: Diverse responses of vegetation production to interannual summer drought in North America, Int. J. Appl. Earth Obs. Geoinf., 21, 1–6, doi:10.1016/j.jag.2012.08.001, 2013.