Sketch-based Image Retrieval Using SRA
Saliency
Safiya P.C1, Sandhya V2, Niyas N3
M.Tech Student, Computer Science, KMCT College of Engineering, Kozhikode, Kerala, India 1,
Assistant Professor, Department of Information Technology, KMCT College of Engineering, Kozhikode,
Kerala, India 2
Assistant Professor, Department of Computer Science, KMCT College of Engineering, Kozhikode, Kerala, India 3.
ABSTRACT: Softwaresystems which uses hand drawn sketches as the queryfor image retrieval are known as sketch based image retrieval (SBIR) systems. One of the mainadvantages of these type of systems is that it can take sketches as input . Main task in SBIR is to measure the similaritybetween a query sketch and an image. As a solution to thisproblem, we propose a Sketch Based Image Retrieval approach using SRA Saliency which utilizes global as well as local image features. Here we propose two types of contour maps namely global contour map (GCM) and the salient contour map (SCM). SCM is to identify objects inside images which matches with the query sketch. Apart from these contour maps we proposean image feature called angular radial partitioning (ARP) feature combined with angular radial orientation partitioning (AROP) feature. AROP-ARP feature fully utilizes the edge pixel’s informationin GCM and SCM to identify the feature vectors. SBIR systems are very effective in the field of medical diagnosis, photo sharinglibrary etc.
KEYWORDS: SBIR, Salient Contour, Contour Reinforcement, AROP feature, SRA Saliency
I. INTRODUCTION
Digital Image processing is the manipulation of images from a digital camera which focuses on twomajor tasks. One is the improvement of pictorial information for human interpretation and the otherone is the processing of image data for storage, transmission and representation for autonomousmachine perception. Image retrieval means retrieving images from large image database by browsing and searching for intended images.In order to search for an image, we need to provide an input image or an image description as a searchquery. The image retrieval system will return images "similar" to the query after query processing and database searching. The similarity can be measured based on the description about the image, the content properties or the shape properties ofan image.
With the current technological boom in networking and multimedia, effective and efficientimage retrieval systems or tools are demanded greatly. In order to retrieve the desired images fromlarge digital image database we may use Content Based Image Retrieval (CBIR) systems or tools. The existing CBIR systems use an input image as a query. CBIR indexes the images in database based on thefeatures obtained from visual contents like color, texture, brightness so as to facilitate speedy retrieval. When the user is not ableto provide the exact image which he wants to search for or when he is not able to describethe image well as expected, it is difficult to search and retrieve the intended image from digital imagedatabase. As a solution to this problem,we propose a new image retrieval system based on query sketch.That is the user needs to draw a rough sketch of the intended image and give the sketch as the input query. The system retrieves and displays the similar images by matching the shape or outline of the images.
II. RELATED WORK
to achieve correlation. The edge histogramdescriptor [2] and the histogram of oriented gradients (HoG) [10] are also utilized to establish the SBIR system [8]. They both uses global features extracted from the image edges. Eitz et al. [4] use local descriptors to achieve better retrievalprecision. And QVE (query by visual example) [6] is a classical method by using blocks and local features.
In an earlier work [12], an SBIR approach is proposed withre-ranking and relevance feedback schemes. Query sketch semantics and the top ranked images ofthe initial results are fully utilized to improve retrieval performance. Then relevance feedback is applied to find more relevant images for the query.Chen et al. [14] present a system that composes a realisticpicture from a simple freehand sketch defined with text labels. Firstly, they use the text label to search the relevance item andbackground. And then they choose candidateimages for each scene item and background. During filtering each image issegmented to find the elements corresponding to the sketch. Finally, a two steps optimization for combiningthe filteredimages into a picture is done. First step is to optimize the blending boundary and assign each pixel within the boundary aset, indicating whether the texture and color of that pixel are consistent or not. Second step is to compute the blending resultby combining improved position blending and alpha blending.
Cao et al. propose alocal feature method, edgel index method [15], for sketch-based image search by converting a shape image to a document-likerepresentation.The edgel index approach is a shape-based indexing method[15]. It solves the shape-to-image matching problem using pixel-level matching. Oriented chamfer matching is used to compute the distance between contours to convenientlybuild the index structure [15]. Cao et al. use a binary similarity map (a hit map) instead of the distance map [15]. For each inputsketch, a set of hit maps is created, which correspond to the number of orientations. They also design a simple hit function.Specifically, if a point falls in the valid region on a hit map in the same channel, it is considered as one hit. The sum of all thehits is the similarity between a database image D (represents the contours of an image) and the query sketch Q. Then, they buildan edgel index structure for fast retrieval, which records thevalue of position and channel of the hit map. And last they usetwo-way matching. The one-way often leads to trivial results. Unsatisfactory results could be filtered out bycombining the opposite direction matching . Then, they multiply these two similarity scores to obtain a final score thatreduces the influence of trivial results.
The ARP method based SBIR approach is first proposed in[3]. It refines the angular partitioning feature [3] using radial partitioning. In ARP, the edge is firstly extracted by the Cannyoperator and Gaussian mask, and then the edge is thinned to obtain the abstract image. The ARP feature is obtained bypartitioning the image into
M
N
sectors, which uses the image center as the center of circles. Nis the number of radiuspartitions and Mis the number of angular partitions. The rangeof each angle is
2
/
M
and the radius of successive concentric circles isR/N, where R is the radius of thesurrounding circle of the image [3]. The contour is divided toM
8
angulars andN
4
radials. Based on the obtainedcontour map of the original image, the corresponding edge pixel number in each sector is utilized to represent each sector. Then, for the totalM
N
sectors, the final ARP feature is withdimensionM
N
. Recent work [9] also utilizes two candidate maps based onthe main region and the region of interest. However, the proposed method focuses on alleviating the impact of background and makes full use of thesalient contour. In the proposed work, matching is used to find the similar images inglobal and parts.A salient object detection algorithmwhich can be utilized to improve sketch retrieval performance is proposed in [5] using spectral residual approach. A method of sketch-based image retrieval by using saliency is proposed in[9]. They introduce saliency based on the color contrast into the sketch-based image retrieval to solve the common problems of scale and translation. Moreover, an improved Hausdor distance is proposed to increase punishment on outliers, which avoids the negative effects caused by the outliers. Also they extract salient regions first and then give them more priority on allocation of computational resources. Not only is the problem of location and scale resolved, retrieval efficiency can also be improved.
clustering patches s extracted from the binary images. Each patch extracted from an image has a fixed size. Only patches which contain contours with a labeled center pixel are used. Clustering is performed on the descriptors using the K-means algorithm. Given a set of sketch token classes, the authors detect their occurrence in color images with a learned classifier. Features are computed from color patches x extracted from the training images I. Ground truth class labels are supplied by the clustering results described above if the patch is centered on a contour in the hand drawn sketches S, otherwise the patch is assigned to the background or no contour class. A random forest classifier is used as classifier since it is an efficient method for multi-class problems.
III.PROPOSED ALGORITHM
Although a prior workproposes a SBIR based approach by salient contour reinforcement[1] to solve the problem of similarity measurement between a query sketch and a database image,real-time behavior of sketch-based image search engine on a large-scale database is very important due to the lack ofeffective and efficient matching solutions. The blasting boom of web images and the exceptional progress of search techniques have motivated us to reattempt and target atsolving the problem of web-scale sketchbased image retrieval. In this paper, we propose a new approach to calculate the similarity between a query sketchand the database images.
Fig.1 depicts the framework of the proposed SBIR system, which consists of the offline part andthe online part. In the offline part, for the dataset images, we sequentially execute four steps: 1) we first carry out pre-processing for dataset images to extract image salient regions and contour mapsby SRA [5] and Berkeley detector [7] respectively; 2) we use salient contour reinforcement method toextract candidate contour maps containing the global contour map and the salient contour map; 3)we extract AROP-ARP features based on the candidate maps named global features and salient features.
In the online part, for a given input query sketch, we extract the global contour map and the salient contour map based on the contour map. Then, similar to the offline, we extract AROP-ARP feature based on the two candidate maps. After we extract these two types of features, we measure the similarity between the query sketch features and the dataset image features. Finally, we sort the similarity score to get the result. In the following sub-sections we firstly introduce the offline system and then the online system step by step.
A.Salient Region and Contour Map Extraction
region is considered as the initial candidate region of the most dominant salient object. The other regions are labeled as background. The SRA method can extract the main object or scene well [5]. In this paper, we utilize the suggested parameter according to [5] to get the SRA salient map. The salient map for an image is defined as follows:
otherwise
T
if
y
x
SR
b,
0
70
,
1
)
,
(
(1)where
SR
(
x
,
y
)
1
denotes the pixel(
x
,
y
)
belonging to the salient region, otherwise belonging to the background region.Common edge detection algorithm cannot meet the requirements for better generating contours that vividly reflect objects shapes and suppress the influence by textures and noise in images.Therefore, researchers often adopt the berkeley detector [7] to extract object contours. Berkeley detector is used to extract contour map and edges gradient here. For an image, we apply the Berkeley detector to each image (re-size to 200x200 ). Thus we will get the true posterior probability and orientation at every potential edge. We define
B
(
x
,
y
)
as the raw contour map under the cut-off thresholdth
.
otherwise
th
y
x
p
y
x
B
th,
0
)
,
(
,
1
)
,
(
(2)From the true posterior probability
(
x
,
y
)
we can know that when th <0.5, there will be more edges in the contour map. However, the increased edges mostly are contributed by a complex background. Whenth
0
.
5
, there will be less contour information, which may not represent the object contours. In [4], [2], the authors chooseB
0.5(
x
,
y
)
as the image contour map. Similarly, we setCM
(
x
,
y
)
B
0.5(
x
,
y
)
and markCM
(
x
,
y
)
as the contour map. From the
)
,
(
x
y
CM
B
0.5(
x
,
y
)
the contour map can present the image contour accurately.For the input natural scene images as showed in the first row of Fig.2, the corresponding salient regions are shown in the second row. From Fig. 2, we can know that the SRA method can extract the main object or scene well.
B. Global Contour Map and Salient Contour Map Extraction
We divide the contour of an image into two types: the salient contour map and the global contour map. The global contour map aims at alleviating the impact of background. Salient contour map aims at finding the similar object between the sketch and the corresponding image.
When users use the SBIR system, they mostly concentrate on finding the object in the sketch. In order to meet user requirements, the retrieval result of SBIR system should be the images that contain the same object or scene. In addition, they should be as simple as possible. For these purposes, we extract global contour map by reinforcing salient contour map. In order to distinguish the complex background images, we should separate the complicated background from a contour map by decreasing the backgrounds threshold
th
. In order to represent the contour of the main object (or scene) accurately, we extract the global contour map by salient contour reinforcement. We chooseth
0
.
5
to obtain the background contour map. In this paper, we setth
0
.
3
. The global contour map is defined as follows:))
,
(
1
(
)
,
(
)
,
(
)
,
(
)
,
(
x
y
CM
x
y
SR
x
y
B
0.3x
y
SR
x
y
GCM
(4)In fact, when we see an image, we usually look through the whole image for a short while and then focus our eyes on the salient part. In most cases, we are more concerned about whether the input sketch can be found in the image. In order to find out the images that contain the same object or scene, we propose to utilize the salient contour map (SCM) to refine the result. The reason is that the SCM mainly contains the contour of objects or scene. We obtain the salient contour map through the following steps. Firstly, we have obtained the SRA salient map from Eq.(1) in each image and we use bounding-box to obtain the minimum rectangle of each SRA salient map. Secondly, we refine the salient map and get the candidate rectangle. Thirdly, in image candidate rectangle, we extract the salient contour map
SCM
(
x
,
y
)
from the contour mapCM
(
x
,
y
)
. The salient contour map is defined as)
,
(
)
,
(
)
,
(
x
y
SR
x
y
CM
x
y
SCM
(5)Fig 2. shows the natural images and salient regions as well as their contour maps. Third and forth rows are the global as well as salient contour maps corresponding to the natural images shown in first row.
C. AROP-ARP Feature Extraction
ARP [3] is a coarse representation for the contour image. It just statistics the number of edge pixels in each sector. In angular radial orientation partition, there are two methods for radius partition. So we firstly introduce the method of radius partition and then we introduce the AROP-ARP feature extraction. 1) Radius partition In [3], there are generally two types of radial partitioning: uniform and non-uniform. Non-uniform method usually adopts the square root (in short sqrt) solution. Uniform method divides the radial partitions by equal radius. In this method, they use the uniform partition. 2) Angular Radial Orientation Partitioning Feature , we divide the candidate contour maps into
M
N
sectors, where M is the number of angle partition and N is the number of radius partition and then we count the number of edge pixel in each sector. For each dataset image, we will extract the AROP-ARP features for the two types of contour maps: global contour map and the salient contour map. The ARP features are named as global AROP-ARP feature and salient AROP-AROP-ARP feature respectively.
The global AROP-ARP feature is comparatively sparse and its contribution in feature matching is low. When we make statistics of the global AROP-ARP feature, the background regions AROP-ARP feature value will be much bigger, which can make the image more distinctive. The salient AROP-ARP feature can be used to find the images that contain the similar object with the input sketch.
For a dataset image, we define the global AROP-ARP feature as
f
t1, t=1,2,...,T. , where T is the number of datasetimages. Similarly, we define the salient AROP-ARP feature as
ft
2
.D. Feature Matching with Salient Contour Reinforcement
Now, the online part is introduced. For a query sketch, we first extract global and salient features as described in offline part. Then, we compute the similarity for the query sketch and the data set image features according to their AROP-ARP features. As the fact that the query sketch only composes of clear lines on a clean background, we set the contour map
CM
(
x
,
y
)
as the global contour mapGCM
q(
x
,
y
)
, i.e.GCM
q(
x
,
y
)
=CM
(
x
,
y
)
. We choose the main object region which is the smallest rectangle that contains the largest pixel value. We obtain the salient contour mapSCM
q(
x
,
y
)
for the sketch by detecting its bounding box of the query sketch. We get the corresponding ARP features for the global contourf
q1and the salient contourf
q2for the query sketch q.In our offline and online systems, we represent each image by AROP-ARP feature. So, we can use Euclidean distance to measure their similarities. For the query sketch, let us denote the global contour similarity of query sketch and a dataset image t as
S
g(
t
)
and the salient contour similarity asS
s(
t
)
.
2 2 2 2 1 1)
(
)
(
q t s q t gf
f
t
S
f
f
t
S
(6)where
.
2 denotes the Euclidean distance of two vectors. The similarity between the query sketch and the dataset images can be determined by summing the weighted scores of global and salient contour similarities.)
(
)
1
(
)
(
)
(
t
w
S
t
w
S
t
S
g
s (7)where
w
is the weight,w
[
0
,
1
]
and t=1,2….,T. In our experiments, we set w=0.8.Computing
S
g(
t
)
andS
s(
t
)
between the query sketch and all the T dataset images is time consuming. So in this paper we utilize a salient contour reinforcement approach which is expressed as follows. 1. Salient contour similarity)
(
t
IV.EXPERIMENTS
In order to show the effectiveness of the proposed approach, we compare our algorithm AROP-ARP with the method AROP[10],the method ARP [3]. All experiments were carried out in the same environment.
A.Datasets
1)SBIR_100K dataset : This dataset was used in [4] (denoted as dataset_100k) and contains 101,240 images. There are 1240 benchmarked imagesfor 31 query sketches, and 100,000 noise images.
Fig 3: Some examples of input sketches
2)THUR15000 : Dataset for image retrieval using randomly selected internet images, downloaded from Flickr for 5 keywords: ”butterfly”, ”coffee mug”, ”dog jump”, ”giraffe” and ”plane”. The database also contains salient
regions marked at pixel accuracy, for images where such region exists.
B.Performance Evaluation
We use the precision under depth n (denoted as Precion@n) to measure the objective performance, defined as follows:
Z
m n
i m n
Z
R
i
n
ecision
1 1
1
1
(
)
@
Pr
(8)where
R
m(
i
)
is the relevance of the i-th result for query m,i
1
,
2
,...
n
andm
1
,
2
,...
Z
. if it is relevant to the query sketch, thenR
m(
i
)
=1, otherwiseR
m(
i
)
=0.C. OBJECTIVE COMPARISONS
AROP[1] and ARP [3] methods are all proposed by calculating features by angular and radial partitioning of the image contour. Considering this, we select these methods as comparison methods. Correspondingly, Precision@n curves of other methods and the proposed method with the depth varying in the range [1, 50] are shown in Fig. 4(a) (THUR15000 dataset) and Fig. 4(b) (SBIR_100K dataset). The curves are drawn by the results of the query sketches on our database . For fair comparison, the parameters M and N are set to 8 and 4 respectively for both ARP and AROP, and the partition of radius is uniform. The number of orientation channels in the proposed method is set to 4 and in the AROP method is set to 8.
Fig 4: Precision Comparison With other methods using THUR15000 and SBIR_100K Datasets
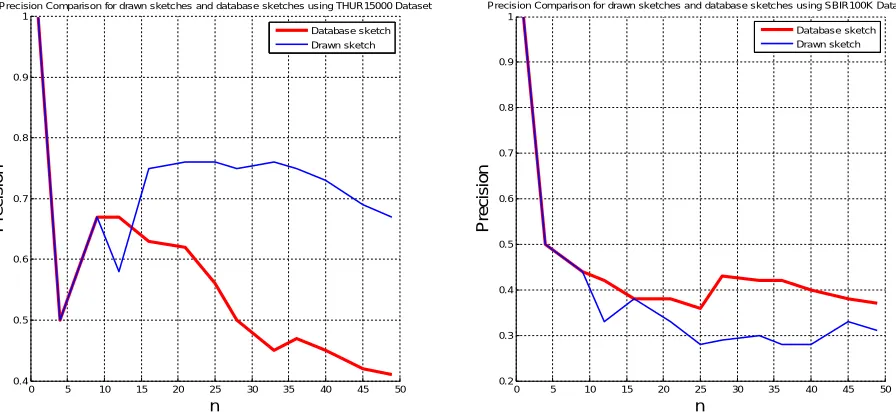
Fig 5(a) and Fig 5(b) shows the precision@n curves of the proposed method drawn by the results of the query sketches on our database as well as free hand drawn sketches.Precision comparison is also done for sketches from the database as well as sketches drawn by users. While using THUR15000 dataset, hand drawn sketches provide 33% more accurate result but with the SBIR_100K data set precision is reduced for hand drawn sketches by 22% when compared to sketches taken from the database.
Fig 5: Precision Comparison of sketches drawn by user and sketches from database using THUR15000 and SBIR_100K Datasets
0 5 10 15 20 25 30 35 40 45 50
0.1 0.2 0.3 0.4 0.5 0.6 0.7 0.8 0.9 1
Precision Comparison With other methods using THUR15000 Dataset
n P re c is io n
0 5 10 15 20 25 30 35 40 45 50
0 0.1 0.2 0.3 0.4 0.5 0.6 0.7 0.8 0.9 1
Precision Comparison With other methods using SBIR100K Dataset
n P re c is io n Ours AROP ARP Ours AROP ARP
0 5 10 15 20 25 30 35 40 45 50
0.4 0.5 0.6 0.7 0.8 0.9 1
Precision Comparison for drawn sketches and database sketches using THUR15000 Dataset
n P re c is io n
0 5 10 15 20 25 30 35 40 45 50
0.2 0.3 0.4 0.5 0.6 0.7 0.8 0.9 1
Precision Comparison for drawn sketches and database sketches using SBIR100K Dataset
The average computational costs of the three methods are shown in Table 1. The AROP based approaches are time consuming. These experiments were implemented using Matlab on Windows, and the code was only optimized in Matlab. But the relative computational costs are obviously different. AROP method takes 1.42s on an average to process a query which is higher than the proposed method. The ARP method costs 0.635s, which is less than ours. The reason is that the AROP features dimension is (O+1) times than ARP features dimension.
TABLE 1.
COMPARISON TO TIME COST TO PROCESS A QUERY ON AVERAGE IN DIFFERENT ALGORITHMS.
V.CONCLUSIONS
In this paper we have proposed a new approach by combining ARP and AROP features for sketch based image retrieval based on global and salient contour maps. The process of salient contour reinforcement is also utilized along with SRA saliency map generation algorithm. Experiments are done using THUR15000 and SBIR_100K datasets. On THUR15000 dataset, proposed feature has certain advantages over the other methods in retrieval precision. Various experiments proved that sketch retrieval algorithm outperforms the other methods.
REFERENCES
1. Xueming Qian*, Member, IEEE, Yuting Zhang, Xianglong Tan, Junwei Han, Senior Member, IEEEand Yuanyan Tang, Fellow, IEEE, “Sketch-based Image Retrieval by Salient Contour Reinforcement”, IEEE TRANSACTIONS ON MULTIMEDIA, MM-006447, 2016. 2. J Li, X Qian, Y. Tang, L Yang, T Mei, “GPS estimation for places ofinterest from social users' uploaded photos” IEEE Trans. on multimedia,
pp: 2058-2071,2013
3. A. Chalechale, G. Naghdy, and A. Merti ns, “Edge image description using angular radial partitioning, ” IEEE Proceedings-Vision, Image and Signal Processing, vol. 151(2), pp.93–101, April, 2004.
4. M. Eit z, K. Hi ldebrand, T. Boubekeur, and M. Alexa, “Sketch-basedimage retrieval: Benchmark and bag-of-features descriptors,” IEEE Trans. Vis. Comput. Graph., pp.1624-1636.,2011
5. Xiaodi Hou and Liqing Zhang, “Saliency Detection: A Spectral Residual Approach” , Computer Vision and Pattern Recognition, IEEE Conference on CVPR ‘07, 2007
6. K. Hi rat, and T. Kato, “Query by visual example,” Advances in Database Technology, EDBT'92. Springer Berlin Heidelberg, pp. 56-71, 1992.
7. D. R. Marti n, C. C. Fowlkes, and J. Malik, “Learning to detect natural image boundaries using local brightness, color, and texture cues,” IEEE TPAMI. , vol. 26, no. 5, pp. 530-549, 2004.
8. M. Eit z, K. Hildebrand, T. Boubekeur, and M. Alexa, “A descriptor for large scale image retrieval based on sketched feature lines,” SBM. ,pp. 29-36, 2099.
9. X. Qian, Y. Zhao, and J. Han, “Image Location estimation by SalientRegion Matching ,” IEEE Trans. Image Processing, vol.24, no.6, pp.4348-4358, 2015.
10. N. Dali and B. Briggs, “Histograms of oriented gradients for humandetection,” in CVPR, pp.886-893, 2005.
11. L. Lei, S. Chugging, Z. Chunder and A. van den Engels, “Shape similarity analysis by self-tuning locally constrained mixed-diffusion,”IEEE Trans. multimedia(TMM), vol. 15, no. 5, pp. 1174-1183, 2013.
12. X. Ian, X. Tan, Y. Chang, R. Bong, and M. Wang, “EnhancingSketch-Based Image Retrieval by Re-ranking and Relevance Feedback ”, IEEE Trans. Image Processing, pp.195-208, 2015.
13. Y. Ca, H. Wang, C. Wang, Z. Li, L. Chang, and L. Chang, “Finder: interactive sketch-based image search on millions of images,” inProceedings of the 18th ACM International Conference on Multimedia, Florence, Italy, 2010: 1605~1608,2010
14. T. Chen, M. Chang, P. Tan, A. Shamming, and S. Cu, “Sketch2Photo: internet image montage,” ACM Transactions on Graphics (TOG),pp.89-97, 2009.
15. Y. Ca, C. Wang, L. Chang, and L. Chang, “Edgel index for large-scale sketch-based image search,” IEEE CVPR, pp. 761-768. 16. B. W. Bong and Stefan Stoat, “Shape Matching Using multi stage integral invariants,” IEEE TPAMI., vol. 37, no. 1, pp. 151-160, 2014.
Method ARP AROP Ours
BIOGRAPHY
Niyas N received his B.Tech. degree inComputer Science and engineering from Cochin University for Science and Technology and MTech degree in Computer Science from University of Calicut.He has a broad span of experience in IT industry as well as Teaching. He is currently working as Assistant Professor in KMCT College of Engineering, Kozhikode. His research interest has a wide range including Image Processing and Supervised Machine Learning .
Safiya PC received her B.Tech. degree inComputer Science and engineering from University of Calicut, and currently pursuing MTech inComputer Science at KMCT College ofEngineering, Calicut. She has seven years of IT industrial experience as a software performance tester . Her research interest include Computer Vision, Image Processing and Image Retrieval.