A Data Mining Approach for Evaluating
Usage of Internet amongst Various
Universities
Simpa jindal
M.Tech Student, Dept. of Computer Science & Engineering, Desh Bhagat University, Mandi Gobindgarh, Punjab,
India
ABSTRACT: Internet is the way for every field that deals with information, to enter the Electronic Information Era. Internet provides the information, generated by different organizations, institutions, research centers and individuals all over the world. It has also become an essential part of educational field. This paper is an attempt to investigate the use of Internet among the faculty member and the students of Engineering Departments up to graduation level courses in the field of Engineering and Technology. For this purpose a survey was carried out using questionnaire tool. A well structured questionnaire was distributed among the teachers and students of all the Engineering Departments. The responses collected are mined using association and analyzed using t-test. The present study demonstrated and elaborated the outcomes on the basis of various aspects of Internet use such as, frequency of Internet use, most frequently used place for Internet use, purposes of Internet use, use of Internet services etc.
KEYWORDS: Internet, Universities, Education, Students, Questionnaires, Classification
I. INTRODUCTION
In the last decade, the use of information and communication technology has grown tremendously on a global scale. The information and communication technologies also have affected the educational field; new methods of education and research have been introduced. In recent years, the facilities such as online learning, teaching and research collaboration have totally changed the way of education. While some countries provide free or inexpensive internet access to educational organizations but in India, faculty and students must pay for time spent to access internet, whether at cyber cafe or libraries. To improve the ICT services, educational organizations have to show how students and faculty are using the internet in educational environment. Internet is the most powerful tool to access the information only with touch of finger. With the use of internet, user can find the right kind of information within nanoseconds at any time and at anywhere in the world. Today's users can no longer depend on conventional information sources to cope with the latest developments in their respective fields.
The use of internet in education field has enabled easy use of many resources and has increased the information sharing. Many universities are providing facility of online classes to the students that are unable to attend regular classes. Although the efficiency of this technology, it is evaluated with use of proportion of the desired results in student achievement does not exactly come out and is difficult to determine. Hence, much research has been conducted over time to understand the reasons for this situation. A research has proven its benefits in educational field. Among the ICTs (Information and Communication Technologies), the internet has been a single major force of change in higher education. Since 1991, and especially with the use of the www browser in 1993, the internet has gradually become the main vehicle of scholarly communication. However, sometimes, some university students and faculty members use the internet for reasons other than educational.
II. LITERATURE REVIEW
Singh (1998) conducted a research study on the use of Internet by the librarians in Malaysia. The main findings of the study indicated that 90% of the respondents used the Internet for work related purposes. Most of the respondents were recent users.
also held with faculty members. The study revealed that the Web was being used primarily to search general, factual, ephemeral or very specific information. The study also revealed that students and academicians faced many problems while searching the Web.
Lenares (1999) in his research study found that there was rapidly growing acceptance of electronic journals by faculty within the scholarly community. The increase in electronic journals usage is accompanied by a decrease in the frequent use of print journals. Print journal usage, however, continues to dominate electronic journal usage.Only 14 per cent of respondents used electronic journals frequently as compared to 65 per cent using print journals frequently. Questionnaire was sent through e-mail to randomly selected faculty members from the university directory.
Williams (1999) reported the use of information technology and the Internet in his project entitled "Information Technology in Michigan: Adult and Teen Survey Report." The results indicated that the majority of the respondents (72%) used the Internet at least once a week and 45% at least once a day.
Ruzgar (2005) studied the reason of the internet usage and learning through internet. It was observed that internet has turn out to be an important part of college/school life and its usage is 100 percent popular amongst students. It was concluded that 36 percent of the students spent one to five hours per week on the Internet. In terms of online activities, sending/receiving e-mail and other data was at the top of the list, followed by reading news and e books or searching sports information, research for college course work, chat, research for goods and services, and downloading or uploading images. Because of their online activities, they give less preference to television and other outdoor activities. .
III. NEED FOR THE PRESENT STUDY
In today’s world the use of Internet has been growing among the people for accessing knowledge, shopping, banking, research etc. This trend is also found among teachers and students but their needs are different and depend upon their functionality. So the current study is an effort to evaluate the efficiency of Internet as a learning mechanism, and what part it truly plays in the educational organizations. It is an undividable part of current engineering academic structure. Engineering institutions spend a good deal of sum on providing internet facility to both the teachers as well as to students. Hence, it is important to discover up-to what amount teachers or children are using this facility.
IV. METHODOLOGY
The study used a questionnaire, with various questions spread over the following areas General profile of the respondent, experience of Internet use, frequency of Internet use, place of Internet use, purpose of Internet use, methods of Internet learning skills, use of Internet services, problems face while using the Internet and favorite search engines. To facilitate quantification and analysis of data, mainly close-ended questions were used along with checklists and rating scales. A random sample of students and faculty members of engineering departments of university was selected and questionnaires were distributed among them. The association rules are used to mine the collected responses and analyzed using t-test. The description of process to mine and analyze the outcomes as following:
Classification Model
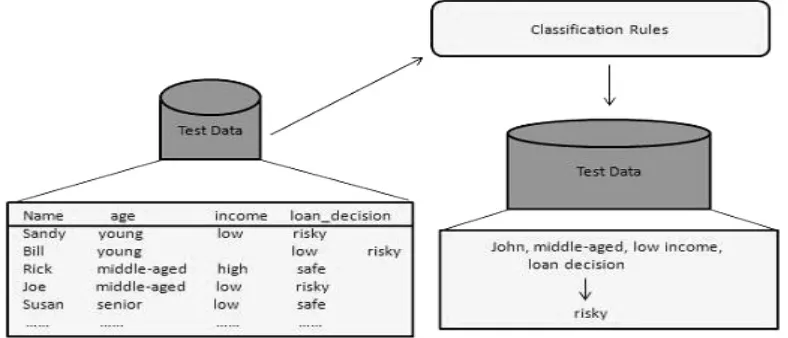
Classification models predict definite class values. For example, we can build a classification model to categorize bank loan applications as either safe or risky.
Following are the examples of cases where the data analysis task is Classification −
Figure 1 Building the Classifier or Model 1. Using Classifier for Classification
The classifier is used for classification. Here the test data is used to estimate the accuracy of classification rules. The classification rules can be applied to the new data tuples if the accuracy is considered acceptable.
Figure 2 Process to use classifier for classification
2. Data Collection Method
Students and Teachers registered in the various disciplines at the departments of engineering colleges of Punjabi University Patiala are represented as the population for the study. The questionnaire method will be employed to collect the data and to select the sample population using random sampling method.
V. RESULTS AND DISCUSSION
Analysis of data is the ultimate step in research process. It is the link between raw data and significant results leading to conclusions. This process of analysis has to be result oriented. The results obtained on the basis of various parameters are given below:
Gender
It is also is shown in table1 below.
Table 1 Gender Demographic Profile
Demographic Profile Students (N=50) Teachers (N=50) Total (N=100)
Gender Frequency Frequency Frequency
Male 23 28 51
Female 27 22 49
Age
A perusal of table 2 below shows that highest proportion of internet users belongs to age group of 20-40 years, followed by <20 years. The lowest proportion was of age >60 years followed by group 40-60 years. In case of teachers highest fraction belongs to group 20-40 years, followed by group 40-60 years and then by > 60 years where as in case of students majority was in age group < 20 years followed by 20-40 years. No student was found to be in age group of 40-60 and >60 years.
It is also is shown in table 2 below.
Table 2 Age Demographic Profile
Demographic Profile Students (N=50) Teachers (N=50) Total (N=100)
Age (years) Frequency Frequency Frequency
<20 38 0 38
20-40 12 29 41
40-60 0 18 18
>60 0 3 3
Locality
As illustrated in the table 3 below, majority of teachers and students are living in urban areas.It is also is shown in table 3below.
Table 3 Locality Demographic Profile
Demographic Profile Students (N=50) Teachers (N=50) Total (N=100)
Gender Frequency Frequency Frequency
Rural 11 7 18
Urban 39 43 82
Annual Income
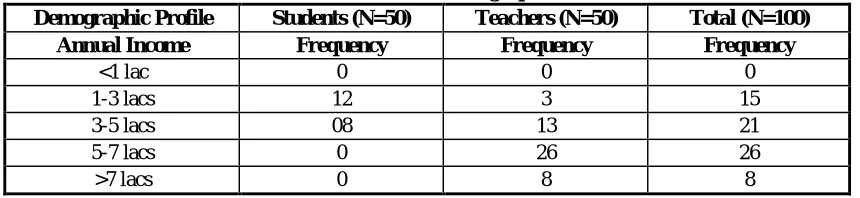
As illustrated in the table 4 below, the highest proportion of internet users are having annual income between 5-7 lacs, followed by 3-5 lacs group then by 1-3 lacs whereas lowest belongs to <1 lac followed by >7 lacs.
In case of students maximum were not doing any kind of job or part time job. Some students were doing job and earning between 1-3 lacs or 3-5 lacs. Teachers were generally found to have annual salary between 5-7 lacs, followed by 3-4 lacs and then >8 lacs. The lowest fraction having annual salary was <1 lacs followed by 1-3 lacs. It is also is shown in table 4 below.
Table 4 Annual Income Demographic Profile
Demographic Profile Students (N=50) Teachers (N=50) Total (N=100)
Annual Income Frequency Frequency Frequency
<1 lac 0 0 0
1-3 lacs 12 3 15
3-5 lacs 08 13 21
5-7 lacs 0 26 26
Educational Qualification
As illustrated in the 5 below, the highest proportion of internet users were found to be Post Graduate, followed by under-graduate whereas lowest proportion belongs to graduate. In case of teachers all were found to be post graduate whereas majority of students were found to be under graduate, followed by graduate and lowest were post graduate.
Table 5 Education Demographic Profile
Demographic Profile Students (N=50) Teachers (N=50) Total (N=100)
Education Frequency Frequency Frequency
Under-Graduation 33 0 33
Graduation 14 0 14
Post Graduation 3 50 53
Experience (in years)
As illustrated in the table 6 below, teachers have high experience of using Internet as compared to students. Table 6 Experience (in years)
Experience Students (N=50) Teachers (N=50) Total (N=100)
Frequency Frequency Frequency
1-3 years 12 0 12
3-6 years 15 8 23
6-9 years 13 11 24
9-12 years 7 22 29
>12 years 3 9 12
Frequency
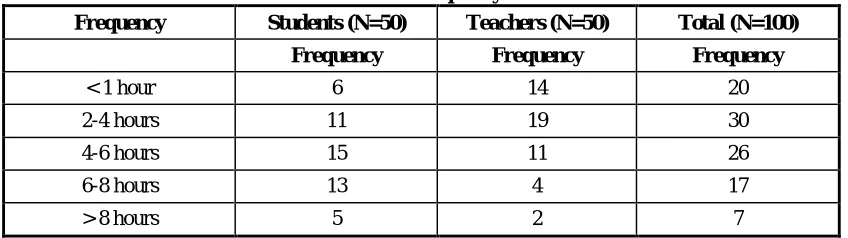
The frequency of using internet in hours per days has been illustrated in the table 7 below; It shows that students used to access Internet more than teachers.
Table 7 Frequency
Frequency Students (N=50) Teachers (N=50) Total (N=100)
Frequency Frequency Frequency
< 1 hour 6 14 20
2-4 hours 11 19 30
4-6 hours 15 11 26
6-8 hours 13 4 17
> 8 hours 5 2 7
Perception of Teachers and Students during Internet Use
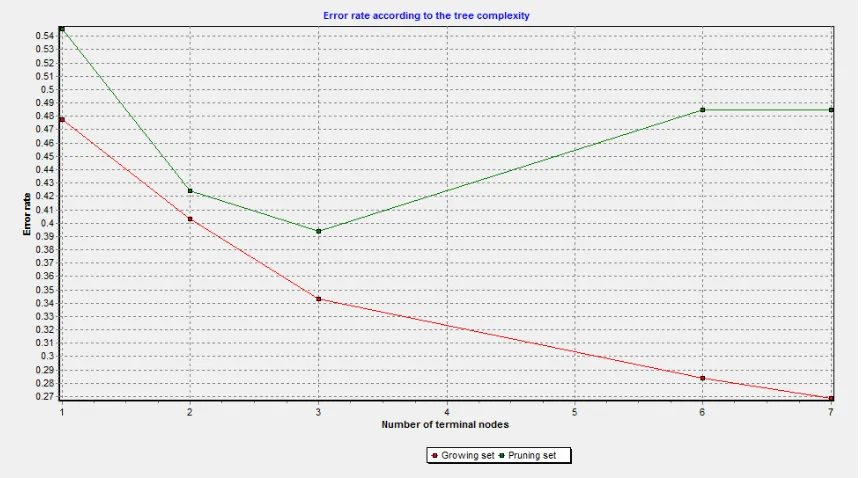
Figure 3 Perception of Teachers and Students during Internet Use Classification
The classification is used on the attributes and data of collected responses. Classification mined only the significant data from whole collected responses. The results in the form of error rate are shown in figure 3.
Figure 4 Classifications of collected responses
VI. CONCLUSION
REFERENCES
1. Singh, D. (1998). The use of Internet among Malaysian librarians. Malaysian Journal of Library and Information Sciences, 3(2), 1-10.
2. Voorbij, H. J. (1999). Searching scientific information on the Internet: A Dutch academic user survey. Journal of the Association for
Information Science and Technology, 50(7), 598.
3. Lenares, D. (1999, April). Faculty use of electronic journals at research institutions. In Proceedings of the ACRL Ninth National Conference,
Detroit, Michigan (pp. 329-34).
4. Williams, J. (1999). Information technology in Michigan: Adult and teen survey report. Retrieved May 21, 2004.
5. Ani, O. E. (2010). Internet access and use: A study of undergraduate students in three Nigerian universities. The Electronic Library, 28(4),
555-567.
6. Hong, K. S., Ridzuan, A. A., & Kuek, M. K. (2003). Students' attitudes toward the use of the Internet for learning: A study at a university in
Malaysia. Educational Technology & Society, 6(2), 45-49.
7. Cheung, W., & Huang, W. (2005). Proposing a framework to assess Internet usage in university education: an empirical investigation from a
student's perspective. British Journal of Educational Technology, 36(2), 237-253.
8. Chen, Y. F., & Peng, S. S. (2008). University students' Internet use and its relationships with academic performance, interpersonal relationships,
psychosocial adjustment, and self-evaluation. CyberPsychology & Behavior,11(4), 467-469.
9. Limpach, A. L., Bazrafshan, P., Turner, P. D., & Monaghan, M. S. (2008). Effectiveness of human anatomy education for pharmacy students
via the internet. American journal of pharmaceutical education, 72(6), 1.
10. Mohammad, J. A., & Al-Karaki, J. N. (2008). Integrating Internet into Traditional Education: A Practical Study of University Students' Usage
and Attitudes.Int. Arab J. Inf. Technol.,5(3), 241-252.
11. Cheung, W., & Huang, W. (2005). Proposing a framework to assess Internet usage in university education: an empirical investigation from a
student's perspective.British Journal of Educational Technology,36(2), 237-253.
12. Perry, T. T., Anne Perry, L., & Hosack-Curlin, K. (1998). Internet use by university students: an interdisciplinary study on three