ABSTRACT
GUO, QI. Evaluating the Effectiveness of Pre-Retirement Seminars: A Case Study of Progress Energy. (Under the direction of Melinda Sandler Morrill and Robert Clark.)
This research is based on the data collected from the pre-retirement seminars of
Progress Energy during 2008 and 2009. This research verifies the fact that the current
employees are lacking of certain knowledge of retirement policies and plans, and the
highly evaluated pre-retirement seminars provided by PGN did improve the necessary
financial literacy of the attendees. The findings also indicate that the effectiveness of the
seminars changed between 2008 and 2009 when the socio-economic and demographic
characteristics of the attendees were stable over time. A further discussion on the possible
impacts emphasizes on both the external changes brought by economic downturn and the
© Copyright 2010 by Qi Guo
Evaluating the Effectiveness of Pre-Retirement Seminars: A Case Study of Progress Energy
by Qi Guo
A thesis submitted to the Graduate Faculty of North Carolina State University
in partial fulfillment of the requirements for the Degree of
Master of Arts
Economics
Raleigh, North Carolina
2010
APPROVED BY:
____________________________ ____________________________ Robert Clark Howard Bondell
Co-Chair of Advisory Committee
________________________________ Melinda Morrill
DEDICATON
BIOGRAPHY
Born on November 25, 1986, in Beijing, Qi Guo was raised in the capital city of China
until she graduated from Beijing No.4 High School in 2005. She attended Zhejiang
University where she received a Bachelor of Management in Logistics Management in
2009.
In August of 2008, she started her MA Program in Economics with a minor in
Statistics at North Carolina State University. Since October 2008, she has served as a
student assistant of a project lead by Drs. Robert Clark, Melinda Morrill, and Steven
Allen, sponsored by the FINRA Foundation. The project is to evaluate employer-provided
pre-retirement planning programs. During the same time, she was under the direction of
TABLE OF CONTENTS
LIST OF TABLES.……….... v
1 INTRODUCTION ... 1
1.1 LITERATURE REVIEW ... 3
1.2 PROGRESS ENERGY ... 8
2 DATA DESCRIPTION ... 11
2.1 SURVEY DESIGN AND DATA COLLECTION ... 11
2.2 SUMMARY OF SAMPLES ... 13
3 EMPIRICAL ANALYSIS OF THE EFFECTS OF THE SEMINARS ... 15
3.1 DID THE SEMINARS REALLY IMPROVE RETIREMENT KNOWLEDGE? ... 15
3.2 DID EFFECTS OF THE SEMINARS CHANGE BETWEEN 2008 AND 2009? ... 16
3.3 WHAT FACTOR(S) IS/ARE ASSOCIATED WITH THE DIFFERENCES BETWEEN 2008 AND 2009? ... 18
4 FURTHER DISCUSSION: WHAT HAPPENED IN 2009? ... 21
4.1 THE EXTERNAL CHANGE OF THE RECENT ECONOMIC DOWNTURN ... 21
4.2 THE INTERNAL CHANGES OF TIME AND CONTENTS OF THE SEMINARS ... 22
LIST OF TABLES
Table 1 PGN Sample Description ……….…………..………. 31
Table 2 Summary Statistics for PGN Sample ……….………..………… 31
Table 3 Desire for Program and Program Evaluation ……….…….… 32
Table 4 Summary of Knowledge Questions………...………… . ….33
Table 5 Summary of Knowledge Questions of 2008 vs. 2009 ……….……35
Table 6 Summary of Simple OLS………..………… 37
Table 7 Average Knowledge Score by Socioeconomic Characteristic ……… 38
Table 8 Summary of OLS with Controlling Variables ………....…….………. 39
Table 9 Summary Economy Downturn ……….….………..……… 41
1
Introduction
As the first baby-boomers turned 60 at the end of 2005, the 78.2 million Americans
(Misonzhnik, 2006) born between 1946 and 1964 are heading towards retirement who
expect to be fully independent during the latter part of their lives, enjoying the fruits of
their labors. To achieve their desired levels of retirement, today’s older workers will need
to do some careful retirement planning while employed, and they must make good
decisions as they shift from work to retirement. Nowadays, many large employers have
developed pre-retirement financial education and retirement planning programs for
retirement eligible employees in order to enhance their basic level of financial literacy to
navigate the complex financial decisions.
Employers offer retirement preparation programs not only to benefit the retirees and
the company’s image, but also to increase productivity and morale among current
employees. It is widely believed that when companies recognize employee demand for
financial education and retirement planning assistance, and when firms develop such
seminars and programs, the employees appreciate and value this type of employee
benefit.
As one of the partners enrolled in FINRA Investor Education Foundation Project1,
Progress Energy, a Fortune 500 energy company, provides pre-retirement seminars to its
retirement eligible employees for years. Although prior studies have demonstrated the
positive role of financial education in financial planning behavior (Perry, 2005), the
effectiveness of the specific pre-retirement seminars in improving the knowledge of and
altering the retirement decisions of employees is obscure (Lusardi, 2007a). Hence, it is
not easy to conclude whether the company’s goal in providing the program to contribute
positively to the quality of employees’ retirement and to cut unnecessary costs to obtain
the efficiency is achieved.
This paper analyzes the results from the surveys collected from each seminar held
between 2008 and 2009 in order to examine whether the program is significantly helpful
in making financial decisions of the retirees by comparing the response before and after
the seminars. Specifically, changes occurred between 2008 and 2009 that the length of the
seminars was reduced from full day to half day, the presenter of the seminars and the
distributed materials were also changed and the macroeconomic environment was also
influenced by the recent economic downturn. Therefore, this paper will also analyze and
discuss whether differences exist between the years of the seminars effects in improving
the financial knowledge. If it is so, the paper will further examine and discuss the
possible influential factors that might cause these differences. The results of this case
study will help the company decide whether or not to continue providing the same type of,
1.1 Literature Review
Financial Literacy and Retirement Plan
Current expectations are that most people will stop working full time sometime
between ages 55 and 70 and will rely on sources other than employment for most of their
income (Howlett, 2008). To retire with an adequate income, today’s older workers will
need to do some careful retirement planning while employed, and they must make good
decisions as they shift from work to retirement. This is especially important for those
whose savings were eroded by the recession in the past year (Rzewnicki, 2009).
The definition of being ‘‘financially literate’’ is given by the Office of the State
Treasurer, State of Vermont, which indicates “having the knowledge, skills, and habits to
successfully manage one’s money.” (Office of the State Treasurer, Vermont). Researchers
are cognizant of the fact that promoting financial literacy is a difficult and likely costly
task, and more research is required to determine when and how to most efficiently build
financial literacy. It is also clear that it is necessary to enhance financial knowledge if
people are to do a better job navigating the complexities of the modern financial
environment (Lusardi & Mitchell, 2009).
It is convinced that financial literacy is lacking among older individuals and “for the
first time explore additional questions on financial sophistication which proves even
scarcer” after analyzing the new data from the 2008 Health and Retirement Study (HRS)
(Lusardi, Mitchell, & Vilsa, 2009). Findings have reiterated the need for focused financial
planning behavior (Perry, 2005), and that people who are financially knowledgeable are
more likely to behave in financially responsible ways (Hilgert, 2003).
To some extent, Olsen and Whitman found that “inadequate savings can be
attributed to a lack of sufficient retirement goals. Without setting goals for retirement
savings, many people fail to save enough and lack confidence in their future retirement
income.” (Olsen & Whitman, 2007). However, Brady demonstrated in 2009 that
“moderate 401(k) contribution rates can lead to adequate income replacement rates in
retirement for many workers.” (Brady, 2009). Investing money through their 401(k) plan
gives workers the benefit of tax-deferred saving. This lets employees increase their take
home pay and decrease workers’ current taxable income (Fidelity Investment). Among
workers with a basic level of financial knowledge, “future-oriented consumers expressed
a greater likelihood to participate in a retirement plan than less future–oriented workers.”
Howlett said in her paper (Howlett, 2008).
The length of time spent in retirement has dramatically increased during this century.
In 1900 a male age 60 could expect to live 2.8 years in retirement; by 1955, that number
had increased to 6.7 years, and to 16 years as of 1984 (Rzewnicki, 2009). “Given the
continued erosion in employer-sponsored retiree health benefits and defined benefit
pension plans,” Mermin found that “boomers will likely remain at work longer than
members of the previous generation. Lengthier careers will likely promote economic
growth, increase government revenue, and improve individual financial security at older
According to a 2001 American Association of Retired Person's (AARP) report, as
many as 80 percent of the Boomer generation intends to work after age 65, even if they
work after age 65, two-thirds of surveyed employees do not expect to work at the job
they will retire from, although most would prefer to stay with their present employer.
However, the fact is mentioned in the former paper that “not many expect to have that
opportunity because few think their current employer will offer that flexibility.” (Allen,
Clark, & Ghent, 2005).
Economic Downturn and Baby Boomers’ Behaviors
While the economic crisis is being felt by nearly every segment of the working
population, one group of workers is faced with particularly tough decisions regarding
their futures. Many job market corporation and research institutions have paid more
attention to the impacts on the baby boomer generation due to the recent economic
downturn. Facts and evidence have been found that the economic crisis has or will have
impacts on the behaviors of Baby Boomer when they are planning their retirement.
Losses and opportunities are coming together with this continuous crisis since 2007.
Six-in-ten workers over the age of 60 say that they are putting off their retirement due to
the impact of the U.S. financial crisis on their long-term savings, according to a survey by
CareerBuilder. The survey was conducted among more than 8,000 workers between
November 12 and December 1, 2008 (PrimeCB.com, CareerBuilder.com, 2009).
However, 53 percent of surveyed Coldwell Banker real estate professionals in retirement
Banker, 2009).
About the pension plans, from the end of 2007 to the end of March 2009, the
average 401(k) balance fell 31%, according to a report of Fidelity. The accounts have
rebounded, along with the rest of the market, but that's little help for those who retired -
or were forced to - during the recession. In a system in which one year's gains build on
the next, the disaster of 2008 will dent retirement savings long after the recession ends.
During the market downturn, the 401(k) savings of 55-to-65-year-olds lost a quarter more
than those of their 35-to-45-year-old colleagues. That's because in their early years, their
401(k)'s growth is driven mostly by contributions. They control their own destiny. But the
longer they hold a 401(k), the more market-exposed it becomes. It's a twist that breaks
the most basic rule of financial planning (Gandel, 2009).
A recent research2 found that in comprehensive new research of financial services
professionals, 77 percent of respondents indicated the current economic downturn has
had a significantly greater impact on their Boomer generation clients than any other
generation. More positively, 73 percent of respondents said the downturn has made their
Boomer clients more focused on financial planning (also more than any other generation).
A report of Park Ridge Company says “boomers have neglected planning because they
don't fully understand the value and they are embarrassed that they haven't accumulated
more assets and thus ignore the problem.” The same company also emphasized that
advisors who consider themselves “experts” at financial and retirement planning and take
a comprehensive look at their clients' financial, family and life goals appear to better
serve their clients and to be more successful in their own business than those who don't
focus on either type of planning (Park Ridge, 2009).
Retirement Preparation Program and the Employers
“Employers offer financial education because of poor participation by employees
in 401(k) retirement plans and fear of lawsuits from former workers claiming negligence
for having a poor pension plan,” Garman concluded in his paper that, “as a result,
employers typically offer narrowly focused financial education about retirement.
Employers should offer comprehensive personal finance employee education because the
cost is low and the benefits are high.” (Garman, 1998).
However, retirement preparation programs were also seen as a way to reduce retiree
dissatisfaction and the resultant negative image of the company projected by these
disgruntled persons. It was believed that a company-provided opportunity to prepare for a
more positive retirement experience would enhance the employees’ and the retirees’
opinions of the employer. As is the case for many companies offering such programs, the
company’s goal in providing the program was to contribute positively to the quality of
employees’ retirement. (Heath, 1996).
From my perspective, employers should both offer comprehensive personal finance
employee education and manage to keep the cost low and reach the high benefits.
Therefore, this paper will also provide a resource for companies’ managers who are
1.2 Progress Energy3
Progress Energy (NYSE: PGN), headquartered in Raleigh, NC, is a Fortune 500
energy company with more than 21,000 megawatts of generation capacity and $9 billion
in annual revenues. PGN includes two major electric utilities that serve approximately 3.1
million customers in the Carolinas and Florida. The company has earned the Edison
Electric Institute's Edison Award, the industry's highest honor, in recognition of its
operational excellence, and was the first utility to receive the prestigious J.D. Power and
Associates Founder's Award for customer service. The company is pursuing a balanced
strategy for a secure energy future, which includes aggressive energy-efficiency programs,
investments in renewable energy technologies and a state-of-the-art electricity system.
PGN celebrated a century of service in 2008.
PGN considers its employees as the greatest asset. The strength of the company
depends upon a high-performing, diverse workforce. Therefore, PGN regularly compare
its compensation and benefit packages with those of leading companies in the Southeast
to ensure that they are attracting and retaining the best people for its business. Their
benefits include:
1. Health, dental and vision coverage
2. Wellness programs
3. 401(k) and other retirement programs
4. Life and disability coverage
5. Flexible and alternate work schedules
6. Employee rewards and recognition
PGN has provided pre-retirement seminars for years between July and September.
Because of the nature of the electrical generation, the company offers a series of
programs at various sites each year when plant outages and storms. Retirement eligible
employees are invited to attend the program, however, with the fact that the median age
of the employees is 48 that PGN has a lot of people eligible to retire, some limitations are
applied. To be invited to these seminars, one must be within one year of retirement, or:
1. Age 54 with 14 years of service
2. Age 64 with 4 years of service
3. Any age with 34 years of service
Additionally4, attendees may only come to these sessions once every 5 years, so
they are asked to plan on attending when they are within 12-18 months from
retiring. This 5 year rule is waived in the event when there is a major change in benefits.
Basically the material and information presented is the same from year to year so it
wouldn’t really be beneficial to attend multiple years.
Before 2009, PGN held full day seminars that were conducted by company
personnel; however, several outside experts and representatives, such as the speakers
from the Social Security Administration (SSA), the certified financial planners, and estate
attorneys, were used to augment the program in the first half day, followed by company
specific portion about health, dental, life insurance benefits, 401(k) and pension benefits
(Clark, Morrill, & Allen, 2009).
In 2009, a change of the seminars from full day long to half day was implemented,
accompanied by another change of a new seminar leader and organizer. The company
specific portion has been extended slightly to include a discussion of social security and
Medicare (with handouts provided by the SSA). Attendees are encouraged to seek legal
expertise to get their estate planning in order with provided checklists and contact
information, and to take advantage of the educational opportunities, including one on one
sessions, from the 401(k) vendors to make sure they get a basic understanding about
2
Data Description
2.1 Survey Design and Data Collection5
PGN used hard copy surveys divided into two parts. Survey one was to be
completed by each participant prior to the start of the program. The objective of this
survey was to obtain baseline socio-economic data about the individual and his/her
household. In addition, participants were asked a series of questions concerning their
retirement plans and investment strategies. Employees were also asked to complete
questions about their financial literacy and their knowledge concerning employer and
national retirement programs.
At the conclusion of the seminar, participants were asked to complete a second
survey. Survey two asked a series of questions concerning the pre-retirement planning
program and the employee’s assessment of the seminar and its value. The knowledge
questions were repeated to see if the participants’ overall knowledge of retirement
programs had improved. Seminar participants were then asked if they had changed any of
the important retirement related decisions. As part of the long range objectives of this
research project, seminar participants was sent a third survey in one year to determine
whether the learning achieved at the seminar has been retained and how their retirement
plans have unfolded.
The objectives of survey one are to determine the employees’ level of understanding
of their employer’s pension and health plans, their knowledge about national retirement
plans such as Social Security and Medicare, their basic financial literacy, and their current
retirement plans. To assess the current level of knowledge regarding national retirement
plans, the survey asks about the early and normal retirement ages of Social Security, early
retirement penalties, cost of living increases, and the age of eligibility for Medicare. In
addition, participants are asked benefit and eligibility questions concerning their
employer defined benefit plans and their own 401(k) or 403(b) accounts. This survey also
includes several questions related to basic financial literacy.
Prior to attending the seminar, employees have made retirement plans, either
implicitly or explicitly. Survey one asks participants the age that they expect to retire,
when they expect to start Social Security benefits, what the expected level of benefits are,
and what benefits they expect to receive from their employer-provided retirement plans.
Questions probe the employee’s intentions concerning annuitization of pension assets and
work plans after they have retired from their current employer. Finally, survey one
contains a series of economic and demographic questions concerning current income,
wealth, age, marital status, and the work, income, and retirement benefits of any spouse
or partner. This detailed information on the employee’s household will allow for
comprehensive statistical analysis as they progress with this project.
The primary objectives of survey two are to determine how participants evaluated
the seminar, whether they enhanced their knowledge of retirement programs, and whether
employees’ impression of the seminars, the first section of survey two asks respondents if
the program provided useful information, if the information was presented at the right
level for them, if the presenters were of high caliber, if they will be better able to make
retirement decisions after completing the program, and whether they value the program
as an employee benefit. The next two sections of survey two repeat many of the questions
in survey one concerning retirement intentions and knowledge. By comparing the
answers given in survey two to those in survey one, they can assess the change in the
respondent’s knowledge about retirement programs and financial literacy and determine
whether participants have now changed their retirement plans.
2.2 Summary of Samples
In this paper, the data was collected from the survey designed to evaluate the
pre-retirement planning programs from 2008 to 2009, which were completed by the
attendees during each seminar. Summary of the data description is in Table 1. From all 27
seminars, 294 out of 333 attendees completed the surveys for a response rate of 88.28%.
Following certain criteria6 of data cleaning, 236 were used in this paper for a
sample-of-use rate of 80.27% of which 147 were from year 2008 and 89 were from year
2009.
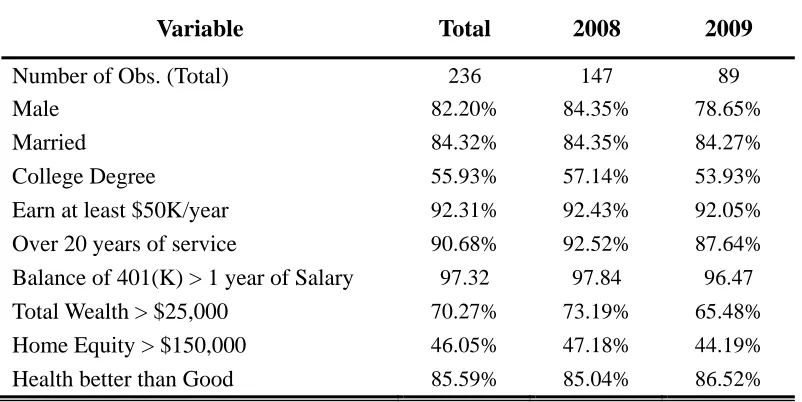
The Panel A and Panel B of Table 2 summarize the socio-economic and
demographic information about the attendees. According to the results in the first, the
average age of the respondents was 57.29, 82.20% were men, 84.32% were married,
55.93% had a college degree or above, the median years of service was 29, and 90.68%
had over 20 years of service. Among these employees, their median annual earnings were
between $75,000 and $100,000 and 90.1% earned at least $50,000 per year. Virtually
nearly all of the participants had established a 401 (k) account with a balance more than
one year of salary. The proportion of male attendees in 208 were 5.7% more than this of e
of 2009, and the proportion of those who had more than $25,000 value of total wealth in
2008 were 7.72% higher than this of 2009 . The rest of the compared situations were
almost the same such as the average age, the average service years, marriage status, and
percentages of earning at least $50K/year, college degree, over 20 years of service were
both higher than those of 2009. In general, the seminar participants represented middle
and upper income households who had substantial assets as they approached retirement.
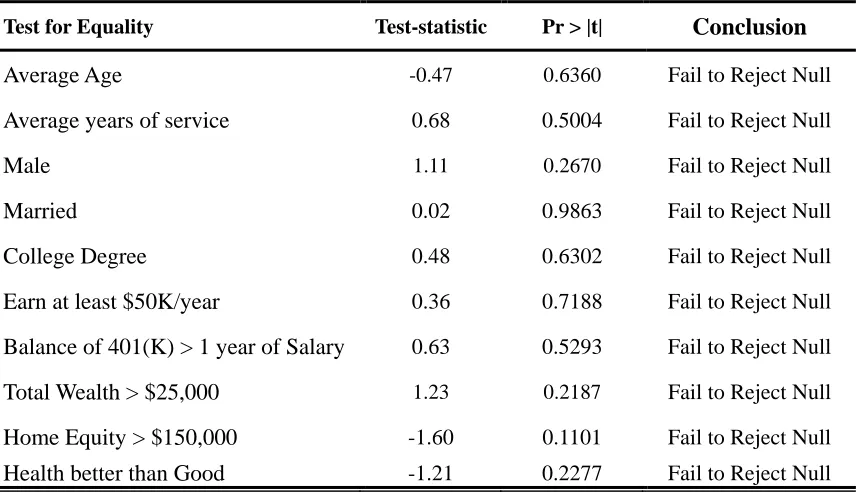
The results of the empirical test in Panel C of Table 2 also show that there is
significant statistical evidence to believe that none of these characteristics of attendees in
2008 was significant different with those of 2009. In other words, the types and
3
Empirical Analysis of the Effects of the Seminars
According to the summary of responses to the seminar evaluation questions (Table
3), the presenters and the contents of the seminars were highly accepted by the attendees.
94.45% of respondents indicated that the program included all or most of the information
they needed, 99.57% stated that program increase their awareness and knowledge of
Social Security, pension plans, and financial markets, 88.46% believed that they would be
able to make better retirement decisions after having completed this program, 68.09%
claimed that having participated in this program raised their awareness of the benefits
provided by PGN.
3.1 Did the Seminars Really Improve Retirement Knowledge?
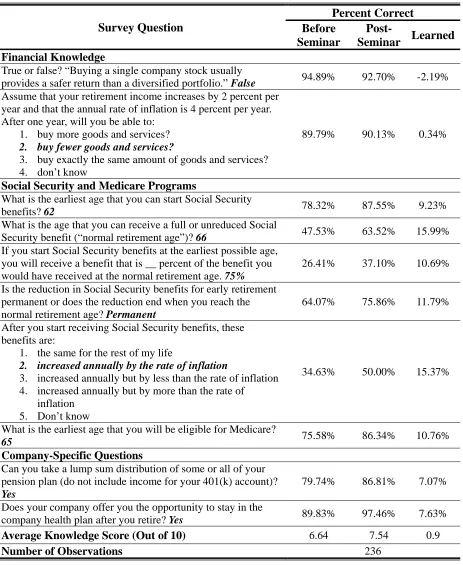
Although most of the employees responded to the questions related to the financial
knowledge at a high agreement rate, the responses reveal that many of them lacked basic
knowledge of Social Security prior to the seminars. Less than half of the attendees could
correctly answer some of the questions related Social Security benefit such as the age to
receive unreduced benefit, the reduced rate, and the relationship between benefits and
inflation rate.
However, after the seminars, there was a significant growth in the overall average
score7 out of 10 questions, from 6.64 to 7.54. Specifically, obvious increases (higher than
10%) of correct answers appear in the questions on both of the weak parts, such as the
reduction for starting Social Security benefits early (a 10.69% increase), the normal
retirement age for Social Security (a 15.99% increase), the age of eligibility for Medicare
(a 10.76% increase) and the correlation between the change of benefits and the rate of
inflation (a 15.37% increase). Before attending the seminars, 79.74% of the employees
knew they could take a lump sum distribution of some or their entire pension plan and
89.83% knew that PGN did offer them the opportunity to stay in the company health plan
after retirement, while the proportions increased to 86.81% and 97.46% after the
seminars, nearly 100%.
Next, I turn to the empirical strategy to test the means of pre- and post- seminar
scores8. The t-statistic is -5.341 and the p-value is less than 0.0001, which indicate
significant evidence that the means of average knowledge scores before the seminars is
less than the one after the seminars. Generally speaking, according to the results in Table
4, the seminars provided by PGN appear to be helpful and useful in improving the
financial and retirement literacy of the attendees.
3.2 Did Effects of the Seminars change between 2008 and 2009?
Since the seminars were held in different years through 2008 to 2009, it would
provide important information to compare the impacts of the seminars between the two
years, which would help us to examine whether the effects of the seminars changed and
to further discuss the possible factors that might have influences on the effects. A simple
method to evaluate the effects is to conduct a comparison between the summary of
knowledge before and after attending the seminars, grouped by the year of 2008 and
2009.
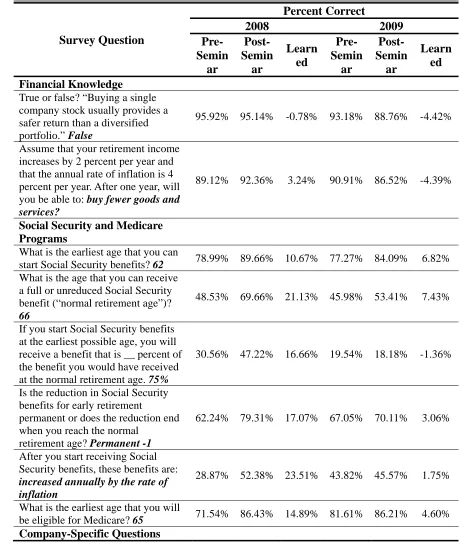
From Panel A of Table 5, both the accurate rates of the single questions and the
average knowledge score of 2008 are much higher than those of 2009. On one hand, the
accurate rates of 2008 were much improved, especially in the parts of Social Security and
Medicare Programs, which ranged from 10.67% to 23.51%. The improved rates of 2009
were no more than 7.43%, and some of them were even negative. It seems like the
employees of 2009 were confused between some correct and wrong answers after
attending the seminars. On the other hand, it is amazing that the average knowledge score
before the seminars of 2008 was lower than that of 2009, comparing 6.52 to 6.80.
However, it was improve by 1.31 after attending the seminars of 2008, while this
improvement was only 0.26 in 2009. As a result, the final average knowledge score of
year 2008 is 7.83, 0.77 higher than 7.06 of year 2009.
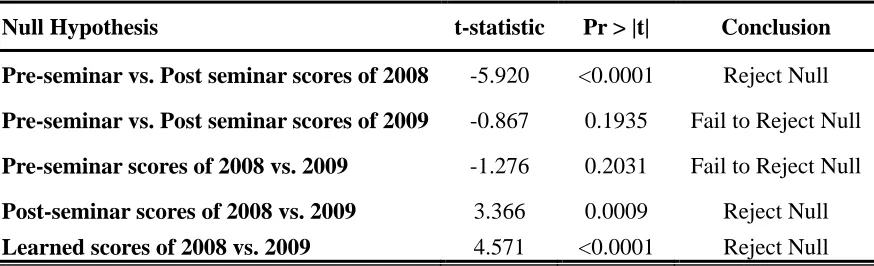
My next strategy is to do the mean tests between the knowledge scores in different
ways. The result in the first row of Panel B of Table 5 shows that the pre-seminar score of
2008 is significant less than the post-seminars. However, the result in the second row
does not indicate the same fact of 2009, which means the seminars in 2009, might have
no significant effects on improving the knowledge level of the attendees. Then I compare
these scores between the two different years. I find that there is no significant statistical
2009, which from another prospective supports the point9 that the attendees of different
years might not be distinctive from each other before attending the seminars. However,
the results of the post-seminar scores and the learned scores both reject the nulls,
implying there is significant evidence to believe that the attendees performed different
levels of retirement knowledge after attending the seminars. Namely, the seminars held in
different years might have different impacts on the attendees even they have similar
knowledge and socio-economic background before attending the seminars.
From all above, I can safely conclude that from both the empirical and statistical
results, the seminars of 2008 significantly improved the financial and retirement literacy
of the attendees, however, the seminars of 2009 may have less or no effects in the same
way as those in 2008.
3.3 What Factor(s) is/are Associated with the Differences between 2008
and 2009?
After examining the differences between the average knowledge scores of the two
years, one may ask what caused this significant gap of the effects between the two years.
To answer this question, my first concern is to check the relationship between the effects
of the seminars and the attendees with different characteristics and the changes of the
seminars between the two years. I assume that the pre-seminar knowledge scores reflect
the types and characteristics of the attendees without being influenced by the seminars,
and the post-seminar scores stand for the levels of retirement literacy including the effects
of the seminars. I also set up a year dummy to separate the attendees into two groups by
the year of 2008 and 2009. Then I perform a simple linear regression with these most
important two variables that might be the factors influence the effects of the seminars
directly.
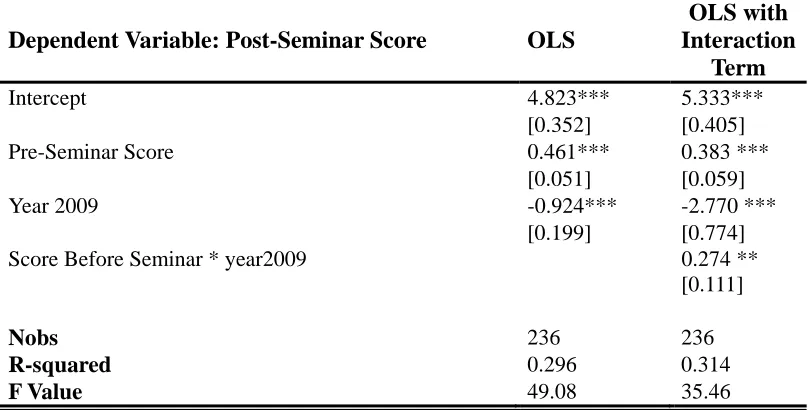
The estimates in column OLS of Table 6 show that both the variables have
significant effects on the post-seminar score. The estimate of the pre-seminar score is
0.461, indicating that any one point higher score before the seminar would produce a
0.461 point higher of a post-seminar score. The estimate of year 2009 is -0.924, which
implies that individuals were answering nearly one question fewer correctly in 2009
compared with those of 2008, which supports the findings in the former section10.
I also add an interaction term between the pre-seminar score and year 2009 to take
into account nonlinear exposure to the post-seminar score. Typically, I want to examine
whether the effect of pre-seminar scores changes over years. The results in the next
column of Table 6 show that the estimate of the interaction term is 0.274, which means
every one more point of the pre-seminars score in 2009, will produce 0.274 score higher
of the post-seminar score compared to 2008. At the meantime, the estimate of the year
dummy reduced to 2.770, which means although the attendees with the same pre-seminar
scores might have higher score after the seminars in 2009 than those of 2008, they would
indeed, performed nearly 2.5 less of their post-seminar scores combined with the
influence of the interaction term. The test of the interaction term shows that there is
significant evidence to believe that the estimate is not zero, so it might be helpful to
interpret the factors that might influence the effects of the seminars by using this
interaction term.
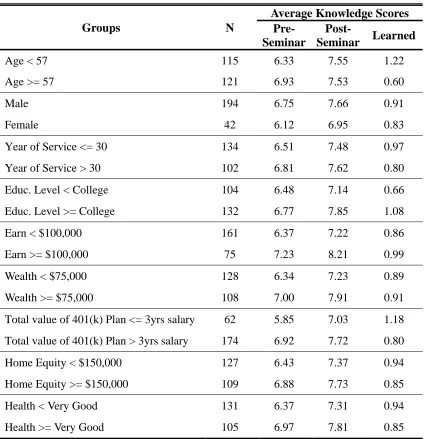
Lusardi once claimed in her paper that “one might anticipate that controlling for the
socio-economic and demographic characteristics in the multivariate regressions would
produce a cleaner estimate of the seminars effect.” (Lusardi, 2007b). Table 7 offers
insight into which average knowledge score patterns vary by those characteristic ,
including age, gender, year of service, educational attainment, income, wealth, total value
of 401(K), home equity and health situation. I did not use the information about their
spouses considering some of the attendees were not in marriage. You can see that there
exist some differences between the groups. For instance, attendees who hold more
amount of total value of 401(K) performed higher pre-seminar and post-seminar scores,
but improved less by the seminar when comparing the learned score (improved by the
seminars) with those had less amount of total value of 401(K).
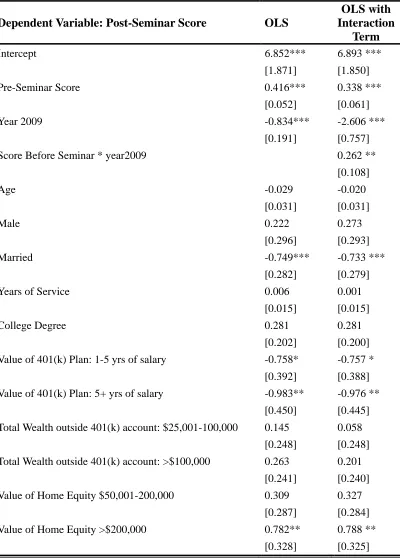
In this case, which is similar to the one in Lusardi’s research, my empirical strategy
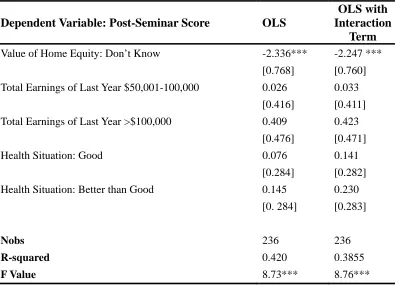
for the next step then adds these conventional determinants into the next model. The
estimates without adding the interaction term in Table 8 are 0.412 and -0.833 and the
t-statistics and p-values indicate that the pre-seminar score and year 2009 still
significantly influenced the post-retirement score even after controlling for a range of
socio-demographic factors. The same fact is shown with the results in the next column
after adding the interaction term. Namely, the pre-seminar scores and year dummy are
4
Further Discussion: What Happened in 2009?
After ruling out the possible influential factors of the seminars, this paper focuses on
finding out whether the seminars in 2009 themselves caused the different effects or there
might be other factors contributing to the influences. The following discussion is about
the changes happened between 2008 and 2009 which are categorized as external and
internal changes.
4.1 The External Change of the Recent Economic Downturn
Questions related to the economic downturn were added in the surveys of 2009,
assuming that the economic environment might be one of the most important external
influences that would have impacts on the effects of the seminars. The questions and
responses are listed in Panel A of Table 9. Though 38.27% of the attendees in 2009
decided to retire at an older age due to the economic downturn and this self-reporting age
is indeed 0.38 higher than the one of 2008, there is no statistical evidence to support that
the two means of pre-seminar scores are significantly different between 2008 and 2009
by conducting the t-test. According to the investment strategy, more than half of the 2009
attendees have altered some retirement plans. Specifically, only 10.11% of the attendees
in 2009 chose to contribute more to their 401(k) account accompanied with 40.70% of
them claimed that they have changed their investment strategy to be more conservative,
where only 6.98% of them changed to a more aggressive strategy.
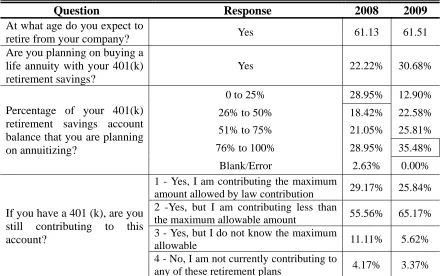
It is because the questions were not included in the surveys of 2008 that I cannot
with the questions available in both surveys. The questions in Panel B of Table 9 covered
the information of expected retirement age, annuity plan and 401(k) plan. All of the
responses were collected before the seminars for the purpose of minimizing the influence
of the seminars. Responses to these questions were not similar to each other. About the
attendees in 2009, nearly 8.5% more of them were planning on buying a life annuity with
their 401(k) retirement savings, and nearly 10% more of them decided to contribute less
than the maximum allowable amount to their 401(k) account. Along with this fact, 36.48%
of the same attendees in 2009 decided to substitute 76% to 100% of their 401(k) savings
to a life annuity, wherethe greatest proportion of the attendees of 2008 is 28.95% that
agreed to contribute only 0%-25% of their 401(k) savings to annuities. Recalling what
has been mentioned in the literature review about the pension plans, from the end of 2007
to the end of March 2009, the average 401(k) balance fell 31%, according to Fidelity
(Gandel, 2009), it seems that a great amount of attendees in 2009 lost their confidence in
the 401(k) plan and were considering substituting more of their retirement savings into a
life annuity as one of “the more conservative” investment strategies.
Though I couldn’t evaluate the exact level of influence caused by the economic
downturn on the behavior and tendency of the attendees, it should not be ignored that the
possibility of the influences might occur during the year between 2008 and 2009, which
could therefore contribute to the impacts on the effects of the seminars indirectly.
4.2 The Internal Changes of Time and Contents of the Seminars
full-day to a half-day program and the presenter was also changed in the year of 2009, the
internal changes of the seminars themselves are considered as another source of possible
influences on the effects of the seminars. Since a bundle of questions were designed to
collect information about the attendees’ evaluation of the seminars, it might be helpful to
check the satisfaction of the seminars by comparing the attitudes of attendees towards the
program between 2008 and 2009.
At first glance of Table 10, the seminars of the two years were both highly accepted.
However, with closely observation and carefully analysis, I do find some significant
differences between the two sources of outcomes after checking with the statistical tests.
Only two of the questions were responded more positively by attendees of 2009 than
those of 2008. Both of them were related to the material distributed during the programs.
However, the following question is also related to the quality of materials where 7.19%
less positive of attendees of 2009 thought that those materials were helpful in increasing
their understanding of Social Security and Medicare. Moreover, it recalls that the
attendees of 2008 performed better than those of 2009 in answering the knowledge
questions about Social Security and Medicare after attending the seminars.
The responses also reflect a less positive attitude in 2009 to the company after the
seminars, such as the abilities to make better decisions of retirement, the chance to
change retirement choices, the positive feelings about the company and the estimated
value of the program. The satisfaction of the leader who presented the 2009 seminars was
reflect the satisfaction of the presenters without evaluating the same presenter when
he/she presented the seminars from a full day to a half day. However, since the shortage
of time was the primary change of the seminars in 2009, it may prevent the employees
from understanding the information provided in the seminars.
From all above, it may not be enough only using the responses from the attendees to
conclude that the seminars of 2009 provide weaker information or fewer benefits to the
employees than the ones of 2008, but the less positive responses may be considered as
5
Summary and Conclusions
Pre-retirement seminars are becoming more and more desirable during the long
wave of Baby Boomer retirement. As a leading role of the employers, PGN has provided
this kind of seminars for years as one source of employees’ benefits. My research which
is based on the data collected from the surveys completed before and after the seminars is
dedicated to examine and evaluate the effects of the seminars. Specifically in 2008 and
2009 occurred some external change of the social and economic situations and some
internal change of the seminars. In this case, part of my research emphasizes on
estimating and analyzing the possible influences that might have impacts on the effects of
the seminars due to these changes.
My research verifies that the current employees are lacking of certain knowledge of
retirement policies and plans, and the highly accepted pre-retirement seminars provided
by PGN did improve the necessary financial literacy of the attendees from the full-picture
observation. Questions have been raised about the influential factors of the effects of the
seminars when differences of the post-seminar scores between 2008 and 2009 were
confirmed by comparing the data and conducting the empirical tests. The regression
results indicate that there is significant evidence to show that the pre-seminar scores and
the change of years have impacts on the post-seminar scores even after adding a bundle
of socio-economic characteristic controls. I also checked the results of the mean tests and
the patterns of scores grouped by different characters to verify that the pre-seminar scores
dummy that may have impacts that caused the different effects of the seminars. For the
next part, I discuss the possible impacts on the effects of the seminars including both the
external changes brought by the economic downturn and the internal changes of the
program itself in 2009.
If the results of this paper are used by PGN as information of evaluating the
seminars, one might consider these results as a referential value but not decisive factors
when looking for ways to cut off unnecessary costs and reach high benefits. Many factors
could influence the effects of the seminars combined with each other. For instance,
attendees of 2009 might be more interesting and worried about certain parts of their
retirement information and thus there were willing to learn more from the seminars,
which means, they might have a higher expectation than attendees of 2008. However,
they might be more disappointed when they found that the seminars were shortened from
one day long to a half day, and the more desired parts might have been given an
understatement. Or they might just felt less satisfied with the miss of the meal during the
day. The organizer and leader of this pre-retirement program should also balance between
the real cost and the level of the satisfactions of the attendees, especially during the very
time of financial crisis.
This paper should be valued by educators and employers seeking to enhance efforts
to plan and save for retirement, as well as researchers interested in exploring the financial
literacy. Care must be utilized when using these results of the paper due to the limitation
data integrity that might contain well-known difficulties (O'Connell, 2008) because the
data is collected through self-reporting paper surveys of a single employer. For instance,
data collected is not relevant or not comparable when analyzing other cases. Data may
also be biased as a result of uncertainty and obscurity that are caused by the self-reporting
References
Allen, S. G., Clark, R. L., & Ghent, L. S. (2005). "Managing a phased retirement program: The case of UNC". New directions for higher education , 47.
Brady, P. J. (2009). "Can 401(k) Plans Provide Adequate Retirement Resources?".
Pension Research Council. The Wharton School of the University of Pennsylvania.
Clark, R. L., Morrill, M. S., & Allen, S. (2009, 4). "Empoyer-provided Retirement Planing Programs". working paper .
Coldwell Banker. (2009). "Retirement Communities May Benefit From Economic Downturn". http://www.coldwellbanker.com/servlet/News?action=viewNewsItem
&contentId=14506705&customerType=News.
Fidelity Investment. "Eight Reasons Why 401(k)s Are a Smart Idea".
https://401k.fidelity.com/public/content/401k/About401ks/8reasonsWhy401k.
Gandel, S. (2009, 10 9). "Why It's Time to Retire the 401(k)". TIME , http://www.time.com/time/business/article/0,8599,1929119,00.html.
Garman, E. T. (1998, 8(2)). Personal Finance Education For Employees: Evidence On The Bottom-line Benefits. Financial Counseling and Planning , 1-8.
Heath, E. T. (1996). "Do retirement preparation programs improve the retirement experience?". Benefits quarterly , 40.
Hilgert, M. A. (2003). "Household financial management: The connection between knowledge and behavior". Federal reserve bulletin , 309.
Knowledge in Long-Term Financial Decisions". The Journal of consumer affairs , 223.
Lusardi, Annamaria, (2007a). "Financial Literacy and Retirement Preparedness: Evidence and Implications for Financial Education". Business economics , 35.
Lusardi, A. (2007b). "Baby Boomer retirement security: The roles of planning, financial literacy, and housing wealth". Journal of Monetary Economics , 217.
Lusardi, A., & Mitchell, O. S. (2009). "How Ordinary Consumers Make Complex Economic Decisions: Financial Literacy and Retirement Readiness". NBER Working Paper No. 15350 .
Lusardi, A., Mitchell, O. S., & Vilsa, C. (2009). "Financial Literacy and Financial Sophistication Among Older Americans". NBER Working Paper No. 15469.
Mermin, G. B. (2007, 9). "Why Do Boomers Plan to Work Longer?". S286.
Misonzhnik, E. (2006, 11). "Sixty something: A new chapter for the Boomer consumer".
Retail Traffic , 24-33.
O'Connell, A. (2008, 3). Evaluating the Effectiveness of Financial Education Programmes.
OECD papers , 17-18.
Office of the State Treasurer, Vermont. Financial Education in Vermont.
Olsen, A., & Whitman, K. (2007, 7). "Effective Retirement Savings Programs: Design Features and Financial Education". Social security bulletin , 53.
Park Ridge, I. (2009). "Financial Advisors: Economic Downturn Hitting Boomers Hardest". EON: Enhanced Online News ,
Perry, V. G. (2005). "Who Is in Control? The Role of Self-Perception, Knowledge, and Income in Explaining Consumer Financial Behavior". The Journal of consumer affairs , 299.
PrimeCB.com, CareerBuilder.com. (2009). "Six-in-Ten Workers Over the Age of Sixty Postponing Retirement Due to Economic Downturn, Finds CareerBuilder Survey".
Rzewnicki, A. (2009). "Workers Need to Boost Personal Financial Knowledge to Make Informed Retirement Decisions".
Table 1 PGN Sample Description Seminars Number of Seminars Attendees Response Rate Completed Surveys Sample Size for Analysis Sample-of-Use Rate Summer
2008 13 201 88.56% 178 147 82.58%
Summer
2009 14 132 87.88% 116 89 76.22%
TOTAL 27 333 88.28% 294 236 80.27%
Notes: Sample size for analysis is restricted to attendees who answered at least five out of the ten questions on both sections. Please see Table 4 for the details of the questions.
Table 2 Summary Statistics for PGN Sample
Panel A
Variable Total 2008 2009
Number of Obs. (Total) 236 147 89
Male 82.20% 84.35% 78.65%
Married 84.32% 84.35% 84.27%
College Degree 55.93% 57.14% 53.93%
Earn at least $50K/year 92.31% 92.43% 92.05%
Over 20 years of service 90.68% 92.52% 87.64%
Balance of 401(K) > 1 year of Salary 97.32 97.84 96.47
Total Wealth > $25,000 70.27% 73.19% 65.48%
Home Equity > $150,000 46.05% 47.18% 44.19%
Health better than Good 85.59% 85.04% 86.52%
Panel B
Variable 25%(Q1) Median 75%(Q3) Mean
Total Age (Years) 60 57 55 57.29
Years of Service 35 29 25 28.89
2008 Age (Years) 59 57 55 57.22
Years of Service 35 29 25 29.11
2009 Age (Years) 60 57 54 57.42
Table 2 (continued)
Panel C
Test for Equality Test-statistic Pr > |t| Conclusion
Average Age -0.47 0.6360 Fail to Reject Null
Average years of service 0.68 0.5004 Fail to Reject Null
Male 1.11 0.2670 Fail to Reject Null
Married 0.02 0.9863 Fail to Reject Null
College Degree 0.48 0.6302 Fail to Reject Null
Earn at least $50K/year 0.36 0.7188 Fail to Reject Null
Balance of 401(K) > 1 year of Salary 0.63 0.5293 Fail to Reject Null
Total Wealth > $25,000 1.23 0.2187 Fail to Reject Null
Home Equity > $150,000 -1.60 0.1101 Fail to Reject Null
Health better than Good -1.21 0.2277 Fail to Reject Null
Notes: All of the tests above are two-tailed tests. T-tests of means of the groups between 2008 and 2009 have been conducted with the Average Age and Average years of service. Two-sample proportion tests are conducted for the rest of the groups. All of the conclusions reject the null for the confidence interval of 90%.
Table 3 Desire for Program and Program Evaluation
Question Responded
“Yes”
Did this program provide all or most of the information you
needed to help you plan for retirement? 94.45%
Did the program increase your awareness and knowledge of
Social Security, pension plans, and financial markets? 99.57%
Do you think that having completed this program, you will now
be able to make better retirement decisions? 88.46%
Has participation in this program raised your awareness of the
benefits provided by your company? 68.09%
Table 4 Summary of Knowledge Questions Survey Question Percent Correct Before Seminar Post-
Seminar Learned
Financial Knowledge
True or false? “Buying a single company stock usually
provides a safer return than a diversified portfolio.” False 94.89% 92.70% -2.19%
Assume that your retirement income increases by 2 percent per year and that the annual rate of inflation is 4 percent per year. After one year, will you be able to:
1. buy more goods and services?
2. buy fewer goods and services?
3. buy exactly the same amount of goods and services? 4. don’t know
89.79% 90.13% 0.34%
Social Security and Medicare Programs
What is the earliest age that you can start Social Security
benefits? 62 78.32% 87.55% 9.23%
What is the age that you can receive a full or unreduced Social
Security benefit (“normal retirement age”)? 66 47.53% 63.52% 15.99%
If you start Social Security benefits at the earliest possible age, you will receive a benefit that is __ percent of the benefit you would have received at the normal retirement age. 75%
26.41% 37.10% 10.69%
Is the reduction in Social Security benefits for early retirement permanent or does the reduction end when you reach the normal retirement age? Permanent
64.07% 75.86% 11.79%
After you start receiving Social Security benefits, these benefits are:
1. the same for the rest of my life
2. increased annually by the rate of inflation
3. increased annually but by less than the rate of inflation 4. increased annually but by more than the rate of
inflation 5. Don’t know
34.63% 50.00% 15.37%
What is the earliest age that you will be eligible for Medicare?
65 75.58% 86.34% 10.76%
Company-Specific Questions
Can you take a lump sum distribution of some or all of your pension plan (do not include income for your 401(k) account)?
Yes
79.74% 86.81% 7.07%
Does your company offer you the opportunity to stay in the
company health plan after you retire? Yes 89.83% 97.46% 7.63%
Average Knowledge Score (Out of 10) 6.64 7.54 0.9
Table 4 (continued)
Table 5 Summary of Knowledge Questions of 2008 vs. 2009
Panel A Summary of Knowledge Questions Grouped by Years
Survey Question Percent Correct 2008 2009 Pre- Semin ar Post- Semin ar Learn ed Pre- Semin ar Post- Semin ar Learn ed Financial Knowledge
True or false? “Buying a single company stock usually provides a safer return than a diversified portfolio.” False
95.92% 95.14% -0.78% 93.18% 88.76% -4.42%
Assume that your retirement income increases by 2 percent per year and that the annual rate of inflation is 4 percent per year. After one year, will you be able to: buy fewer goods and services?
89.12% 92.36% 3.24% 90.91% 86.52% -4.39%
Social Security and Medicare Programs
What is the earliest age that you can
start Social Security benefits? 62 78.99% 89.66% 10.67% 77.27% 84.09% 6.82%
What is the age that you can receive a full or unreduced Social Security benefit (“normal retirement age”)?
66
48.53% 69.66% 21.13% 45.98% 53.41% 7.43%
If you start Social Security benefits at the earliest possible age, you will receive a benefit that is __ percent of the benefit you would have received at the normal retirement age. 75%
30.56% 47.22% 16.66% 19.54% 18.18% -1.36%
Is the reduction in Social Security benefits for early retirement
permanent or does the reduction end when you reach the normal
retirement age? Permanent -1
62.24% 79.31% 17.07% 67.05% 70.11% 3.06%
After you start receiving Social Security benefits, these benefits are:
increased annually by the rate of inflation
28.87% 52.38% 23.51% 43.82% 45.57% 1.75%
What is the earliest age that you will
be eligible for Medicare? 65 71.54% 86.43% 14.89% 81.61% 86.21% 4.60%
Table 5 (continued) Survey Question Percent Correct 2008 2009 Pre- Semin ar Post- Semin ar Learn ed Pre- Semin ar Post- Semin ar Learn ed Can you take a lump sum distribution
of some or all of your pension plan (do not include income for your 401(k) account)? Yes
77.08% 84.93% 7.85% 84.09% 89.89% 5.80%
Does your company offer you the opportunity to stay in the company health plan after you retire? Yes
90.48% 98.64% 8.16% 88.76% 95.51% 6.75%
Average Knowledge Score (Out
of 10) 6.52 7.83 1.31 6.80 7.06 0.26
Number of Observations 147 89
Notes: Correct Answers are listed in bold at the end of each question.”Don’t Know” was an option in several questions and was recorded as an incorrect answer. Skipped questions were also recorded as incorrect.
Panel B Mean Tests of the Knowledge Scores
Null Hypothesis t-statistic Pr > |t| Conclusion
Pre-seminar vs. Post seminar scores of 2008 -5.920 <0.0001 Reject Null
Pre-seminar vs. Post seminar scores of 2009 -0.867 0.1935 Fail to Reject Null
Pre-seminar scores of 2008 vs. 2009 -1.276 0.2031 Fail to Reject Null
Post-seminar scores of 2008 vs. 2009 3.366 0.0009 Reject Null
Table 6 Summary of Simple OLS
Dependent Variable: Post-Seminar Score OLS
OLS with Interaction
Term
Intercept 4.823*** 5.333***
[0.352] [0.405]
Pre-Seminar Score 0.461*** 0.383 ***
[0.051] [0.059]
Year 2009 -0.924*** -2.770 ***
[0.199] [0.774]
Score Before Seminar * year2009 0.274 **
[0.111]
Nobs 236 236
R-squared 0.296 0.314
F Value 49.08 35.46
Table 7 Average Knowledge Score by Socioeconomic Characteristic
Groups N
Average Knowledge Scores Pre-
Seminar
Post-
Seminar Learned
Age < 57 115 6.33 7.55 1.22
Age >= 57 121 6.93 7.53 0.60
Male 194 6.75 7.66 0.91
Female 42 6.12 6.95 0.83
Year of Service <= 30 134 6.51 7.48 0.97
Year of Service > 30 102 6.81 7.62 0.80
Educ. Level < College 104 6.48 7.14 0.66
Educ. Level >= College 132 6.77 7.85 1.08
Earn < $100,000 161 6.37 7.22 0.86
Earn >= $100,000 75 7.23 8.21 0.99
Wealth < $75,000 128 6.34 7.23 0.89
Wealth >= $75,000 108 7.00 7.91 0.91
Total value of 401(k) Plan <= 3yrs salary 62 5.85 7.03 1.18
Total value of 401(k) Plan > 3yrs salary 174 6.92 7.72 0.80
Home Equity < $150,000 127 6.43 7.37 0.94
Home Equity >= $150,000 109 6.88 7.73 0.85
Health < Very Good 131 6.37 7.31 0.94
Health >= Very Good 105 6.97 7.81 0.85
Table 8 Summary of OLS with Controlling Variables
Dependent Variable: Post-Seminar Score OLS
OLS with Interaction
Term
Intercept 6.852*** 6.893 ***
[1.871] [1.850]
Pre-Seminar Score 0.416*** 0.338 ***
[0.052] [0.061]
Year 2009 -0.834*** -2.606 ***
[0.191] [0.757]
Score Before Seminar * year2009 0.262 **
[0.108]
Age -0.029 -0.020
[0.031] [0.031]
Male 0.222 0.273
[0.296] [0.293]
Married -0.749*** -0.733 ***
[0.282] [0.279]
Years of Service 0.006 0.001
[0.015] [0.015]
College Degree 0.281 0.281
[0.202] [0.200]
Value of 401(k) Plan: 1-5 yrs of salary -0.758* -0.757 *
[0.392] [0.388]
Value of 401(k) Plan: 5+ yrs of salary -0.983** -0.976 **
[0.450] [0.445]
Total Wealth outside 401(k) account: $25,001-100,000 0.145 0.058
[0.248] [0.248]
Total Wealth outside 401(k) account: >$100,000 0.263 0.201
[0.241] [0.240]
Value of Home Equity $50,001-200,000 0.309 0.327
[0.287] [0.284]
Value of Home Equity >$200,000 0.782** 0.788 **
Table 8 (continued)
Dependent Variable: Post-Seminar Score OLS
OLS with Interaction
Term
Value of Home Equity: Don’t Know -2.336*** -2.247 ***
[0.768] [0.760]
Total Earnings of Last Year $50,001-100,000 0.026 0.033
[0.416] [0.411]
Total Earnings of Last Year >$100,000 0.409 0.423
[0.476] [0.471]
Health Situation: Good 0.076 0.141
[0.284] [0.282]
Health Situation: Better than Good 0.145 0.230
[0. 284] [0.283]
Nobs 236 236
R-squared 0.420 0.3855
F Value 8.73*** 8.76***
Table 9 Summary Economy Downturn Panel A
Questions Response Percentage
Have you chosen to contribute more to your 401(k) account each month because of the recent economic downturn?
Yes 10.11 %
Have you decided to retire at an older age
because of the economic downturn? Yes 38.27 %
You have not altered any of your retirement plans because of the economic downturn?
Yes, I have altered some plans. 52.27%
Because of the recent economic downturn, have you changed your investment strategy?
1 - No, I plan to maintain my former
investment strategy 52.33 %
2 - Yes, I have changed my investment
strategy to be more conservative 40.70 %
3 - Yes, I have changed my investment
strategy to be more aggressive 6.98 %
Note: Data above is based on the survey of 2009 (N= 89).
Panel B
Question Response 2008 2009
At what age do you expect to
retire from your company? Yes 61.13 61.51
Are you planning on buying a life annuity with your 401(k) retirement savings?
Yes 22.22% 30.68%
Percentage of your 401(k) retirement savings account balance that you are planning on annuitizing?
0 to 25% 28.95% 12.90%
26% to 50% 18.42% 22.58%
51% to 75% 21.05% 25.81%
76% to 100% 28.95% 35.48%
Blank/Error 2.63% 0.00%
If you have a 401 (k), are you still contributing to this account?
1 - Yes, I am contributing the maximum
amount allowed by law contribution 29.17% 25.84%
2 -Yes, but I am contributing less than
the maximum allowable amount 55.56% 65.17%
3 - Yes, but I do not know the maximum
allowable 11.11% 5.62%
4 - No, I am not currently contributing to
any of these retirement plans 4.17% 3.37%
Table 10 Program Evaluation
Question 2008 2009 Differ-
ence
Test
Stat P-value
Did this program provide useful information
that will help you plan for retirement? -Yes 97.24% 89.88% -7.36% 1.84 0.0329**
Was the material presented at a level that you could understand and incorporate into your retirement plans? -Yes
95.91% 100.00% 4.09% -1.93 0.0268**
Did you find the materials given to you during the program about right for me to understand these important issues (not too simple or too complicated) -Yes
93.20% 97.75% 4.55% -1.54 0.0612*
Were the materials given to you during the program helpful in increasing your understanding of Social Security and Medicare? -Yes
99.32% 92.13% -7.19% 2.96 0.0016**
If appropriate, did the program leaders provide you with citations, websites, etc. for you to consult if you need additional information on these topics? -Yes
100.00% 98.88% -1.12% 1.29 0.0989*
Rate the quality of this program in terms of increasing your understanding of the retirement decisions you are facing? - Better than GOOD
99.32% 98.88% -0.44% 0.36 0.3594
Rate the quality of the presenters and program
leaders? - Better than GOOD 100.00% 100.00% 0.00% 0.00 1.0000
Has the program increased your awareness and knowledge of Social Security, pension plans, and financial markets? -Yes
100.00% 98.88% -1.12% -0.16 0.4375
Do you think that having completed this program, you will now be able to make better retirement decisions? -Yes
90.34% 80.90% -9.44% 1.76 0.0389**
On the basis of this program, do you think you will change any of your retirement choices? -Yes
79.02% 67.05% -11.97% 1.77 0.0382**
Has participation in this program raised your awareness of the benefits provided by your company? -Yes
71.23% 62.92% -8.31% 1.25 0.1062
Has this program enhanced your positive
feelings about the company? -Yes 47.95% 37.08% -10.87% 1.58 0.0568*
Are programs like this valuable benefit to you
and your fellow employees? -Yes 66.44% 54.55% -11.89% 1..84 0.0326**