A Performance Evaluation of the
Spectrophotometric Technique Used For
Titanium Quantification in Selected Mineral
Ores against Other Advanced Techniques
N. P. Kulkarni 1, D. V. Parwate 2
Scientific Officer, National Institute of Miners’ Health, JNARDDC Campus, Wadi, Nagpur, Maharashtra, India1
Professor, Department of Chemistry, RTM Nagpur University, Amrawati Road, Nagpur, Maharashtra, India 2
ABSTRACT: The profession of mining is second only to agriculture in terms of its lineage. Not just does it form the
backbone of a country’s economy but it also generates a huge resource of employment opportunities. India as a country is endowed with huge reserves of many minerals. The current study focuses on evaluation of the conventional spectrophotometric technique used for quantification of trace amounts of titanium in bauxite and iron ores post mining against the advanced Neutron Activation Analysis (NAA) and Atomic Absorption Spectrometry (AAS) techniques. Results obtained for titanium estimation in bauxite ores using spectrophotometric technique indicated over-estimation over those obtained by AAS and NAA. However the same technique failed to detect titanium in iron ores despite its presence being reported by AAS and NAA respectively. Further despite concentration of titanium in bauxite ores differing significantly using the three methods there was observed almost near unity correlation with the estimations by these methods indicating linearity of relation. The data thus supported utility of spectrophotometric method as a predictor of results obtained by AAS and NAA methods in the case of bauxite ores. However no such conclusion could be arrived at for estimation of titanium in iron ores.
KEYWORDS: Titanium, Bauxite, Iron ore, Spectrophotometry, AAS, NAA.
I. INTRODUCTION
India is today one of the foremost in the list of developing countries. And this has been ably supported by the wave of industrialization since the last two decades. Notable also, is the support by the mining industry which has formed the crux of development. Every other day the number of mining ventures being accorded approval by the government of India is on the rise. The volume of ore being handled too is therefore on a steady increase. The important raw materials for the industry today, chiefly those of iron and steel, cement and fertilizer industry are provided by the mines of bauxite and iron ores [1].
Bauxite in addition to being the primary source of aluminium and present as an aluminous rock containing hydrated aluminium oxide (Al2O3.H2O or Al2O3.2H2O or Al2O3.3H2O) also contains metals such as iron and titanium [2] which
too are present in the form of oxides along with silica. Overall it has been observed that greater the percentage of aluminium oxide in bauxite, better is the grade and quality of the ore, with the percentage usually varying [3] in the range from below 40% to above 60%.
Iron ore on the other hand is chiefly found in the form of hematite (Fe2O3) and magnetite (Fe3O4). Constituting the
basic raw material for production of sponge iron, pig iron, steel and varied alloys, the ore has varying amounts of iron, aluminium and titanium based on the quality of ore being mined.
profits that accrue from mining of the parent ore. However its presence is definitely of interest to a student of chemistry and its quantification even more important for this study that involves its comparative analysis at the shallow end of the quantitative spectrum.
As such the most important activity after mining is analysis, classification and gradation of the mined ore. There has been a monumental increase in the number of procedures for grade and quality control measurements considering the amount of ore being handled today. However, despite all this, the simplicity of the spectrophotometric technique for analysis of elements in low concentrations has always been the method of choice with regards to quantification. That it is less time consuming makes it even more appealing to chemists. Estimation of titanium observed in comparatively lower concentrations in the bauxite and iron ores is therefore commonly done using the spectrophotometric technique employing hydrogen peroxide [5].
Also, today newer and newer estimation techniques are coming up for ore analysis, the latest among them being Neutron Activation Analysis (NAA). With pros such as it being quicker, non destructive and almost error free due to minimal physical handling, this technique is slowly gaining ground for elemental analysis as a whole [6]. However the infrastructure required for establishment of a NAA lab for ore analysis is elaborate despite the fact that post capital expenditure, ore analysis would cost close to nothing.
II. RELATEDWORK
Determination by NAA for most of the elements is usually done by the (n,γ) reaction [7,8]. Accordingly, the 320 and 929 keV peaks of titanium which has a half life of 5.76 m from 50Ti(n,γ)51Ti is used for estimating its concentration [9]. One of the greatest advantages of using NAA technique is that it doesn’t require elaborate sample preparation. Except for the process of drying samples having free moisture, no other mode of sample preparation is required. Accuracy equivalent to a standard deviation of 0.9% for dried samples and 0.7% for un-dried samples has been reported for alumina [6] in bauxite samples thus implying the suitability of NAA technique for this study involving quantification of elements in lower concentrations.
One of the most routinely employed instrumental techniques available today for any group of elemental determinations is Atomic Absorption Spectrophotometry (AAS). Not only has it been standardized for a host of elemental analyses, but this technique has also been commonly used to attempt correlation analysis with other methods being developed. Titanium is known to be present in extremely minute amounts in the ores [10] selected for the study. Selection of a technique that shows accuracy and reproducibility at lower concentrations is necessarily an important criterion. Studies have shown satisfactory correlation and conformance of AAS results for titanium quantification with ICP [11] and voltammetric procedures [12]. A good concurrence with AAS results was also observed for an integrative study on soil samples which involved titanium and wherein techniques such as ray Diffraction (XRD) and Energy Dispersive X-ray fluorescence (EDXRF) were applied [13].A significant number of studies [14,15] have also reported use of XRF for titanium estimation and their confirmation with results obtained using AAS.
No doubt, today instrumental techniques are gaining popularity due to their speed, high sensitivity, simultaneous detection capabilities, low limits of detection and automation, it is however here that personal preferences as well as the “best fit” technique creep in, as there is no single “best method” for any particular constituent analysis [16,17]. Size of a sample, nature of information desired, purpose of analysis, finances, etc. play an important role in selecting this best-fit technique.
III. METHODS
A total of ten samples of bauxite and iron ores each were collected from varied mines situated in South Western India, Central India and Eastern part of India. Care was taken to select appropriate and active mining benches of these mines. Post collection, segregation and labeling, the bauxite ore samples were pulverized and passed through a 100 mesh sieve. One gm of each of this finely pulverized bauxite ore samples were then weighed and digested in an acid mixture in accordance with the standard prescribed methods [18]. The resultant stock solution was then used for spectrophotometric and AAS methods of analysis prescribed for titanium [18].
A similar procedure was also followed for digestion of iron ore samples and subsequent preparation [18] of its stock solutions for spectrophotometric and AAS analysis.
Titanium is known to form the pertitanic complex in the presence of hydrogen peroxide and the intensity of the colour thus produced is directly proportional to the concentration of titanium. The said principle [18] was used to determine titanium spectrophotometrically at 410 nm in the stock solution of bauxite ore samples. Concentration of titanium in respective samples was obtained by plotting against respective absorbance values on the standard graph. Sufficient readings for titanium concentrations (%) in bauxite ores were taken using the spectrophotometric method and a representative Mean ± S.E. for the same was calculated.
As such titanium is known to be present in minute quantities in bauxite and iron ores [19-21]. While titanium was successfully detected in bauxite ores using the hydrogen peroxide spectrophotometric method the same could not detect titanium in any of the iron ore samples. Qualitative wet chemical tests too failed to detect the presence of titanium in any of the iron ore samples [22].
Estimation of titanium using the NAA technique for the respective samples of the two ores was carried out at Indira Gandhi Centre for Atomic Research (IGCAR), Kalpakkam. Accordingly 50 mg of each ore sample and its standard were weighed accurately and heat sealed in dry polyethene bags which had been pre-rinsed with distilled water. A polythene bag of a similar size was irradiated with each set, as a blank. In a set three samples, comparator standard, Au (k0 method of analysis) and blank were irradiated together under identical conditions for a period of 5 minutes at the KAMINI reactor of IGCAR, Kalpakkam. Following irradiation, the 320 and 929 keV peak with 5.76 m half life from 50Ti(n,γ)51Ti were used for estimating the presence of titanium in the samples of the two ores on a High Purity Germanium (HPGe) detector [23]. Since IGCAR has standardized the methodology for the same, only one reading for titanium per ore sample was noted.
Stock solutions prepared for both the ore samples were also analyzed on Varian make AAS (Model: 240FS) of Geological Survey of India (GSI), Nagpur unit using the flame technique. AAS too being a standardized technique, only one reading for each element per sample was noted.
The said singular values have therefore been considered as “standard” for the purpose of statistical analysis.
IV. RESULTSANDDISCUSSION
The concentration of titanium as obtained in the varied ores is summarized in Tables 1 and 2 respectively.
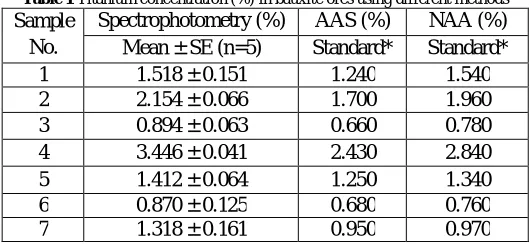
Table 1 Titanium concentration (%) in bauxite ores using different methods
Sample No.
Spectrophotometry (%) AAS (%) NAA (%) Mean ± SE (n=5) Standard* Standard*
1 1.518 ± 0.151 1.240 1.540
2 2.154 ± 0.066 1.700 1.960
3 0.894 ± 0.063 0.660 0.780
4 3.446 ± 0.041 2.430 2.840
5 1.412 ± 0.064 1.250 1.340
6 0.870 ± 0.125 0.680 0.760
8 1.282 ± 0.071 0.980 1.020
9 4.706 ± 0.135 3.800 3.980
10 5.365 ± 0.172 4.680 4.950
* Single available observation is taken as "Standard”
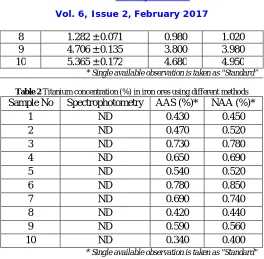
Table 2 Titanium concentration (%) in iron ores using different methods
Sample No Spectrophotometry AAS (%)* NAA (%)*
1 ND 0.430 0.450
2 ND 0.470 0.520
3 ND 0.730 0.780
4 ND 0.650 0.690
5 ND 0.540 0.520
6 ND 0.780 0.850
7 ND 0.690 0.740
8 ND 0.420 0.440
9 ND 0.590 0.560
10 ND 0.340 0.400
* Single available observation is taken as "Standard" ND: Not Detected Bauxite ores
Titanium presence in the varied bauxite ores studied was observed to be in the range from 0.870 - 5.365(%), 0.660 - 4.680(%) and 0.760 - 4.950(%) when analyzed respectively by the spectrophotometric, AAS and NAA techniques.
From the results it was observed that the data points for analysis by AAS and spectrophotometric techniques were close to each other except for sample numbers 1, 2, 4 and 10 which were farther. The data points of NAA and spectrophotometric analysis however were consistently closer to each other.
The methods to be compared with the spectrophotometric technique being standardized techniques with only one reading each per sample, single sample t test was performed for comparison of results. The details of the said comparison are presented in Table 3. Overall the results were observed to be comparable except in a few cases. In the case of comparison between spectrophotometric and NAA estimations, only four of the total number of samples were observed to have readings differing significantly statistically whereas a similar number of comparisons in the case of spectrophotometric and AAS comparison reported no significant differences in the set of readings.
Table 3 Comparison of results using single sample t-test for results of titanium (%) in bauxite ores obtained by spectrophotometric method against
AAS and NAA methods Sample
No
Spectrophotometry and AAS Spectrophotometry and NAA
t Significance t Significance
1 1.847 NS 0.146 NS
2 6.847 p<0.005 2.926 p<0.05
3 3.739 p<0.05 1.822 NS
4 24.967 p<0.001 14.892 <0.001
5 2.517 NS 1.118 NS
6 1.519 NS 0.881 NS
7 2.289 NS 2.164 NS
8 4.286 p<0.05 3.719 p<0.05
9 6.697 p<0.005 5.366 p<0.01
10 3.986 p<0.05 2.414 NS
Calculation of mean percent deviation was undertaken to assess percent deviation of the results using the spectrophotometric method for estimating titanium (%) in bauxite ore as compared to the other sophisticated methods. The results presented in Table 4 indicate deviation of spectrophotometric technique results from AAS by 27.54% as compared to NAA where the deviation was 15.25%.
Table 4 Mean percent deviation with respect to other methods for results of titanium (%) in bauxite ores obtained by spectrophotometric method
From Results of AAS method* 27.535% From Results of NAA method* 15.248%
*: Based on average of 10 samples
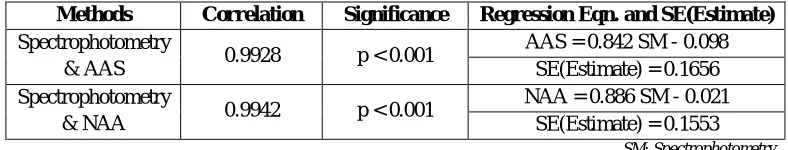
Correlation and regression analysis presented in Table 5 was carried out to study linearity of the spectrophotometric technique with AAS and NAA techniques with respect to estimation of titanium in bauxite ores.
Table 5 Relationship of results of spectrophotometric method with other methods on basis of sample-wise means for presence of titanium (%) in
bauxite ores
Methods Correlation Significance Regression Eqn. and SE(Estimate)
Spectrophotometry
& AAS 0.9928 p < 0.001
AAS = 0.842 SM - 0.098 SE(Estimate) = 0.1656 Spectrophotometry
& NAA 0.9942 p < 0.001
NAA = 0.886 SM - 0.021 SE(Estimate) = 0.1553
SM: Spectrophotometry
Both the correlations viz. between spectrophotometric and AAS techniques, and between spectrophotometric and NAA technique were observed to be highly significant and approached the maximum possible correlation value of 1. This is an important result while evaluating the spectrophotometric technique in reference to estimation of titanium in bauxite ores as it is indicative of precision and correlation being almost the same.
Iron ores
Titanium is present in minute quantities in iron ores [1,9,21]. The same was confirmed when titanium could not be detected in iron ores by the hydrogen peroxide spectrophotometric method which had however been adopted successfully for the purpose of estimating titanium in bauxite ores. Qualitative wet chemical tests too failed to detect the presence of titanium in iron ores [10]. Titanium was however successfully quantified using the standardized AAS and NAA techniques. Overall, titanium presence in the varied iron ores studied was observed to be in the range from 0.340 – 0.780(%) and 0.400 – 0.850(%) when analyzed respectively by the AAS and NAA techniques.
A summary of the results obtained and presented in Table 2 indicated the extremely low concentration of titanium in iron ore. While the spectrophotometric technique failed to detect titanium, AAS and NAA were successful in measuring the same. This is indicative of the spectrophotometric technique not being particularly suitable for detecting titanium in iron ores, considering its low concentrations. Additionally the percentage of titanium in iron ore as reported by AAS and NAA were observed to be quite close to each other underlining the fact that techniques such as AAS and NAA are better pointers than the spectrophotometric technique towards estimating titanium concentration in iron ores. In this case there was observed to be no utility of spectrophotometric technique to estimate titanium percentage in iron ores following which statistical analysis was ruled out.
V. CONCLUSIONS
(i.e. 0.66%). Its corresponding percentage by the spectrophotometric technique was 0.894 ± 0.063%. Some iron ore samples were observed to return lower concentrations of titanium than the above said values using the AAS and NAA technique. However, despite this the spectrophotometric technique failed to detect titanium in these iron ore samples. Overall it was observed that the results obtained by the spectrophotometric technique in general overestimated those obtained by the AAS technique in all cases except for those where very low levels of titanium were reported. In such instances, the spectrophotometric technique failed to detect in totality.
Further, with respect to bauxite ores even though the results of the spectrophotometric technique in general differed significantly with the estimations afforded by the technically superior methods, they showed almost near unity correlation with the estimations by these methods indicating linearity of relation for estimation of titanium in bauxite ores. The data thus supported the utility of the spectrophotometric method as a predictor of results obtained by AAS and NAA methods in the case of bauxite ores. However no such conclusion could be arrived at for estimation of titanium in iron ores. Also, there being only a single observation using advanced techniques it caused limitations while generalizing results as comparison between superior methods couldn’t be attempted. The results can therefore be taken only as indicative of the inferences which are drawn from the study results.
ACKNOWLEDGEMENTS
The authors are thankful to the Head, Dept. of Chemistry, RTM Nagpur University for providing laboratory facilities. One of the authors (N. P. Kulkarni) is also thankful to Director, NIMH for according permission to carry out the said study. The authors are also thankful to Head, IGCAR, Kalpakkam and Director General, GSI for according permission for analysis of ore samples at their respective laboratories.
REFERENCES
[1] Mineral Information Institute, “Iron Ore - Hematite, Magnetite and Taconite”, (2006)
[2] Buczko, Cs. M., Mukherjee, S., Dezso, Z., Hegedus, M., and Varady, M., “Determination of titanium in bauxite: A comparison of Neutron
activation analysis with the X ray fluorescence method” Journal of Radioanalytical Chemistry, Vol.29, pp.295-300, 1976.
[3] Controller General, Indian Bureau of Mines, “Indian Minerals Yearbook”, pp.17, 2007.
[4] Controller General, Indian Bureau of Mines, “National Mineral Inventory – An overview 2000”, 2005.
[5] Director General, Geological Survey of India, “Manual of recommended methods for chemical analysis of ores and minerals – Series I”,
pp.3, 1983.
[6] Borsaru, M., and Eisler, P. L., “Simultaneous determination of silica and alumina in bulk bauxite samples by Fast Neutron Activation”, Analytical Chemistry, Vol.53, pp.1751-1754, 1981.
[7] Alfassi, Z. B., and Lavi, N., “Fast determination of iron by neutron activation analysis (NAA) using reactor and epithermal neutrons”, Journal of Radioanalytical and Nuclear Chemistry, Vol.84/2, pp.363-368, 1984.
[8] Hevesy, G., and Levi, H., “The action of neutrons on the Rare Earth Elements”, Det. Kgl. Danske Videnskabernes Selskab,
Mathematisk-fysiske Meddelelser, Vol.14(4), pp.3-34, 1936.
[9] Kim, C. K., and Meinke, W. W., “Thermal neutron activation analysis of titanium using 5.8 minute titanium-51 and rapid radiochemical
separations”, Talanta, Vol. 10, pp.83-89, 1963.
[10] http://en.wikipedia.org/wiki/Iron_ore
[11] Andrey, M. C. M., Galindo Riano, M. D., Leyva, J. A. M., and Vargas, M. G., “Spectrophotometric determination of trace amounts of
titanium in geochemical and metallurgical samples”, Analytical Letters, Vol.26(12), pp.2649-2660, 1993.
[12] Tamrakar, P. K., and Pitre, K. S., “Electro analysis of titanium and other metals in bauxite ore”, Reviews in Analytical Chemistry, Vol. 22(2), pp.245-256, 2003.
[13] Singh, V., and Agrawal, H. M., “Qualitative soil mineral analysis by EDXRF, XRD and AAS probes”, Radiation Physics and Chemistry,
Vol.81(12), pp.1796-1803, 2012.
[14] Qiu-hong, X., Jing, L., Yu-long, D., and Qing, M., “Determination of major and minor components in bauxite by X ray Fluorescence
Spectrometry with Fusion sample preparation”, Rock and Mineral Analysis, Vol.2010(02), 2006.
[15] Brown, F. W., and Smith, H., “Analysis of coal ash by atomic absorption spectrometric and spectrophotometric methods: Methods for
sampling and inorganic analysis of coal”, US Geological Survey Bulletin, pp.1823, 1989.
[16] Mendham, J., Denney, R. C., Barnes, J. D., and Thomas, M. J. K., “Vogel’s Textbook of quantitative chemical analysis”, 6th ed. Prentice
Hall, pp.31, 2000.
[17] Muller, R. H., “Instrumental methods of chemical analysis” Industrial and Engineering Chemistry, Analytical Edition, Vol.13(10),
pp.667-754, 1941.
[18] Controller General, Indian Bureau of Mines, “Manual of procedures for chemical and instrumental analysis of ores, minerals and ore
[19] Fey, M. V., and Dixon, J. B., “Rapid estimation of iron oxides in soils and clays by spectrophotometric analysis”, Soil Science Society of America Journal, Vol.47(6), pp.1261-1263, 1982.
[20] Bangthanh To, T., Nordstrom, D. K., Cunningham, K. M., Ball, J. W., and McCleskey, R. B., “New method for the direct determination of
dissolved Fe(III) concentration in acid mine waters”, Environmental Science and Technology, Vol.33(5), pp.807-813, 1999.
[21] Pribil, R., and Vesely, V., “Contributions to the basic problems of complexometry: Determination of titanium, iron and aluminium in the
presence of each other”, Talanta, Vol.10(4), pp.383-386, 1963.
[22] Vogel’s textbook of macro and semimicro qualitative inorganic analysis, Longman, London and New York, 5th Edn., 1979.
[23] Carron, N. J., “An introduction to the passage of energetic particles through matter” pp.308, 2007.