Cold Flow Pressure Instability Analysis Using
Magnetic Flowmeter
Suyash Verma
Master’s in Aerospace Engineering, Department of Aerospace Engineering, The Pennsylvania State University, University Park, PA 16801, USA
ABSTRACT: The experimental investigation into nature of major combustion instabilities, occurring inrocket thrust chambers, is presented in this paper. The study dealt mainly with the cold flow of gaseous oxygen, O2, as the oxidizer
in a circular chamber and analyzing the significant oscillation modes. The apparatus for the experiment was exactly similar to a magnetic flowmeter assembly, which is generally used for studying the instabilities via determination of pressure and velocity response function. The excitation frequency, responsible for generating the forced longitudinal oscillation, was varied from 1 kHz to 18 kHz using a direct current (DC) motor attached to a variable power supply. The major oscillatory modes at different excitation frequency were determined along with variation of pressure fluctuations with the change in mean chamber pressure. Power Spectrum analysis using the Fast Fourier Transform was done in order to determine the peak amplitude for the pressure fluctuation, at a mean chamber pressure of 60 psi. The real-time signal obtained using the Kulite high temperature pressure transducer was read and seen through the LabVIEW data acquisition software.
KEYWORDS: Instabilities, Response function, Flowmeters, Mean Chamber Pressure, Oscillation frequency, Transducer, LabVIEW, FFT.
NOMENCLATURE:
a = non-dimensional calibrating constant
a∞ = speed of sound, m/sec
A = sonic throat area, m2
B = Magnetic flux density, webers/m2
L = Length of the chamber, m
u = velocity, m/sec
V = Voltage, Volt
p = Pressure, Pa
P0 = Chamber Mean Pressure, Pa
mb = mass injection rate per area, gm/sec
T = Temperature, K
∆ = Non-isentropic flame temperature contribution, K
Rp = Propellant pressure coupled response function
Rv = Propellant velocity coupled response function
γ = Specific heat ratio
R = Gas constant, J/mol-k
R0 = Radius of the chamber, m
RPM = Revolutions per minute for the motor
∝ = Eigenvalue corresponding to the radial and transverse modes of vibration
q = wave number for longitudinal mode of vibration
n = wave number for transverse mode of vibration
fexc = Excitation frequency, Hz
fq = frequency for longitudinal oscillation, Hz
fm n= frequency for combination of radial and transverse oscillation, Hz
fm,n,q= frequency for combination of longitudinal, transverse and radial oscillation, Hz
I. INTRODUCTION
Combustion instabilities occur when rocket combustion processes in the thrust chambers lack efficient damping mechanisms and the induced vibrational forces grow to a greater extent, causing high pressure oscillations in the chamber. The instabilities which are prominent in case of gaseous propellant combustion, usually fall into the category of acoustic instabilities. Such instabilities are heavily observed and analyzed in case of solid propellant combustion as well. The detailed experimental investigation is very necessary for characterizing the nature of these vibrations since they are responsible for variety of rocket motor hardware damages, overheating of nozzle parts and unwanted changes in thrust magnitude during flight [1].
II. LITERATURE SURVEY
The major traditional methods for studying these oscillations and their response include the T-burner method, rotating valve burner method, analysis using impedance and resonance tubes, etc. Unlike the T-burner and modulated exhaust burner methods, the analysis itself is not required to obtain the propellant pressure-coupled response for the magnetic flowmeter measurements [3]. These measurements also allow the simultaneous determination of the magnetic flow meter calibration coefficient, thus eliminating the need for separate calibration tests. Another noticeable problem associated with T-burner method, is its usage at a single frequency, which is usually the fundamental frequency of the chamber [5]. Similarly, experiments involving rotating valve burners were only capable of analyzing frequency oscillation up to 2 kHz, which is very less compared to magnetic flowmeter method [3].Magnetic flowmeters have other advantages, which allow experimentalists to obtain the imaginary part of the pressure coupled response by measuring the acoustic velocity of the gas flowing through the chamber [2,4].
This experimental investigation analyzes the pressure response for a flow of gaseous oxidizer, Oxygen and its stability characteristics. Longitudinal pressure and velocity oscillations are generated by the means of modulated exhaust, which are excited by alternately restricting and opening a sonic-nozzle throat, through a slotted rotating wheel [2,3,5]. This study will help in obtaining the Admittance, which is a function of frequency, propellant composition and source of disturbance [6]. Such Velocity and pressure coupled admittance functions, determines how a combustion surface (propellant surface in solid propellant) reacts to oscillating velocity and fluctuating pressure.
III. EXPERIMENTAL SETUP
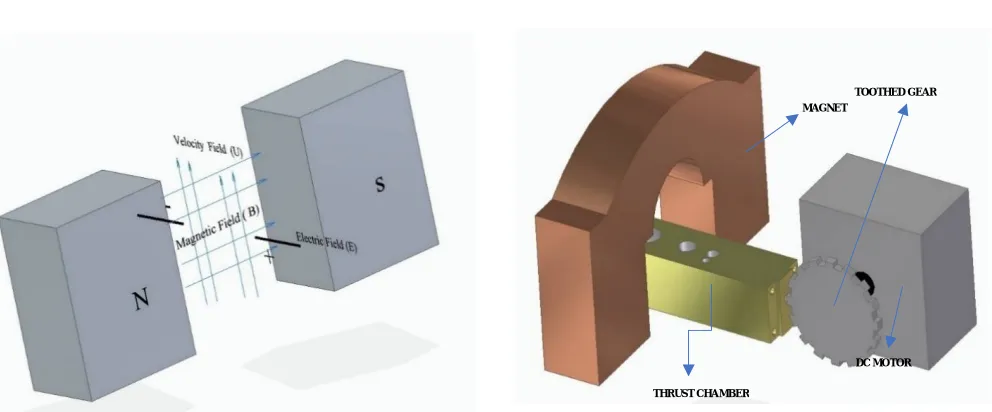
The experimental apparatus is shown in Figure 2 and 3. It represents a Magnetic Flowmeter setup consisting of a large permanent magnet, a thrust chamber, a modulating gear assembly, electrode ports, piezoelectric igniter ports, propellant supply lines and a pressure transducer port. The Magnetic flowmeter which is used for the response measurements in this experiment, works on the Faraday’s laws of electromagnetic induction. It states that whenever a conductor moves in a prescribed magnetic field with a certain velocity, an electric potential is generated within the conductor proportional to the velocity of the conductor [6]. Mathematically, the law is represented as,
= ∗ ∗ (1)
field will generally induce a residual voltage at the ends of the conductor causing an extra discharge of potential. The above equation is modified as:
= ∗ ∗ ∗ (2)
Fig 1: Magnetic Flowmeter Operating Principle. Fig 2: Experimental Assembly for Testing and Analysis
The thrust chamber was kept in between the poles of the permanent magnetic such that the magnetic field cross the chamber in the region where the acoustic response measurement was to be taken. For the present case, the region was taken at the mid length of the thrust chamber. This region, consisted of two electrodes, installed for measuring the oscillatory velocity induced by the modulating gear assembly at the throat of the converging nozzle. Tungsten electrodes were chosen due to their good conductivity at high temperatures. The thrust chamber was made of copper which present the least disturbance to the magnetic fields passing through it.
Fig 3: Schematic representation for the Thrust Chamber used in this Experiment
PRESSURE TRANSDUCER PORT
IGNITER PORT
NOZZLE
ELECTRODE PORT
FUEL SUPPLY PORT OXIDIZER SUPPLY PORT THRUST CHAMBER
DC MOTOR MAGNET
Two propellant supply lines were installed for carrying the fuel, Methane (CH4) and the oxidizer, Oxygen (O2), from
their pressurized gas cylinders. These supply lines are first attached to their respective rotameters for measuring the mass flow rate required for a complete combustion in the thrust chamber, which are then attached to the chamber. Careful attention was given for avoiding any gas leakage through attachment fittings, as they may lead to a different mass flow rate causing an incomplete combustion. The premixed propellant mixture, was then ignited by a gas-grill piezoelectric ignitor installed just before the electrodes. The electrodes, ignitor and the pressure transducer entered the chamber through CONAX connectors ensuring a proper insulation, both for electrical discharge and the high temperature resulting from combustion.
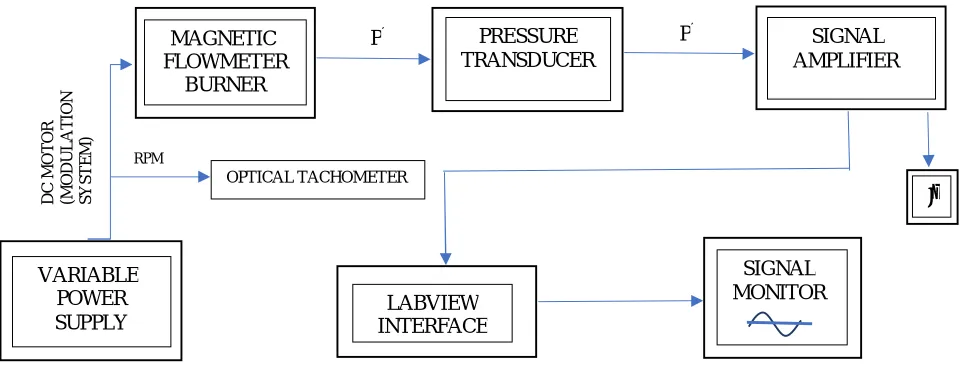
The velocity and pressure coupled oscillations were produced externally through a toothed gear attached to a DC motor. The DC motor had a varying power supply for running at different RPM’s and therefore leading to different excitation frequencies. The motor RPM was measured by an optical laser-based tachometer. The data for the pressure oscillations was then fed to the LabVIEW interface and the signal could be seen on the monitor display.
Type equation here.
Fig 4: Block Diagram for the Data Acquisition and Electronics
IV. ANALYSIS
The analysis for obtaining a response function assumes the one-dimensional constant area, unsteady, compressible equations for the conservation of mass, momentum and energy, for the gaseous propellant flow through the chamber. The detailed derivation and explanation for the response function is discussed in reference [2]. The response functions are written in the form given below:
= [ + ] [ ̅] (3) = [ + ]
[ ] (4)
The above expressions describe the nature for both the pressure and velocity oscillation respectively. But for this experiment, we were concerned only with the pressure oscillations generated in the chamber, for a gaseous flow of oxygen. Generally, the analysis done by Micci., [2] suggested that the amplitude of the velocity oscillation is a strong function of both the imaginary part of the pressure coupled response and the real part of the velocity coupled response. The phase on the other hand, was found to be a strong function of both the real part of the pressure coupled response and imaginary part of the velocity coupled response.
The mass flow rates of oxidizer and fuel mixture, for the choked nozzle flow (Mach No.(M) = 1), was calculated by the expression:
̇
=
∗√
∗
∗
( )[
( )
( )]
(
5)This was important in order to ensure that a complete combustion occurs in the thrust chamber. The flow rates for the given chamber pressure and at a temperature of 2230 K, are listed in Table [1].
Table 1: Mass Flow Rates at Different Chamber Pressures
The experiment also discusses the variation of the pressure oscillation as seen with respect to the mean chamber pressure and also the excitation frequency, produced by the motor. The excitation frequency was calculated by the expression:
= ℎ ∗
60 (6)
The number of tooth were 72, for the gear used in this experiment.
The circular frequency of oscillation [7] for different modes in the chamber was also calculated in order to determine the strongest vibrating mode. The formulation is determined as follows:
The oscillation frequency for the longitudinal mode of vibration, for a half wave tube is given by:
= ∗
2∗ (7)
The frequency of transverse modes in cylinder is given by:
, =
∝ ∗
2∗ ∗ (8) S.
No
PRESSURE (Pa) PRESSURE (psi) MASS FLOW (Gm/sec)
1. 344738 50 3.216
2. 413583.6 60 3.858
3. 482514.2 70 4.501
4. 551444.8 80 5.144
5. 620375.4 90 5.788
The circular frequency of the combination is hence given by:
, , = , + (9)
Substituting (1) and (2) in (3), we get:
, , = 2 (
∝ ,
∗ ) + ( ) (10)
This is the final equation.
The frequencies (kHz) for the longitudinal and transverse modes are listed in Table [2]:
Table 2: Frequencies for Longitudinal and Transverse modes
V. RESULTS
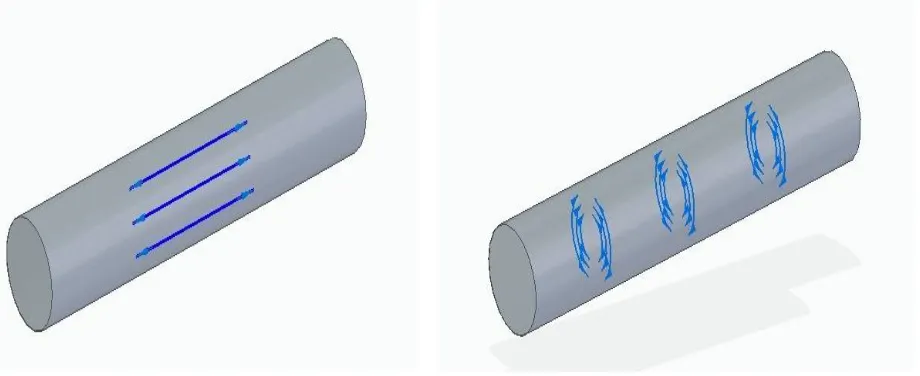
The major oscillation modes induced in the thrust chamber comprised primarily of the longitudinal vibrations, which are generally observed to be most prominent at lower excitation frequencies. Transverse oscillation modes generally occurred in combination with the longitudinal modes, at excitation frequencies greater than 7 kHz. These transverse modes generally occur around the circumference of the chamber, as shown in the Figure 5. Figure 6 shows the longitudinal modes. The results discussed below were obtained with the cold flow of gaseous Oxygen at different chamber pressures.
Fig 5: Longitudinal Mode of Vibration Fig 6: Transverse Mode of Vibration
q 0 1 2 3 4 5 6
n - - - -
0 - 0 1.086 2.173 3.259 4.3464 5.433 6.51
Figure [7] shows the power spectrum or amplitude spectrum of the pressure signal obtained at an excitation frequency of 14 kHz. The chamber pressure was set to 60 pounds per square inch (psi). As seen in the figure, the maximum amplitude is obtained at the fundamental frequency of 120 Hz with other smaller peaks at subsequent harmonics. This amplitude is quite important as it corresponds to the major oscillatory mode for the chamber pressure of 60 psi, and also allows us to study its variation at different chamber pressures and different excitation frequencies.
Fig 7: Power Spectrum for the Pressure Signal Obtained at 14 kHz Excitation Frequency
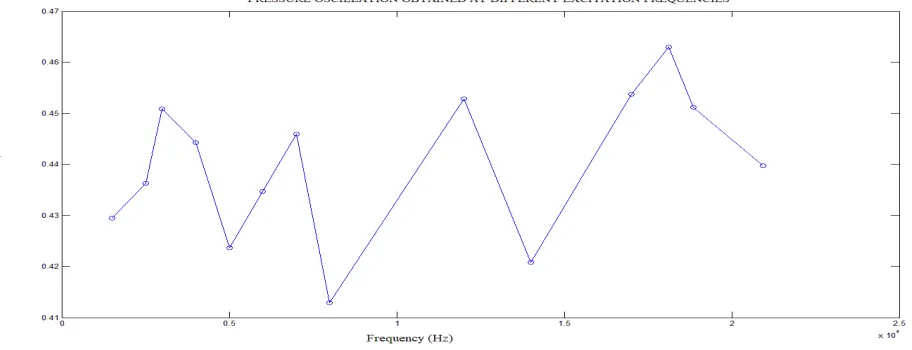
The amplitudes corresponding to the major frequency oscillations is then divided by the mean chamber pressure, P’/ , and is plotted against their respective excitation frequencies. These excitation frequencies were obtained at different motor RPM’s to study the occurrence of significant oscillation modes at those frequencies. The chamber pressure was fixed at 60 psi for all motor RPM’s. The graph is shown in Figure 8. The variation very well agrees with those shown by the cold flow test measurements, done by Wilson J.R., [9]. The peaks occurring at lower frequencies corresponds to the longitudinal mode of vibrations. At higher frequencies, the peaks correspond to the combination of a longitudinal and a transverse mode.
The variation of the amplitude and chamber pressure ratio is also noticed at different chamber pressures, obtained with the cold flow of oxygen. Figure 9 shows this variation. The motor RPM and hence the excitation frequency was fixed to 11,667 and 14 kHz respectively. We noticed that the ratio varied inversely with the chamber pressure. The pressure oscillations were observed to be maximum at lower chamber pressures, during which the resonating sound of major oscillation modes was quite loud. As the pressure was increased to higher values, the oscillations and disturbance produced by the rotating gear, decreased significantly, thereby lowering the level of whistling sound, prominent at lower chamber pressures. The reason might be attributed to higher flow speeds, due to which the disturbance might not be able to penetrate the chamber significantly, leading to lesser amplitudes for the longitudinal mode of vibration. This result was also well in agreement with those obtained by Wilson J.R., [9].
Fig 9: Pressure Oscillation Variation with the Mean Chamber Pressure
VI. CONCLUSION
Cold flow test for pure oxygen supply were done in a magnetic flowmeter assembly consisting of a small thrust chamber. Pressure oscillations were induced with the help of a rotating toothed gear attached to a variable speed DC motor. The nature of these oscillations was studied and characterized based on the peak amplitude variation at different excitation frequencies. At frequencies lower than 7 kHz, the longitudinal modes were the only prominent oscillatory modes with some peaks observed at 3 kHz and 7 kHz frequencies. As the excitation frequency is increased beyond 7 kHz, the combination of longitudinal and transverse modes starts to occur, as shown by some peaks at 12 kHz and 18.123 kHz. The pressure perturbations were also seen to be decreasing with an increase in the chamber pressure and net mass flow rate of pure Oxygen.
VII. ACKNOWLEDGEMENT
REFERENCES
1) Sutton, G.P., Biblarz, O., “Rocket Propulsion Elements,” 8th edition, John Wiley and sons, Inc., 2010.
2) Micci, M.M., “Linear acoustic analysis of solid propellant pressure-coupled distributed combustion,” Journal of Propulsion, Vol.12, No.6,1996. 3) Micci, M.M., Caveny, L.H., “MHD measurement of acoustic velocities in rocket motor chambers,” AIAA Journal, 1980.
4) Micci, M.M., Caveny, L.H., Summerfield, M., “Solid Propellant Rocket Motor responses evaluated by means of forced longitudinal waves,” AIAA/SAE 13th Propulsion Conference, 1977.
5) Micci, M.M., Caveny, L.H., Sirignano, W.A., “Linear analysis of forced longitudinal waves in rocket motor chambers,” AIAA Journal, 1979. 6) Hulka, J.R., Micci, M.M., “Direct measurement of high frequency solid propellant velocity coupled admittances,” AIAA 25th Aerospace
Sciences Meeting, 1987.
7) Farago, Z., Oschwald, M., “Resonance Frequencies and Damping in Combustion Chambers with Quarter Wave Cavities,” 6th Symposium on
Launcher Technologies, Munich, 2005.
8) Kuo, K., Summerfield, M., “Fundamentals of Solid Propellant Combustion,” Progress in Aeronautics and Astronautics, Volume 90.
9) Wilson, J.R., “Direct Measurement of High Frequency Solid Propellant Pressure-Coupled Responses,” Thesis, Department of Aerospace Engineering, The Pennsylvania State University, 1985.
10) T'ien, J. S., "Oscillatory Burning of Solid Propellants including Gas Phase Time Lag," Combustion Science and Technology, Vol. 5,1972, pp. 47-54.
11) Levine, J. N. and Andrepont, W. C., "Measurement Methods of Transient Combustion Response Characteristics of Solid Propellant—An Assessment," AIAA Paper 79-1209, June 1979.