Semi-Global Inference in Phenotype-Protein Network
Siliang Xia1, Guangri Quan2, Yongbo Zhao3, Xuhui Jia4 1
Institute of Architecture of Application Systems, University of Stuttgart, Stuttgart, Germany 2
School of Computer Science, Harbin Institute of Technology at Weihai, Weihai, China 3
Institute of Microelectronics, Chinese Academy of Sciences, Beijing, China 4
Department of Computer Science, The University of Hong Kong, Hong Kong, China Email: [email protected]
Received May2013
ABSTRACT
Discovering genetic basis of diseases is an important goal and a challenging problem in bioinformatics research. In- spired by network-based global inference approach, Semi-global inference method is proposed to capture the complex associations between phenotypes and genes. The proposed method integrates phenotype similarities and protein-protein interactions, and it establishes the profile vectors of phenotypes and proteins. Then the relevance between each candi- date gene and the target phenotype is evaluated. Candidate genes are then ranked according to relevance mark and genes that are potentially associated with target disease are identified based on this ranking. The model selects nodes in integrated phenotype-protein network for inference, by exploiting Phenotype Similarity Threshold (PST), which throws lights on selection of similar phenotypes for gene prediction problem. Different vector relevance metrics for computing the relevance marks of candidate genes are discussed. The performance of the model is evaluated on Online Mendelian Inheritance in Man (OMIM) data sets and experimental evaluation shows high performance of proposed Semi-global method outperforms existing global inference methods.
Keywords: Diseases Gene Prioritization; Phenotype-Protein Network; Semi-Global Inference; Phenotype Similarity Threshold
1. Introduction
It is challenging for biomedical research to figure out the genetic basis of diseases. Traditional biology researchers adopt linkage analysis and association studies [1] to dis- cover disease genes, which firstly locate disease genes in a chromosome region. However, the resolution of this approach is low and further analysis of candidate genes in a large genomic region is an expensive task, which prevents gene identification even after a region has been detected.
Many studies have tried to discover disease genes with computational methods. Some work related was based on annotations [2-4], or based on sequences [5]. But, the methods rely on functional annotations are limited be- cause only a small part of genes in the genome have been annotated currently and methods based on sequencing is an expensive task. Moreover, they treated disease genes as separate and independent, however, biological pro- cesses are not realized by a single molecule, but rather by the complex interactions of proteins, and the breakdown in protein interaction networks could result in diseases [6]. Moreover, some research indicates that phenotypi- cally similar diseases are caused by functionally related genes [7], and the proteins coded by these functionally
related genes usually have direct or indirect interactions [8]. From this perspective, disease genes could then be investigated through the interaction networks of disease proteins.
Recently, researchers took advantage of the computing method to build biological network to help explore the relationship among biological information in multiple granularity, and network approach in biology is proposed and under active research [9], which also facilitates dis- ease gene discovery. A wide range of methods are pro- posed based on network methods for disease gene priori- tization [10-16]. A method utilizing Bayesian predictor and ranking of protein complexes linked to human dis-
eases is proposed by Kasper Lage et al. to predict genes
of human’s inherited phenotypes [13]. Xuebing Wu et al.
proposed network-based global inference approach [14]. These methods achieve some accomplishments in disease gene prioritization, which primarily relies on analysis of the topological properties of PPI networks and the ex- pectation that the products of genes that are associated with similar diseases interact heavily with each other.
integrated phenotype-protein network for building profile vectors of candidate genes and target disease, by ex- ploiting Phenotype Similarity Threshold (PST). The model evaluates the relevance between candidate genes and the given target phenotype. Candidate genes are then ranked according to relevance marks. Genes that are po- tentially associated with target disease are prioritized based on this ranking. To evaluate the effectiveness of the model, the proposed model is tested on known phe- notype and gene pairs from OMIM. Our research has three contributions:
• Semi-global inference method with Phenotype Simi-
larity Threshold (PST) is proposed to prioritize candi- date disease genes. The experimental result shows the proposed Semi-global method outperforms existing global inference method.
• Phenotype Similarity Threshold (PST) is defined to
make a difference between high similarities and low similarities and to distinguish between diseases closely related to target disease and diseases less related, which specifies phenotypes in the network to be con- sidered and exploited for inference. Two methods (S-PST, D-PST) to get PST are introduced and com- pared.
• Performance of proposed model with different vector
relevance metrics (Pearson correlation coefficient, Euclidean distance and Cosine similarity) are eva- luated and compared. We show that Semi-global infe- rence works well with Euclidean distance and Cosine similarity.
In Section 2, we briefly introduce the background of network based candidate gene prioritization by describ- ing the problem formally and discussing the related work and their limitations. Section 3 presents Semi-global in- ference model and explains strategies of PST to select nodes in phenotype-protein network. Section 4 shows experimental results of proposed Semi-global inference
model with variation of relevance metrics and PST,and
comprehensively compares the performance of proposed model against an existing global inference method. In Section 5, we draw some conclusions and point out fur- ther work.
2. Background
2.1. Network Based Candidate Gene Prioritization
Here is a brief description of network-based disease gene prioritization problem referring to [17]: given target dis- ease d, the input to the candidate disease gene prioritiza-
tion problem consists of two sets of genes, known set K
and candidate set C. The known set K contains prior
knowledge of the disease d, e.g., it is the set of genes
known to be associated with d and diseases similar to d.
Each gene g ∈ K is associated with a similarity score
σ(g, d), indicating the known degree of association be-
tween g and d. The candidate set C contains candidate
genes, one or more of which is potentially associated
with target disease d (e.g., these genes might be in the
linkage interval of d that is identified by association stu-
dies). The purpose of network based disease prioritiza-
tion is to use a PPI network G = (V, E), to compute a
score φ(v, D) for each gene g ∈ C that represents the
likelihood of g to be associated with d.
The PPI network G = (V, E) consists of a set of gene
products V and a set of undirected interactions E between
these gene products, in which uv ∈ E represents an
interaction between u ∈ V and v ∈ V. In this network,
the set of interacting partners of a gene product v ∈ V is
defined as N(v) = {u ∈ V: uv ∈ E}.
Global prioritization methods use this network infor-
mation to compute φ by propagating σ over G. Candidate
genes with high relevance to target disease of interest are ranked in the top and are regarded as the disease genes.
2.2. Related Work
Xuebing Wu et al. have proposed network-based global
inference approach called CIPHER algorithm [14], in which Pearson correlation coefficient is adopted to eva- luate the relevance between candidate genes and the tar- get disease. Another global inference method is proposed based on a network propagation algorithm to formulate constraints on the prioritization function [16].
Although these existing global network based methods to some extent throw lights on disease gene prioritization problems, they have some drawbacks and limitations.
Research of Xuebing Wu et al. is based on the assump-
tion of the linear correlation between profiles of pheno- types and disease genes, which shows some bias against genes whose related proteins have few interactions with other peers [14]. Moreover, as reported in literatures, network based global inference methods, favor genes whose products are highly connected in the network and perform poorly in identifying loosely connected disease genes, due to centrality of target disease genes [17] and incomplete and noisy nature of the PPI data [18].
no methods make a difference between high similarities and low similarities, which might be considered to de- termine which related diseases to refer in gene prioritiza- tion problems.
Our research aims at exploring the uncovered areas mentioned and overcoming limitations of global infe- rence methods. We propose Semi-global inference me- thod by exploiting PST as the criteria to select pheno- types in network for inference, which is the essential difference between proposed Semi-global model and existing global inference methods.
3. Methodology
In this section we present the mathematical model and show the general framework of gene prioritization algo- rithm of Semi-global inference. Furthermore, we explain how Phenotype Similarity Threshold is exploited for nodes selection in phenotype network, which is the core of Semi-global inference model.
It is important to note that the purpose here is to infer functional associations between genes from functional and physical interactions between their products. For this reason, any reference to interactions between genes in this paper refers to the interactions between their prod-ucts. Meanwhile, disease gene prioritization is inferred from phenotypically similar diseases, term disease and term phenotypes deliver identical conception in this pa-per.
3.1. Mathematical Model
• Undirected graph
(1)
is defined as phenotype similarity network;
is a subset of all the phenotypes,
; and the element
is the similarity of phenotypes .
• Undirected graph
(2)
is defined as protein interaction network;
is a subset of all the proteins,
; and the element
denotes the interaction of proteins .
• Given a phenotype , , set
(3)
is defined as association set of ; each element
in is an association of ;
set
(4)
is defined as global association set, which contains all phenotype-protein associations.
• Given phenotype similarity network GPhenotype, pro-
tein interaction network and global asso-
ciation set , set
(5)
is phenotype-protein network.
• Given a phenotype and a protein ,
,
(6)
denotes one dimension of the profile vector of protein .
• Phenotype Similarity Threshold (PST) is a manually
set similarity value that satisfies
(7)
• Given a phenotype , set
(8)
contains the phenotypes that have similarities higher or
equals to PST with . Each element in is de-
fined as a Closely Related Phenotype of .
• Given a phenotype , , if
, then is used as a dimension in pro-
file vector of ; vector
j
p (9)
characterizes the profile of in phenotype similarity
network, in which . Means only the similar-
ities of Closely Related Phenotypes (higher than PST) are used to build the profile vector of a target phenotype of interest.
• Given a phenotype and a protein ,
, if , then is used as
a dimension of vector of ; vector
k
g (10)
characterizes the profile of in Protein Network, in
which .
Given a phenotype and a protein , let
denote a relevance metric of vector pj and
vector gk. Three different metrics are defined, which
characterize the correlation between profile vectors of
protein and phenotype and thus indicate the
relevance of candidate protein and target phenotype
. Let denote Euclidean distance of two vectors,
(11)
Cosine similarity is a metric measuring the included
angle of two vectors, which is denoted as ,
, p
GPhenotyp=<P E >
1 2 3
{ , , m}
P= p p p …p
P =m Ep ={Sjk |pj,pk∈P} Sjk
,
j k
p p
g GProtein =< G,E >
1 2 3
{ , , n}
G= g g g …g
G =n Eg ={Ijk |g gj, k∈G} Ijk
,
j k
g g
j
p ∈P ∀ ∈gk G
j
CAssociation
={< ,p gj k >|gk∈ ∧G gk is associated with }pj
j
p
,
j k
p g
< > CAssociationj pj
1 = m j j CAssociation CAssociation =
GProtein CAssociation , ,N=<GPhenotype GProtein CAssociation>
j
p ∈P gk∈G
x y
p P g G
∀ ∈ ∀ ∈
( k, x) { ky| x, y x}
f g p =Max I < p g >∈CAssociation
k g
{ jk| j, k } { jk| j, k }
Min s p p ∈P ≤PST≤Max s p p ∈P
j p ∈P
{ | }
j k k jk
CRP = p p ∈ ∧P s ≥PST
j
p CRPj
j p
j
p ∈P ∀ ≤ ≤1 r m
r
ji
s ≥PST
s
jirj p
1 2 3
( , , )
r
ji ji ji ji
S S S S
= …
j p
1 2... r i <i <i
j
p ∈P gk∈G
1 r m
∀ ≤ ≤
r
ji j
p ∈CRP ( , )
r
k i
f g p
k g
1 2 3
( ( , ), ( , ), ( , ) ( , ))
r
k i k i k i k i f g p f g p f g p f g p
= …
k g
1 2... r i <i <i
j
p ∈P gk∈Gj
(p gj, k)
ϕ
k
g pj
k g
j
p ϕ1
1 2 2 1 , 1 ( , ) ( ( ( )) ) m
j k ji k i
i
p g S f g d
ϕ
=
=
∑
−(12)
Pearson correlation coefficient indicates linear correla-
tion between two vectors, which is denoted as ,
(13)
3.2. Phenotype Similarity Threshold (PST)
According to the biological assumption that phenotypi- cally similar diseases are caused by functionally related genes [7], the proposed Semi-global inference model takes into consideration only phenotypes that are highly similar to target disease, with similarities higher than PST. We use only those Closely Related Phenotypes (re-
fer to (8)) of and exploit corresponding similarities
to characterize the target phenotype. Therefore, In (9)
and (10), given a phenotype , the dimensions of profile
vector pj are determined by the number of phenotypes
in , the dimensions of profile vector of candidate
genes are reduced correspondingly.
3.3. Semi-Global Inference
Based on the mathematical model above, here we give the computation framework of proposed semi-global inference method, which consists of two algorithms to prioritize candidate disease genes.
Algorithm 1 Relevance Mark Calculation calculates
the relevance mark for a given pair of target phenotype
and candidate protein . Algorithm 2 Disease
Gene Prioritization takes a target phenotype as the input and evaluates relevance mark for all candidate proteins in linkage interval, then prioritizes the candidate proteins based on their relevance marks. Proteins with high re- levance mark are regarded highly related to target phe- notype and thus genes associate with these top ranked proteins are the underlying causing genes of target dis- ease, as the predictive result of Semi-global inference model.
In practice, each of metrics (11) or (12) (13) are tested respectively in Algorithm 1 as relevance evaluation of candidate proteins. Algorithm 2 is invoked to prioritize candidate genes for all phenotypes we are interested in.
4. Results
In this section, we comprehensively evaluate the perfor- mance of proposed Semi-global inference model with different setting of metrics and PSTs. Then we compare proposed model to global inference method.
4.1. Datasets
To evaluate the proposed model, data sets needed are
listed as follows: Phenotype set and quantified similari- ties between each pair of phenotypes. Protein set and quantified protein interaction between each pair of pro- teins. Set of known pairs (associations) of phenotypes and associated proteins, which serves as the validation set.
Phenotype set and their linkage intervals are obtained from Online Mendelian Inheritance in Man (OMIM) Morbid Map [19], which provides a publicly accessible and comprehensive database of genotype-phenotype re- lationship in humans; phenotype similarities come from
the research of van Driel et al. [20]; quantified protein
interaction marks are extracted from STRING database [21] to build PPI network; chromosome mapping of pro- teins are extracted from Ensembl database [22]; valida- tion set can be built from phenotype-protein network, by extracting the phenotype-gene mapping from OMIM Morbid Map and gene-protein mapping from bioDBnet database [23] and mapping phenotype network to PPI network.
Those phenotypes that can not be mapped to proteins are removed, due to lack of known associated genes or incomplete information of proteins coded by genes in the linkage interval. We finally get 1897 phenotypes and 84652 proteins in total, while only 156584 protein-pro- tein interactions are available. Those missing PPI records are regarded as zero. 2549 known phenotype-gene pairs are maintained for evaluation.
4.2. Experimental Setting
We apply leave-one-out cross-validation in order to eva- luate the performance of different methods in terms of accuracy of disease gene prioritization. For each disease of interest, we conduct following experiment:
• We remove all associations of this target disease from
global association set (refer to (4)).
• All the genes in the linkage interval are regarded as
candidate genes to be prioritized. On average, there are 750 candidate genes in the linkage interval of a disease.
• In practice, we exploit Position Parameter to get
PST: Phenotype similarities are sorted in an array in ascending order, then PST is assigned as the value re-
trieved from the array with index of (array size * ),
so PST is determined by assigning a value from
zero to one. It is important to note that when ,
all the nodes in phenotype network are considered in inference. In this case, Semi-global model degenerates into global inference. Thus, global inference method is
a case of proposed Semi-global model when .
We conduct experiment with two methods to get PST:
Static method (S-PST). All the phenotype similarities are sorted in one array. PST is a global static value for all target diseases during the experiment.
2( , ) cos( , )
| || | j k
j k j k
j k p g
p g p g
p g
ϕ = = ⋅
3 ϕ
3
cov( , ) ( , )
( ) ( ) j k j k
j k p g p g
p g
ϕ
σ σ
=
j p
j p
j CRP
j
p gk
λ
λ λ
0
λ=
0
Dynamic method (D-PST). PST is retrieved from a smaller phenotype similarity set containing only the si- milarities related to current target disease. Different PSTs are gained for prediction of different target diseases, ac- cording to the similarity range of that target disease.
• We conduct the experiment with each combination of
relevance metrics and PST methods.
• In order to systematically compare the performance of
proposed model, we use following evaluation criteria:
Average Rank. Average rank in proposed model of known disease genes.
Fold Enrichment. Ability to enrich known disease genes over random selection [13].
Distribution of Cases. Percentage of the test cases ranked within top 1%, top 5% and top 10%.
4.3. Experiment with Variation of PST and Relevance Metrics
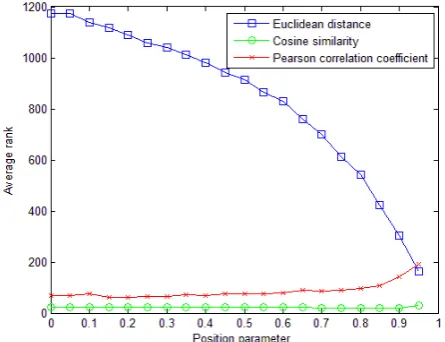
Proposed model with Euclidean distance shows a rapid
increase of average rank with the increase of λ, though
the performance is always poorer than that of model with the other two relevance metrics. The model exhibits a high average rank with high PST (high Position Parame-
ter λ) using S-PST, in spite of relevance metrics adopted.
For model with Euclidean distance and Cosine simi- larity, fold enrichment gets higher along with the
in-crease of . On the other hand, Figure 1 to Figure 4
show that proposed model with Cosine similarity gets higher performance than the other two relevance metrics.
Moreover, the trend of the performance with increasing λ
[image:5.595.310.537.87.265.2]shows that the model gains better performance when highly similar diseases are referred to profile target dis- ease and candidate genes, in which the profile vectors consist of only a few dimensions and only small part of nodes (eg. diseases holding top 5% highest similarities in whole phenotype network in S-PST and diseases holding
[image:5.595.309.537.306.489.2]Figure 1. Average rank to compare the performance of pro- posed model using S-PST with different relevance metrics.
[image:5.595.310.538.528.707.2]Figure 2. Average rank to compare the performance of pro-posed model using D-PST with different relevance metrics.
Figure 3. Fold enrichment to compare the performance of S-PST model with different metrics.
Figure 4. Fold enrichment to compare the performance of S-PST model with different metrics.
[image:5.595.61.284.536.707.2]top 5% highest similarities to the target disease in D-PST) are exploited. Therefore it indicates the strategy that re- ferring only part diseases in proposed Semi-global model works well with these two relevance metrics (especially with Euclidean distance) and nodes selection with PST and dimension reduction of profile vectors achieves per- formance improvement.
Model with Pearson correlation coefficient reaches its
best performance when λ=0 (global inference method)
and shows a decline with increase of λ. Therefore, pro-
posed Semi-global inference does not increase the per- formance if Pearson correlation is adopted as the relev- ance metric.
4.4.Comparison to Global Inference Method
Here we discuss the cases when D-PST is exploited with
a certain λassigned to get the relative high performance
using different relevance metrics and compare them to global inference method using CIPHER algorithm [14] with the same relevance metric.
Table 1 and Table 2 demonstrate that Semi-global
model with D-PST and high λ outperforms global infe-
rence method using same relevance metrics. Especially
for Euclidean distance, when λis assigned with a high
value, Semi-global model shows much higher perfor- mance than global inference.
D-PST and Cosine similarity work as the best combi- nation, with which proposed model reaches a high per- formance with fold enrichment being 217.62 when
0.96
λ = and average rank being 16.29 when λ =0.92.
[image:6.595.307.540.122.224.2]In this configuration, Semi-global model takes into ac- count top 4% most similar diseases of the target disease for inference, outperforms the highest fold enrichment of 197.60 and average rank of 22.31 in global inference method.
[image:6.595.56.287.573.626.2]Table 3 shows that with same relevance metrics, more known disease genes are ranked within top 1%, top 5%
Table 1. Fold enrichment to compare performance of pro- posed Semi-global model to a global inference method.1
ED CS PCC
Global inference
(CIPHER) 55.44 159.71 197.60 Semi-global inference
(D-PST)
177.03 (λ=0.991)
217.62 (λ=0.96)
[image:6.595.57.288.660.716.2]197.60 (λ=0)
Table 2. Average rank to compare performance of proposed Semi-global model to a global inference method.1
ED CS PCC
Global inference
(CIPHER) 1172.60 22.31 67.94 Semi-global inference
(D-PST)
81.46 (λ=0.995)
16.29 (λ=0.92)
56.43 (λ=0.1)
Table 3. Percentage of the known disease genes ranked within top 1%, top 5% and top 10% in proposed Semi- global model and a global inference model.1,2
Top 1% Top 5% Top 10%
Global inference (CIPHER)
ED 0.21 0.25 0.26 CS 0.64 0.93 0.97 PCC 0.72 0.91 0.94 Semi-global
inference (D-PST)
ED (λ=0.995) 0.59 0.82 0.85 CS (λ=0.96) 0.75 0.94 0.98 PCC (λ=0) … … …
and top 10% in proposed Semi-global model using D-PST than that in global inference method. It also shows D-PST and Cosine similarity in proposed model achieves better performance than other combinations of PST methods and relevance metrics.
Then, we compare distribution and accumulation of test cases between proposed Semi-global model and global method when they reach their respective high performance with particular experimental settings.
Figures 5 and 6 are general views about distribution and accumulation of test cases of proposed Semi-global model and global inference method with particular set- tings to reach their high performance which are Semi- global model using D-PST with Euclidean distance and , Semi-global model using D-PST with Co-
sine similarity and and CIPHER algorithm
with Pearson correlation coefficient as a representative of global inference. Semi-global model using D-PST and Cosine similarity not only gets better performance in terms of average rank and fold enrichment than global inference, but also generates a more desirable distribu- tion of test cases. It ranks more than 75% cases within top 1%, and the accumulated ratio of test cases is higher than global inference method.
5. Conclusions
In this paper, a Semi-global inference model with PST is proposed for disease gene prioritization, which applies profile vectors in phenotype-protein network to charac- terize target disease and candidate genes. The model is evaluated comprehensively on OMIM dataset and the experimental result shows proposed Semi-global model outperforms existing global inference method.
Phenotype Similarity Threshold (PST) is proposed and Closely Related Phenotypes are defined. It is adopted as a criterion to select diseases in phenotype network to pro- file the target disease. Thus, by considering only highly similar diseases, proposed PST has significance in nodes
0.995
λ=
0.96
λ=
1ED = Euclidean distance, CS = Cosine similarity, PCC = Pearson
correlation coefficient.
2Last row in Table 3 is blank because proposed model with Pearson
Figure 5. Comparison of distribution of test cases between proposed Semi-global model using D-PST and a global infe-rence method.1
Figure 6. Comparison of accumulation of test cases between proposed Semi-global model using D-PST and a global infe-rence method.1
selection in phenotype-protein network for gene prioriti- zation problem, which as a trial demonstrates a novel understanding of the well accepted belief that phenotyp- ically similar diseases are caused by functionally related genes.
Effect of different relevance metrics of profile vectors, different methods and variation of PST on the proposed model are discussed. The proposed model with Cosine similarity as relevance metric shows higher performance than model using other two metrics. Moreover, proposed model achieves performance improvement along with the increase of PST when Cosine similarity and Euclidean distance are adopted as relevance metrics. We have also shown proposed Semi-global model using D-PST exhi- bits higher average rank, fold enrichment and more ad- mirable distribution than global method.
Further research includes configurations of Semi-
global model (proper PST, Position Parameter and re- levance metric) to achieve better performance, sensitivity of proposed model to noise of PPI data, and the issue of bias occurs in global inference.
6. Acknowledgements
This research is supported by National Science Founda- tion of China 60973077.
REFERENCES
[1] D. Botstein and N. Risch, “Discovering Genotypes Un- derlying Human Phenotypes: Past Successes for Mende- lian Disease, Future Approaches for Complex Disease,” Nature Genetics, Vol. 33, 2003, pp. 228-237.
[2] F. S. Turner, D. R. Clutterbuck and C. Semple, “Pocus: Mining Genomic Sequence Annotation to Predict Disease Genes,” Genome Biology, Vol. 4, 2003, p. R75.
[3] J. Chen, C. Shen and A. Sivachenko, “Mining Alzheimer Disease Relevant Proteins from Integrated Protein Inte- ractome Data,” Pacific Symposium on Biocomputing, Vol. 11, 2006, pp. 367-378.
[4] A. Hamosh, A. F. Scott, J. S. Amberger, C. A. Bocchini, and V. A. McKusick, “Online Mendelian Inheritance in Man (OMIM), a Knowledgebase of Human Genes and Genetic Disorders,” Nucleic Acids Research, Vol. 33, Database Issue, 2005.
[5] E. Adie, R. R. Adams, K. L. Evans, D. J. Porteous and B. Pickard, “Speeding Disease Gene Discovery by Sequence Based Candidate Prioritization,” BMC Bioinformatics, Vol. 6, 2005, p. 55.
[6] L. Sam, Y. Liu, J. Li, C. Friedman and Y. A. Lussier, “Discovery of Protein Interaction Networks Shared by Diseases,” Pacific Symposium on Biocomputing, Vol. 12, 2007, pp. 76-87.
[7] G. Jiminez-Sanchez, et al., ”Human Disease Genes,” Na- ture, Vol. 409, 2001, pp. 853-854
[8] M. Oti and H. G. Brunner, “The Modular Nature of Ge- netic Diseases,” Clinical Genetics, Vol. 71, 2007, pp. 1- 11 [9] J. H. Jing-Dong, “Understanding Biological Functions
through Molecular Networks,” Cell Research, Vol. 18, 2008, pp. 224-237.
[10] J. Chen, B. Aronow and A. Jegga, “Disease Candidate
Gene Identification and Prioritization Using Protein Inte- raction Networks,” BMC Bioinformatics, Vol. 10, No. 1, 2009, p. 73 [11] M. Oti, B. Snel, M. A. Huynen and H. G. Brunner, “Pre-
dicting Disease Genes Using Protein-Protein Interactions,” Journal of Medical Genetics, Vol. 43, 2006, pp. 691-698.
[image:7.595.74.279.317.482.2]Interaction Networks for Associating Genes with Diseas- es,” Bioinformatics, Vol. 26, 2010, pp. 1057-1063.
[13] K. Lage, E. O. Karlberg, Z. M. Storling, P. I. Olason, A. G. Pedersen, O. Rigina, A. M. Hinsby, Z. Tumer, F. Po-ciot, N. Tommerup, Y. Moreau and S. Brunak, “A Human Phenome-Interactome Network of Protein Complexes Im- plicated in Genetic Disorders,” Nature Biotechnology, Vol. 25, 2007, pp. 309-316.
[14] X. B. Wu, R. Jiang, M. Q Zhang and S. Li, “Network- Based Global Inference of Human Disease Genes,” Mo- lecular Systems Biology, Vol. 4, 2008, p. 189.
[15] S. Kohler, S. Bauer, D. Horn and P. N. Robinson, “Walk- ing the Interactome for Prioritization of Candidate Dis- ease Genes,” The American Journal of Human Genetics, Vol. 82, No. 4, 2008, pp. 949-958.
[16] Y. Li and J. C. Patra, “Genome-Wide Inferring Gene- Phenotype Relationship by Walking on the Heterogene- ous Network,” Bioinformatics, Vol. 26, No. 9, 2010, pp. 1219-1224.
[17] S. Erten and M. Koyut¨urk, “Role of Centrality in Net- work-Based Prioritization of Disease Genes,” Proceed- ings of the 8th European Conf. Evolutionary Computation, Machine Learning, and Data Mining in Bioinformatics (EVOBIO’10), Vol. LNCS 6023, 2010, pp. 13-25.
[18] A. M. Edwards, B. Kus, R. Jansen, D. Greenbaum, J. Greenblatt and M. Gerstein, “Bridging Structural Biology and Genomics: Assessing Protein Interaction Data with Known Complexes,” Trends in Genetics, Vol. 18, No. 10, 2002, pp. 529-536.
[19] Online Mendelian Inheritance in Man, OMIM®.
McKu-sick-Nathans Institute of Genetic Medicine, Johns Hop- kins University (Baltimore, MD), World Wide Web URL: http://omim.org/
[20] M. A. van Driel, J. Bruggeman, G. Vriend, et al., ”A Text- Mining Analysis of the Human Phenome,” European Journal of Human Genetics, Vol. 14, 2006, pp. 535-542.
[21] D. Szklarczyk, A. Franceschini, M. Kuhn, M. Simonovic, A. Roth, P. Minguez, T. Doerks, M. Stark, J. Muller, P. Bork, et al., “The STRING Database in 2011: Functional Interaction Networks of Proteins, Globally Integrated and Scored,” Nucleic Acids Research, Vol. 39, 2011, pp. D561- D568
[22] E. Birney, D. Andrews, M. Caccamo, Y. Chen, L. Clarke, G. Coates, T. Cox, F. Cunningham, V. Curwen, T. Cutts, et al., “Ensembl 2006,” Nucleic Acids Research, Vol. 34, 2006, pp. D556-D561.
[23] U. Mudunuri, A. Che, M. Yi and R. M. Stephens, “bio- DBnet: The Biological Database Network,” Bioinformat- ics, Vol. 25, No. 4, 2009, pp. 555-556.